Clinical Trial
. 2021 Aug;11(8):1996-2013.
doi: 10.1158/2159-8290.CD-20-1546. Epub 2021 Mar 11.

Tilsotolimod with Ipilimumab Drives Tumor Responses in Anti-PD-1 Refractory Melanoma

Affiliations
Clinical Trial

Tilsotolimod with Ipilimumab Drives Tumor Responses in Anti-PD-1 Refractory Melanoma

Cara Haymaker et al. Cancer Discov. 2021 Aug.

Abstract

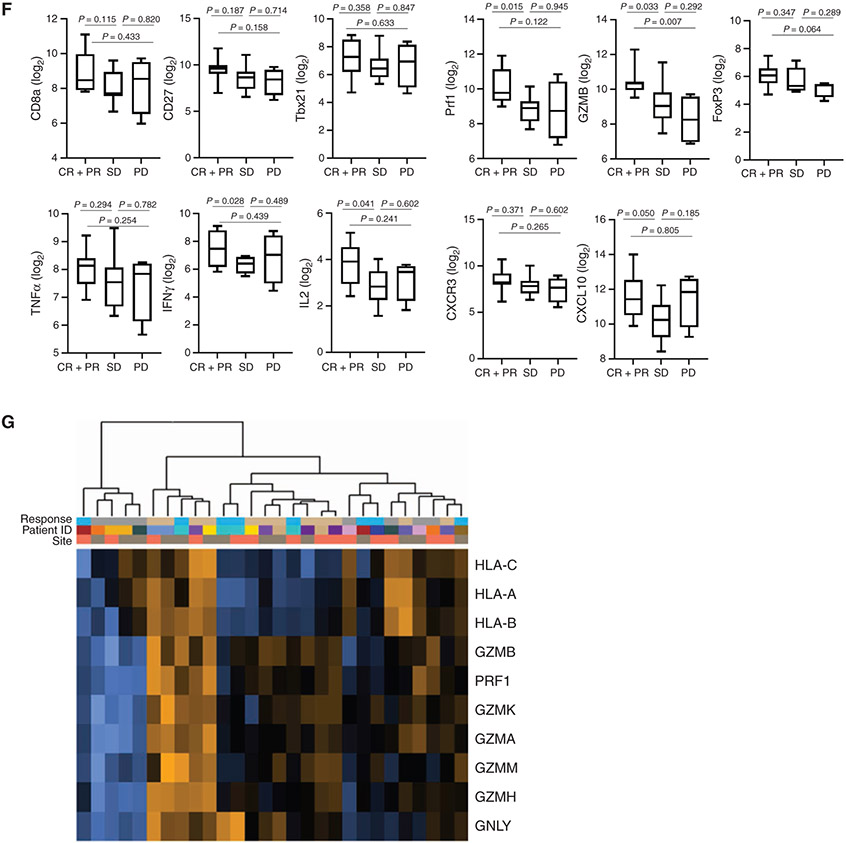
Many patients with advanced melanoma are resistant to immune checkpoint inhibition. In the ILLUMINATE-204 phase I/II trial, we assessed intratumoral tilsotolimod, an investigational Toll-like receptor 9 agonist, with systemic ipilimumab in patients with anti-PD-1- resistant advanced melanoma. In all patients, 48.4% experienced grade 3/4 treatment-emergent adverse events. The overall response rate at the recommended phase II dose of 8 mg was 22.4%, and an additional 49% of patients had stable disease. Responses in noninjected lesions and in patients expected to be resistant to ipilimumab monotherapy were observed. Rapid induction of a local IFNα gene signature, dendritic cell maturation and enhanced markers of antigen presentation, and T-cell clonal expansion correlated with clinical response. A phase III clinical trial with this combination (NCT03445533) is ongoing. SIGNIFICANCE: Despite recent developments in advanced melanoma therapies, most patients do not experience durable responses. Intratumoral tilsotolimod injection elicits a rapid, local type 1 IFN response and, in combination with ipilimumab, activates T cells to promote clinical activity, including in distant lesions and patients not expected to respond to ipilimumab alone.This article is highlighted in the In This Issue feature, p. 1861.


Figures

Figure 1.
Figure 1.
Tumor reduction. A, Maximum percent reduction from baseline in individual sum of the longest diameters (SLD) of target lesions. B, Maximum percent decrease in target lesion diameters in injected and noninjected measurable lesions. C, Baseline and post-therapy imaging of injected lesion (yellow arrow) and noninjected, distant lesions (red arrows) of a patient with complete response to therapy. D, Individual percent change from baseline in the SLD of target lesions. E, Time to and duration of clinical benefit. Patients with CR, PR, or SD are included, and each bar represents one patient. F, Kaplan–Meier estimates (8 mg tilsotolimod + ipilimumab population) of overall survival. G, Progression-free survival. CI, confidence interval; NE, not evaluable. Patient had a 34.5% decrease in tumor burden from baseline but had progressive disease at the subsequent scan. #Patient had a 38.5% decrease in tumor burden from baseline but had progressive disease at the subsequent scan.
Figure 2.
Figure 2.
Tilsotolimod induces an early, local type 1 IFN response gene signature, macrophage influx, and DC1 maturation. A, Study design for tilsotolimod + ipilimumab combination. B, Volcano plot of RNA extracted from the local injected lesion at 24 hours after tilsotolimod compared with baseline (n = 15 unpaired samples). The adjusted P value is indicated. C, IDO expression was assessed in the tumor tissue using chromogenic IHC (n = 13 paired samples). D, The macrophage score was determined using the nSolver advanced analysis tool and is shown in a log2 scale (n = 12 paired samples). E, Live, lineage-negative, CD1c+ myeloid DC1 (mDC1) cells were assessed for HLA-DR expression in the tissue at baseline and 24 hours after tilsotolimod injection. A minimum of 100 events was required for subgating (n = 12 paired samples).
Figure 3.
Figure 3.
Correlations of local cell types with clinical activity. A, Dendritic cell score was determined using the nSolver advanced analysis tool and is shown in a log2 scale according to type of response (n = 14). B, nSolver expression of myeloid markers (n = 14). C, Concentration of soluble PD-L2 (sPD-L2) prior to treatment in patient plasma according to type of response (n = 15). D, Cell-type centered score of each major cell type at baseline in injected lesions as determined by the nSolver advanced analysis tool is shown according to type of response (n = 14). E, Heat map by hierarchical clustering using the T-cell functionality gene set at baseline in both local and noninjected, distant lesions (n = 14). F, nSolver expression of select T-cell functionality and cytotoxicity genes (n = 14). P value indicates significance using an unpaired Student t test. G, Heat map by hierarchical clustering using the cytotoxicity gene set at baseline in both local and noninjected, distant lesions (n = 14).
Figure 3.
Figure 3.
Correlations of local cell types with clinical activity. A, Dendritic cell score was determined using the nSolver advanced analysis tool and is shown in a log2 scale according to type of response (n = 14). B, nSolver expression of myeloid markers (n = 14). C, Concentration of soluble PD-L2 (sPD-L2) prior to treatment in patient plasma according to type of response (n = 15). D, Cell-type centered score of each major cell type at baseline in injected lesions as determined by the nSolver advanced analysis tool is shown according to type of response (n = 14). E, Heat map by hierarchical clustering using the T-cell functionality gene set at baseline in both local and noninjected, distant lesions (n = 14). F, nSolver expression of select T-cell functionality and cytotoxicity genes (n = 14). P value indicates significance using an unpaired Student t test. G, Heat map by hierarchical clustering using the cytotoxicity gene set at baseline in both local and noninjected, distant lesions (n = 14).
Figure 4.
Figure 4.
TIL activation and proliferation on treatment correlates with response to combination therapy. Unsupervised hierarchical clustering using NanoString gene expression profiling (n = 13) of (A) T-cell functional gene signature, (B) cytotoxicity gene signature, and (C) nSolver expression of select T-cell functional signature genes (n = 13). P value indicates significance using an unpaired Student t test. D and E, Proliferation assessed using Ki-67 staining through flow cytometry of CD8+ tumor-infiltrating lymphocytes at baseline, 24 hours after tilsotolimod injection, and at week 8 in tumor lesions (black hashed line) as well as in PBMCs (red hashed line) at baseline, 24 hours post tilsotolimod injection (when available), and week 8. Patients are grouped by response status.
Figure 4.
Figure 4.
TIL activation and proliferation on treatment correlates with response to combination therapy. Unsupervised hierarchical clustering using NanoString gene expression profiling (n = 13) of (A) T-cell functional gene signature, (B) cytotoxicity gene signature, and (C) nSolver expression of select T-cell functional signature genes (n = 13). P value indicates significance using an unpaired Student t test. D and E, Proliferation assessed using Ki-67 staining through flow cytometry of CD8+ tumor-infiltrating lymphocytes at baseline, 24 hours after tilsotolimod injection, and at week 8 in tumor lesions (black hashed line) as well as in PBMCs (red hashed line) at baseline, 24 hours post tilsotolimod injection (when available), and week 8. Patients are grouped by response status.
Figure 5.
Figure 5.
T-cell response is suggestive of shared antigen(s) and abscopal effect. A, Frequency of the top 50 clones in the noninjected, distant tumor lesions at week 8 and baseline for CR + PR (left graph), SD (middle graph), and PD (right graph) patients. B, Individual T-cell clones (top 50) identified at week 8 in the noninjected, distant lesions of individual responding patients assessed for presence at baseline and week 8 in the local, injected lesion and at baseline in the noninjected, distant lesion. Each image represents individual patients, with each circle representing an individual T-cell clone. Clones shared between lesions at all time points are shown in blue. The size of the circle indicates relative frequency at week 8 and the numbers indicate the frequency relative to initial baseline presence. C, Frequency of individual T-cell clones identified at week 8 in the noninjected, distant lesion in the blood at baseline and on treatment (week 5 and/or week 8) as indicated. Each color indicates an individual T-cell clone. The number indicates the number of the 50 clones found in the blood at each time point tested. PD, progressive disease.

References

    1. Zimmer L, Apuri S, Eroglu Z, Kottschade LA, Forschner A, Gutzmer R, et al. Ipilimumab alone or in combination with nivolumab after progression on anti-PD-1 therapy in advanced melanoma. Eur J Cancer 2017;75:47–55. - PubMed
    1. Bowyer S, Prithviraj P, Lorigan P, Larkin J, McArthur GA, Atkinson V, et al. Efficacy and toxicity of treatment with the anti-CTLA-4 anti-body ipilimumab in patients with metastatic melanoma after prior anti-PD-1 therapy. Br J Cancer 2016;114:1084–9. - PMC - PubMed
    1. Long GV, Robert C, Blank CU, Ribas A, Mortier L, Schachter J, et al. Outcomes in patients (pts) treated with ipilimumab (ipi) after pembrolizumab (pembro) in KEYNOTE-006. Pig Cell Mel Res 2017;30:118.
    1. Hellmann MD, Ciuleanu TE, Pluzanski A, Lee JS, Otterson GA, Audigier-Valette C, et al. Nivolumab plus ipilimumab in lung cancer with a high tumor mutational burden. N Engl J Med 2018;378:2093–104. - PMC - PubMed
    1. van Rooij N, van Buuren MM, Philips D, Velds A, Toebes M, Heemskerk B, et al. Tumor exome analysis reveals neoantigen-specific T-cell reactivity in an ipilimumab-responsive melanoma. J Clin Oncol 2013;31:e439–42. - PMC - PubMed

Publication types