Review
. 2021 Mar;9(3):e002087.
doi: 10.1136/jitc-2020-002087.

Interrogation of the cellular immunome of cancer patients with regard to the COVID-19 pandemic

Affiliations
Review

Interrogation of the cellular immunome of cancer patients with regard to the COVID-19 pandemic

Renee N Donahue et al. J Immunother Cancer. 2021 Mar.

Abstract

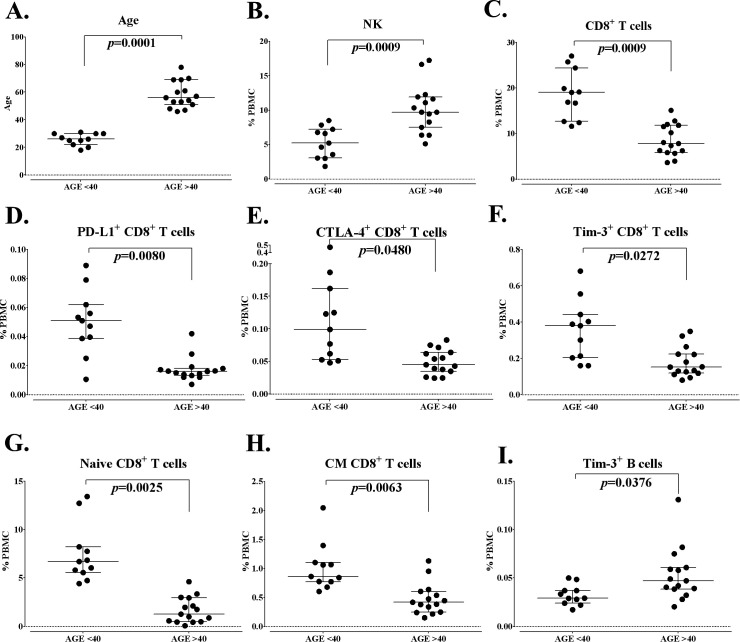
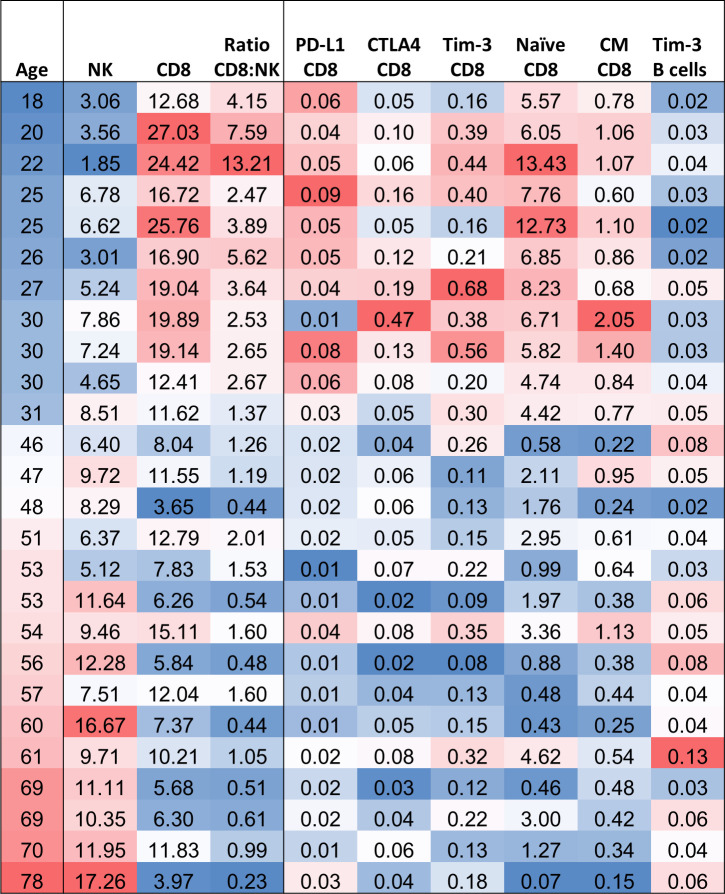
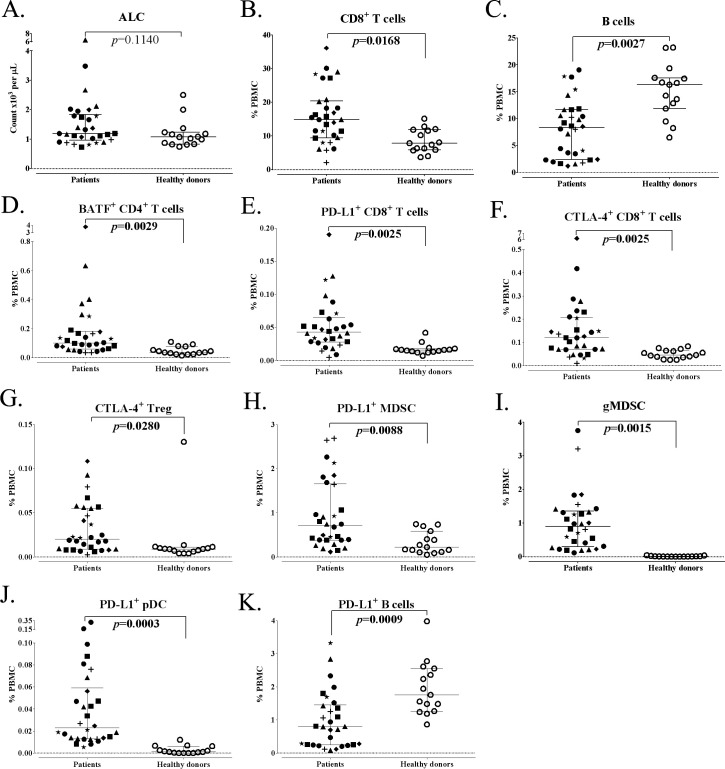
While vaccines directed against the SARS-CoV-2 spike protein will have varying degrees of effectiveness in preventing SARS-CoV-2 infections, the severity of infection will be determined by multiple host factors including the ability of immune cells to lyse virus-infected cells. This review will discuss the complexity of both adaptive and innate immunomes and how a flow-based assay can detect up to 158 distinct cell subsets in the periphery. This assay has been employed to show the effect of age on differences in specific immune cell subsets, and the differences in the immunome between healthy donors and age-matched cancer patients. Also reviewed are the numerous soluble factors, in addition to cytokines, that may vary in the pathogenesis of SARS-CoV-2 infections and may also be employed to help define the effectiveness of a given vaccine or other antiviral agents. Various steroids have been employed in the management of autoimmune adverse events in cancer patients receiving immunotherapeutics and may be employed in the management of SARS-CoV-2 infections. The influence of steroids on multiple immune cells subsets will also be discussed.

Keywords: COVID-19; T-lymphocytes; adaptive immunity; cellular; immunity; immunotherapy.


Conflict of interest statement

Competing interests: None declared.

Figures

Figure 1
Figure 1
Differences in standard parental immune cell types and refined subsets in healthy donors under and over the age of 40. (A) Healthy donors included in this analysis were separated as younger (age less than 40 years, n=11) and older (age greater than 40 years, n=15). (B, C) Standard parental immune cell types that were different between healthy donors under and over age 40. (D–I) Representative graphs are shown for notable refined subsets related to activation and maturation, with differences between healthy donors under and over the age of 40 indicated. Graphs display median frequency as a percentage of PBMCs with 25–75 percentiles. Differences were defined by an adjusted p<0.05, the median of groups showing a >50% difference, and a frequency above 0.01% of PBMCs. P value was calculated using the Mann-Whitney test and with Holm adjustment made for multiple comparisons using the number of standard immune cell types with a frequency above 0.01% of PBMCs (n=9). For refined subsets, Holm adjustment was made using the number of subsets within each standard subset with a frequency above 0.01% of PBMCs (n=29 for CD4+ T cells, 25 for CD8+ T cells, 5 for regulatory T cells (Tregs), 14 for NK cells, 3 for NKT cells, 4 for B cells, 2 for conventional dendritic cells (cDCs), 3 for plasmacytoid DCs (pDCs) and 15 for MDSCs). Figure adapted from Lepone. CTLA-4, cytotoxic T lymphocyte-associated protein-4; MDSCs, myeloid-derived suppressor cells; NK, natural killer; PBMCs, peripheral blood mononuclear cells; PD-L1, programmed cell death ligand-1.
Figure 2
Figure 2
The influence of age on the cellular immunome. Heatmap of age and standard and refined subsets that were different between healthy doors under and over the age of 40. Red: higher frequency, Blue: lower frequency. CTLA-4, cytotoxic T lymphocyte-associated protein-4; NK, natural killer; PD-L1, programmed cell death ligand-1.
Figure 3
Figure 3
Differences in standard parental immune cell types and refined subsets in age-matched advanced cancer patients and healthy donors. Patients with advanced cancer (n=30) and healthy donors (n=15) included in this analysis were age-matched above age 40. (A) ALC of cancer patients and healthy donors. (B, C) Standard parental immune cell types that were different between cancer patients and healthy donors. (D–K) Representative graphs are shown for notable refined subsets with differences between cancer patients and healthy donors. Graphs display median ALC or median frequency as a percentage of PBMCs with 25–75 percentiles. Cancer type is indicated by shape (square: GI (anal, colon, esophageal); n=6; triangle: pancreatic, n=6; star: breast, n=3; plus sign: mesothelioma, n=3; diamond: renal cell, n=3; closed circle: other (adrenocortical, chordoma, lung, medullary thyroid, neuroendocrine, ovarian, prostate, and spindle cell), n=9; open circle: healthy donors, n=15). Differences were defined by an adjusted p<0.05, the median of groups showing a >50% difference, and a frequency above 0.01% for PBMCs. P value was calculated using the Mann-Whitney test and with Holm adjustment made for multiple comparisons using the number of standard immune cell types with a frequency above 0.01% of PBMCs (n=9). For refined subsets, Holm adjustment was made using the number of subsets within each standard subset with a frequency above 0.01% for PBMCs (n=29 for CD4+ T cells, 25 for CD8+ T cells, 5 for Tregs, 14 for NK cells, 3 for NKT cells, 4 for B cells, 2 for cDCs, 3 for pDCs and 15 for MDSCs). Figure adapted from Lepone. ALC, absolute lymphocyte count; BATF, basic leucine zipper ATF-like transcription factor; cDC, conventional dendritic cells; CTLA-4, cytotoxic T lymphocyte-associated protein-4; GI, gastrointestinal; gMDSCs, granulocytic myeloid-derived suppressor cells; NK, natural killer; PBMCs, peripheral blood mononuclear cells; pDC, plasmacytoid DC; PD-L1, programmed cell death ligand-1; Tregs, regulatory T cells.
Figure 4
Figure 4
Change in standard parental immune cell types and refined subsets after corticosteroids. Cancer patients (n=11) enrolled in immunotherapy trials received moderate- to high-dose corticosteroids (prednisone, n=6; methylprednisolone and prednisone, (n=4); or dexamethasone, methylprednisolone, and prednisone, n=1) for the development of immune-related adverse events. (A–F) Changes in standard parental immune cell types after corticosteroids. (G–J) Representative graphs are shown for notable refined subsets that changed with corticosteroids. Significant changes were defined by a p value <0.05, a median difference poststeroid versus presteroids >0.05% of PBMCs, and at least half of evaluated patients having a >25% change. The panels used for refined subsets reflecting maturation/functional status of subsets were slightly different for the various immunotherapy trials, so certain subsets were not tested in all patients (n=6 for Treg CD38 and non-classical monocytes). MDSCs, myeloid-derived suppressor cells; PBMCs, peripheral blood mononuclear cells; Tregs, regulatory T cells.
Figure 5
Figure 5
The effect of steroids on peripheral immune subsets and TCR diversity in patients with thymoma and thymic epithelial carcinoma treated with avelumab and receiving corticosteroids for the treatment of developed immune-related adverse events. (A) An increase in MDSCs and decrease in Tregs was observed in clinical responders who developed autoimmune adverse events and were treated with corticosteroids. Dashed line denotes timing of steroids and solid line indicates time of clinical response. (B) TCR diversity (measured by the metric of repertoire size) was reduced after corticosteroids; values indicate the number of individual clonotypes comprising the top 25th percentile by ranked molecule count after sorting by abundance. The day (D) PBMCs were assessed for TCR diversity (with respect to avelumab treatment) before and after corticosteroids is indicated. The different colors are used to represent individual clonotypes. Figure adapted from Rajan. MDSCs, myeloid-derived suppressor cells; PBMCs, peripheral blood mononuclear cells; TCR, T-cell receptor; Tregs, regulatory T cells.

References

    1. Jiang S, Hillyer C, Du L. Neutralizing antibodies against SARS-CoV-2 and other human coronaviruses. Trends Immunol 2020;41:355–9. 10.1016/j.it.2020.03.007 - DOI - PMC - PubMed
    1. Walls AC, Park Y-J, Tortorici MA, et al. . Structure, function, and antigenicity of the SARS-CoV-2 spike glycoprotein. Cell 2020;181:281–92. 10.1016/j.cell.2020.02.058 - DOI - PMC - PubMed
    1. Grifoni A, Weiskopf D, Ramirez SI, et al. . Targets of T cell responses to SARS-CoV-2 coronavirus in humans with COVID-19 disease and unexposed individuals. Cell 2020;181:1489–501. e15. 10.1016/j.cell.2020.05.015 - DOI - PMC - PubMed
    1. Braun J, Loyal L, Frentsch M, et al. . SARS-CoV-2-reactive T cells in healthy donors and patients with COVID-19. Nature 2020;587:270–4. 10.1038/s41586-020-2598-9 - DOI - PubMed
    1. Weiskopf D, Schmitz KS, Raadsen MP, et al. . Phenotype and kinetics of SARS-CoV-2-specific T cells in COVID-19 patients with acute respiratory distress syndrome. Sci Immunol 2020;5. 10.1126/sciimmunol.abd2071. [Epub ahead of print: 26 06 2020]. - DOI - PMC - PubMed

MeSH terms