. 2021 Mar 11;12(1):1592.
doi: 10.1038/s41467-021-21669-4.

Metabolomics of sebum reveals lipid dysregulation in Parkinson's disease

Affiliations

Metabolomics of sebum reveals lipid dysregulation in Parkinson's disease

Eleanor Sinclair et al. Nat Commun. .

Abstract

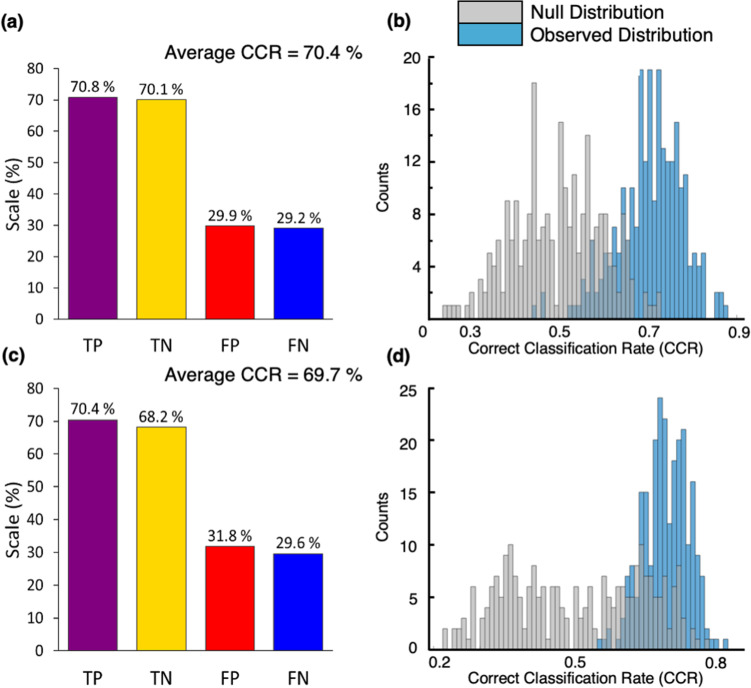
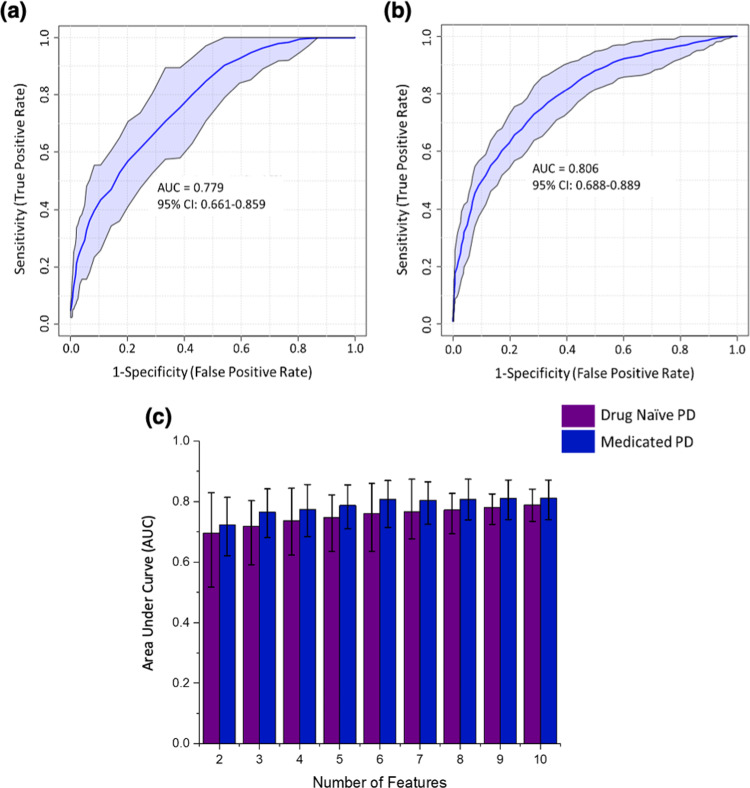
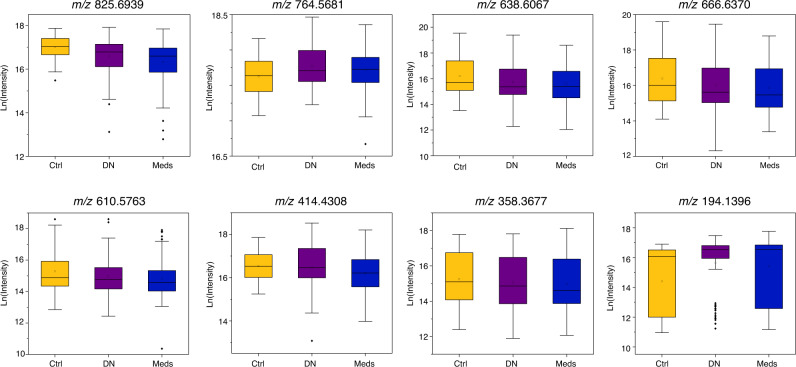
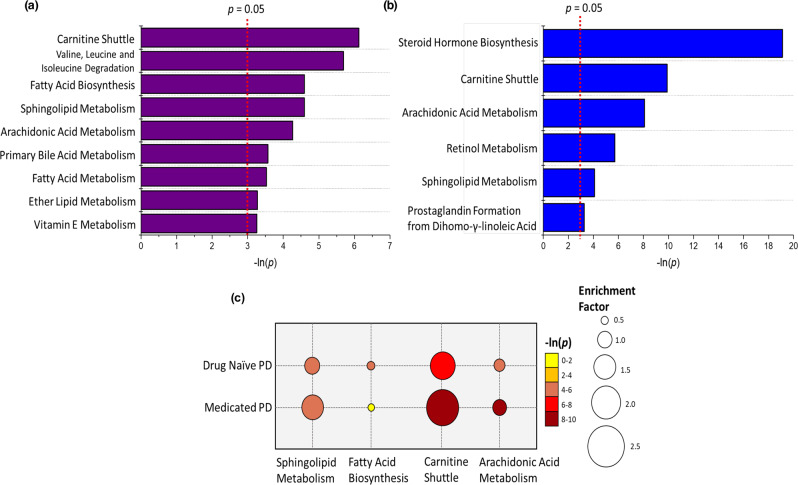
Parkinson's disease (PD) is a progressive neurodegenerative disorder, which is characterised by degeneration of distinct neuronal populations, including dopaminergic neurons of the substantia nigra. Here, we use a metabolomics profiling approach to identify changes to lipids in PD observed in sebum, a non-invasively available biofluid. We used liquid chromatography-mass spectrometry (LC-MS) to analyse 274 samples from participants (80 drug naïve PD, 138 medicated PD and 56 well matched control subjects) and detected metabolites that could predict PD phenotype. Pathway enrichment analysis shows alterations in lipid metabolism related to the carnitine shuttle, sphingolipid metabolism, arachidonic acid metabolism and fatty acid biosynthesis. This study shows sebum can be used to identify potential biomarkers for PD.


Conflict of interest statement

The authors declare no competing interests.

Figures

Fig. 1
Fig. 1. PLS-DA classification models for (a, b) drug naïve PD vs. control and (c, d) medicated PD vs. control.
a, c Classification rates for each model including true positive (TP, sensitivity), true negative (TN, specificity), false positive (FP), and false negative (FN). b, d Null distribution (grey bars) and observed distribution (blue bars) for each PLS-DA bootstrap model. The correct classification rate (CCR) were calculated from the test sets only (= 250 from the bootstraps).
Fig. 2
Fig. 2. ROC curve analyses based on a multivariate PLS-DA algorithm with a two latent variable input, AUC and 95% confidence intervals (CI) were calculated by Monte Carlo cross validation (MCCV) using balanced subsampling with multiple repeats.
a ROC curve analysis (n = 15 independent metabolite features) in drug naïve PD vs. control PLS-DA with VIP > 1. b ROC curve analysis (n = 26 independent metabolite features) in medicated PD vs. control PLS-DA with VIP > 1. c A bar chart displaying the comparison of AUCs for drug naïve PD (purple) and medicated PD (blue) using common VIPs between models (n = 10 independent metabolite features), data are presented as mean AUC value with error bars representing the minima and maxima values of the 95% CI range.
Fig. 3
Fig. 3. Box whisker plots for each of the eight putatively annotated compounds for control (Ctrl, yellow) (n = 56 biologically independent samples), drug naïve PD (DN, purple) (n = 80 biologically independent samples) and medicated PD (Meds, blue) cohorts (n = 138 biologically independent samples).
Box plots display mean (square), median (line within box) and quartiles (box limits), range (whiskers) and outliers (diamond). The y-axis of each plot corresponds to the natural log of intensity values and the measured m/z value for each compound is labelled above the plot, these species correlate to the data presented in Table 2A, B.
Fig. 4
Fig. 4. Results of mummichog analysis for significant pathways (p < 0.05).
Bar charts report pathways for (a) drug naïve PD vs. control and (b) medicated PD vs. control. c A bubble chart displaying the common significant pathways between drug naïve PD and medicated PD compared against controls; the bubble size refers to the enrichment factor of the pathway and the colour represents the natural log of the pathway p-value.

References

    1. Ray Dorsey E, et al. Global, regional, and national burden of Parkinson’s disease, 1990–2016: a systematic analysis for the Global Burden of Disease Study 2016. Lancet Neurol. 2018;17:939–953. doi: 10.1016/S1474-4422(18)30295-3. - DOI - PMC - PubMed
    1. Dauer W, Przedborski S. Parkinson’s disease: mechanisms and models. Neuron. 2003;39:889–909. doi: 10.1016/S0896-6273(03)00568-3. - DOI - PubMed
    1. Kalia LV, Lang AE. Parkinson’s disease. Lancet. 2015;386:896–912. doi: 10.1016/S0140-6736(14)61393-3. - DOI - PubMed
    1. Obeso JA. Past, present, and future of Parkinson’s disease. Mov. Disord. 2017;32:1263–1263. doi: 10.1002/mds.27113. - DOI - PubMed
    1. Marsili L, Rizzo G, Colosimo C. Diagnostic criteria for Parkinson’s disease: from James Parkinson to the concept of prodromal disease. Front. Neurol. 2018;9:1–10. doi: 10.3389/fneur.2018.00156. - DOI - PMC - PubMed

Publication types