. 2021 Mar 11;12(1):1609.
doi: 10.1038/s41467-021-21727-x.

Joint analysis of expression levels and histological images identifies genes associated with tissue morphology

Affiliations

Joint analysis of expression levels and histological images identifies genes associated with tissue morphology

Jordan T Ash et al. Nat Commun. .

Abstract

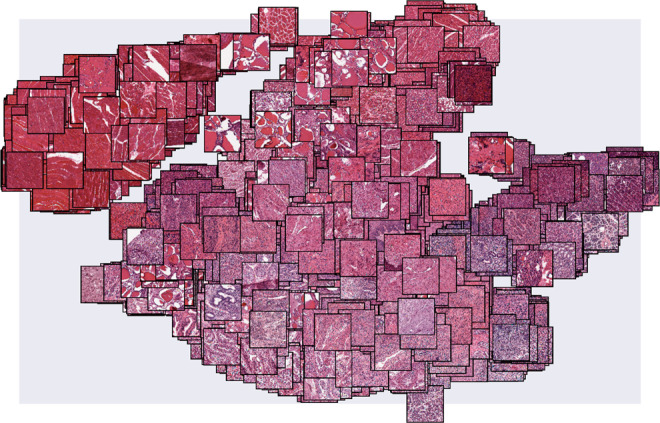
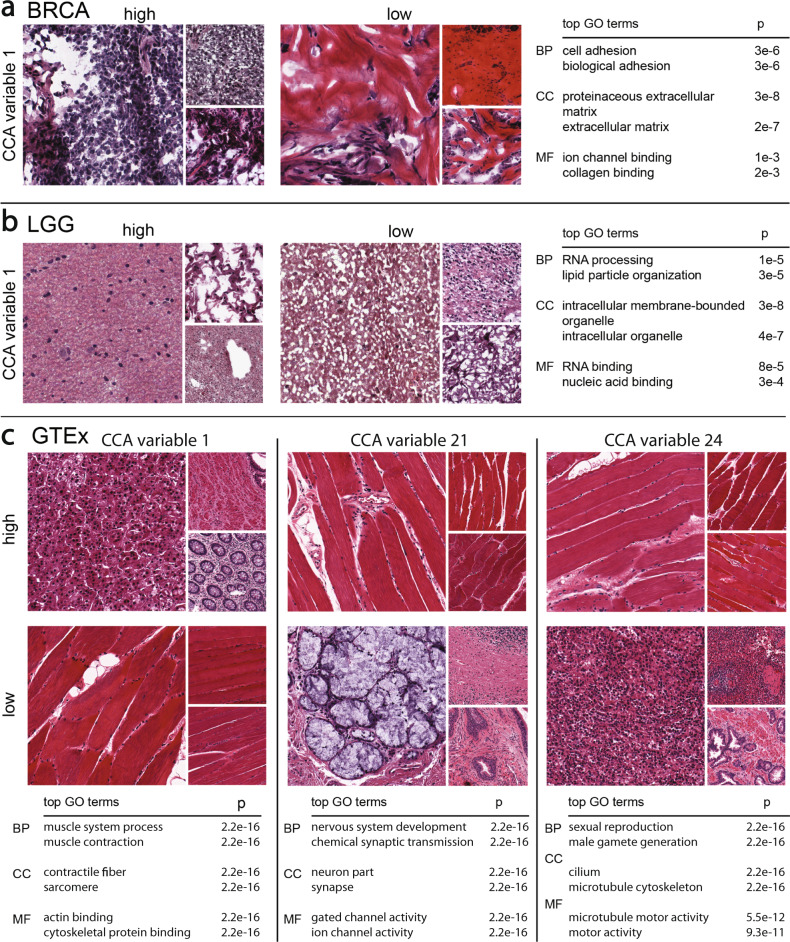
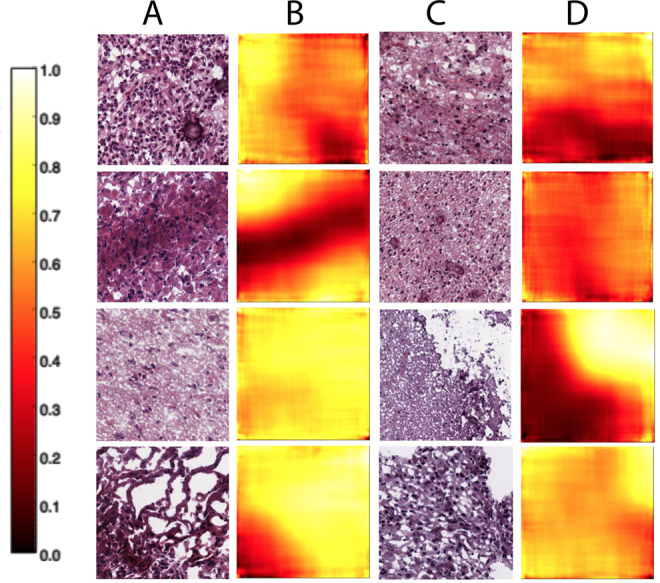
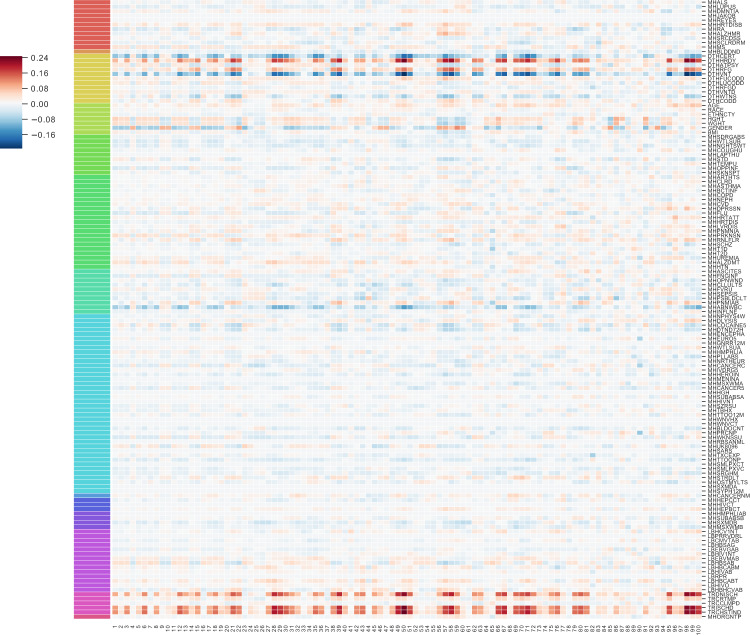
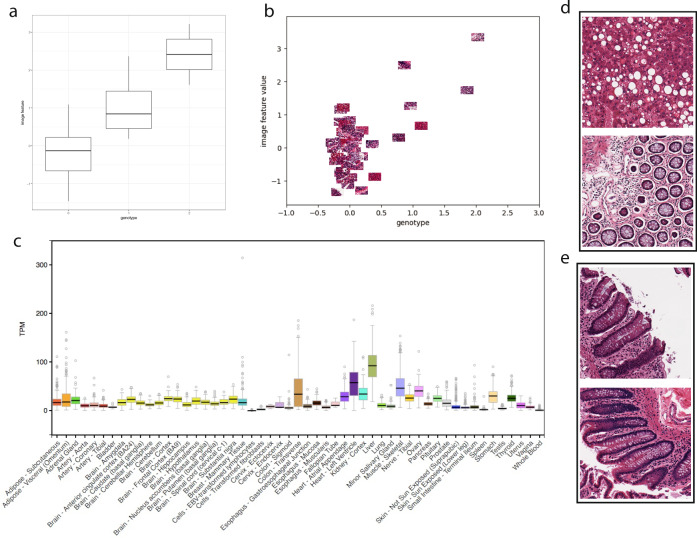
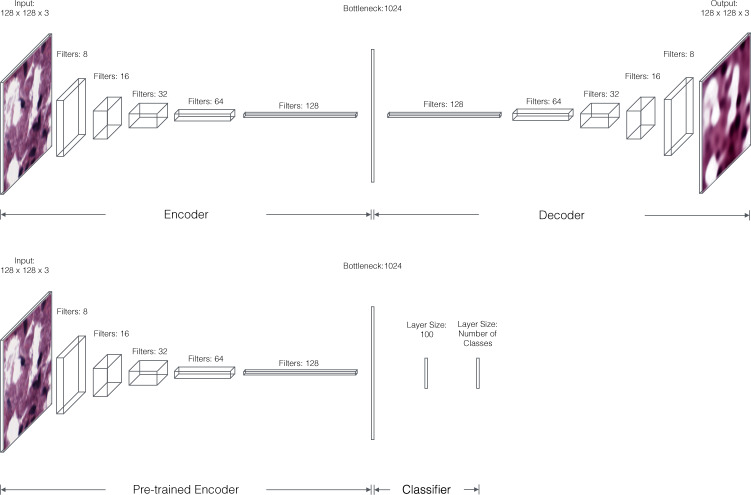
Histopathological images are used to characterize complex phenotypes such as tumor stage. Our goal is to associate features of stained tissue images with high-dimensional genomic markers. We use convolutional autoencoders and sparse canonical correlation analysis (CCA) on paired histological images and bulk gene expression to identify subsets of genes whose expression levels in a tissue sample correlate with subsets of morphological features from the corresponding sample image. We apply our approach, ImageCCA, to two TCGA data sets, and find gene sets associated with the structure of the extracellular matrix and cell wall infrastructure, implicating uncharacterized genes in extracellular processes. We find sets of genes associated with specific cell types, including neuronal cells and cells of the immune system. We apply ImageCCA to the GTEx v6 data, and find image features that capture population variation in thyroid and in colon tissues associated with genetic variants (image morphology QTLs, or imQTLs), suggesting that genetic variation regulates population variation in tissue morphological traits.


Conflict of interest statement

B.E.E. is on the SAB of Freenome, Celsius Therapeutics, and Creyon Bio, and is a consultant for Genomics plc and Freenome. The remaining authors have no competing interests to declare.

Figures

Fig. 1
Fig. 1. The embeddings of GTEx histological images.
The image feature representation estimated by ImageCCA for each of the GTEx histological images may be visualized by embedding the images based on their feature values into two dimensions using t-SNE. We plot each histological image in this two-dimensional space. Images with similar morphological features are closer together, with skeletal muscle tissues forming a noticeably distinct cluster from the remaining tissue types in the upper left corner.
Fig. 2
Fig. 2. Results using ImageCCA for three different data sets.
We report images sampled from those with the most extreme magnitude positive and negative (10% and 90% in a linear ranking) CCA variable values, and top two GO terms that are most enriched with the corresponding genes with extreme loading values in the same component. BP biological process, CC cellular component, MF molecular function. The p-values reported are uncorrected Fisher’s exact tests. Panel a: the first component of the BRCA ImageCCA results; Panel b: the first component of the LGG ImageCCA results; Panel c: three components of the GTEx ImageCCA results.
Fig. 3
Fig. 3. Classifying primary versus recurrent tumor locations in LGG histopathological images.
For each overlapping 128 × 128 patch in a 1000 × 1000 pixel image, we classify the likelihood that the patch contains recurrent tumor cells. We used these predictions to create a heatmap of primary tumor (values closer to zero) versus recurrent tumor (values closer to one) locations in the image. Columns A and C are LGG histopathological images; columns B and D are the corresponding heatmaps showing the locations in the images classified as higher likelihood of primary tumor (darker colors) versus higher likelihood of recurrent tumor (lighter colors).
Fig. 4
Fig. 4. Pearson’s correlation of 100 components of GTEx CCA with GTEx covariates.
The 100 GTEx CCA components are ordered on the x-axis; 138 available GTEx covariates are on the y-axis. The legend on the left refers to the Pearson’s correlation between each component and the GTEx covariates. Some of the CCA components were sign-flipped so that the Pearson’s correlation with covariate Chest Incision Time was non-negative without loss of generality. The colors correspond to covariates in one of the following categories: Autoimmune, Degenerative, Neurological (red), Blood Donation (orange), Death Circumstances (yellow), Demography (yellow green), Evidence of HIV (light green), General Medical History (green), History at Time of Death (sea green), Information (light blue), Medical History (blue), Potential Exposure: Physical Contact (royal blue), Potential Exposure: Sexual Activity (purple), Serology Results (fuchsia), Tissue Recovery (pink), and Tissue Transplant (pink red).
Fig. 5
Fig. 5. Genotype and image feature association for an eQTL targeting lactate dehydrogenase D (LDHD) in colon samples.
a Boxplot of association between genotype rs8059637 (x-axis) and image feature 799 values for all samples (y-axis), the box hinges are the first quartile, the median, and third quartile of the image feature values, respectively, the lower whisker ranges from the bottom hinge to no less than 1.5*IQR (inter-quartile range), the upper whisker ranges from the top hinge to no more than 1.5*IQR; b same axes as (a), but points are the colon images with jitter added to separate the images; c relative abundance of LDHD expression across GTEx tissues, with colon—traverse showing substantial expression levels, boxplot defined the same as (a) with outlier points defined as greater than or less than the whisker range; d images in the top 10% of values for image feature 799; e images in the bottom 10% of values for image feature 799.
Fig. 6
Fig. 6. Architecture of the CAE.
Each convolutional layer of the encoder includes 5 × 5 filters followed by 2 × 2 max pooling and rectified linear (ReLU) activations. The final convolutional layer of the encoder is fully connected to a layer of 1024 units to produce our embedding. Each convolutional layer in the decoder is upsampled 2× before again applying ReLU nonlinearities. The first convolutional layer of the decoder is linearly projected and reshaped from the bottleneck layer. Bottom: Architecture of the CAE including a multilayer perceptron. The pre-trained encoder is attached to two fully connected layers to allow label classification. The first classification layer features 128 ReLU units, and the second has as many neurons as there are classes with softmax activation (for multi-class problems) or a single sigmoid unit (for binary classification problems).

References

    1. Fitzgibbons PL, et al. Prognostic factors in breast cancer: College of American Pathologists Consensus statement 1999. Arch. Pathol. Lab. Med. 2000;124:966–978. doi: 10.5858/2000-124-0966-PFIBC. - DOI - PubMed
    1. Demir, C. & Yener, B. Automated Cancer Diagnosis Based on Histopathological Images: A Systematic Survey. Technical Report (Rensselaer Polytechnic Institute, 2005).
    1. Mousavi HS, Monga V, Rao G, Rao AU, et al. Automated discrimination of lower and higher grade gliomas based on histopathological image analysis. J. Pathol. Inform. 2015;6:15. doi: 10.4103/2153-3539.153914. - DOI - PMC - PubMed
    1. Beck AH, et al. Systematic analysis of breast cancer morphology uncovers stromal features associated with survival. Sci. Transl. Med. 2011;3:108–113. doi: 10.1126/scitranslmed.3002564. - DOI - PubMed
    1. Veta M, Pluim JP, Van Diest PJ, Viergever MA. Breast cancer histopathology image analysis: a review. IEEE Trans. Biomed. Eng. 2014;61:1400–1411. doi: 10.1109/TBME.2014.2303852. - DOI - PubMed

Publication types

MeSH terms