

Determining the level of social distancing necessary to avoid future COVID-19 epidemic waves: a modelling study for North East London
- PMID: 33707546
- PMCID: PMC7952900
- DOI: 10.1038/s41598-021-84907-1
Determining the level of social distancing necessary to avoid future COVID-19 epidemic waves: a modelling study for North East London
Abstract
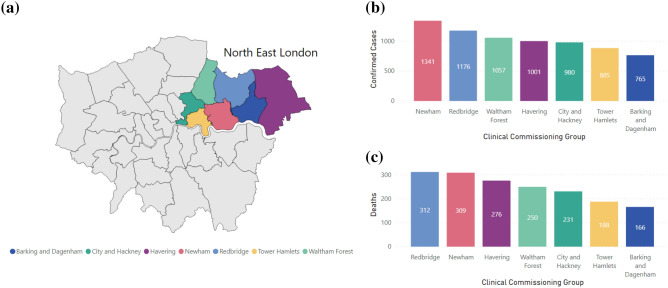
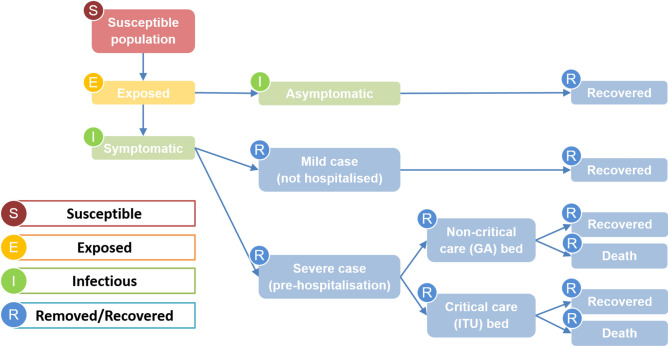
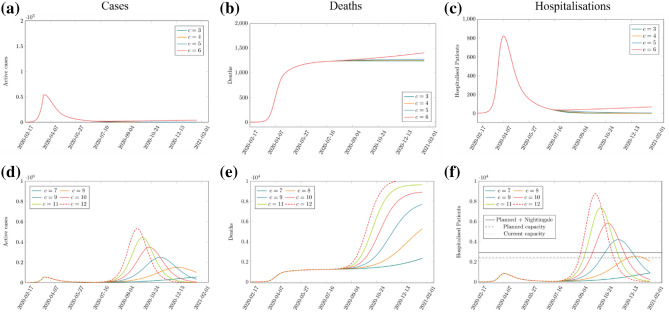
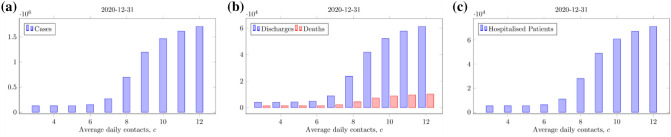
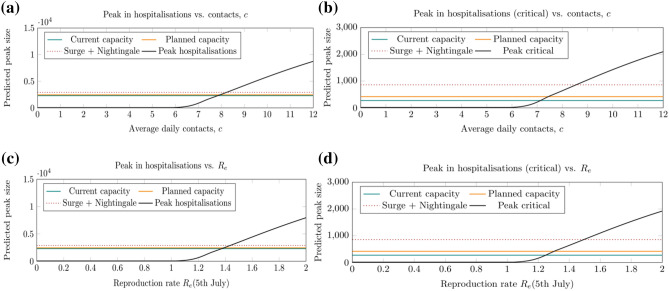
Determining the level of social distancing, quantified here as the reduction in daily number of social contacts per person, i.e. the daily contact rate, needed to maintain control of the COVID-19 epidemic and not exceed acute bed capacity in case of future epidemic waves, is important for future planning of relaxing of strict social distancing measures. This work uses mathematical modelling to simulate the levels of COVID-19 in North East London (NEL) and inform the level of social distancing necessary to protect the public and the healthcare demand from future COVID-19 waves. We used a Susceptible-Exposed-Infected-Removed (SEIR) model describing the transmission of SARS-CoV-2 in NEL, calibrated to data on hospitalised patients with confirmed COVID-19, hospital discharges and in-hospital deaths in NEL during the first epidemic wave. To account for the uncertainty in both the infectiousness period and the proportion of symptomatic infection, we simulated nine scenarios for different combinations of infectiousness period (1, 3 and 5 days) and proportion of symptomatic infection (70%, 50% and 25% of all infections). Across all scenarios, the calibrated model was used to assess the risk of occurrence and predict the strength and timing of a second COVID-19 wave under varying levels of daily contact rate from July 04, 2020. Specifically, the daily contact rate required to suppress the epidemic and prevent a resurgence of COVID-19 cases, and the daily contact rate required to stay within the acute bed capacity of the NEL system without any additional intervention measures after July 2020, were determined across the nine different scenarios. Our results caution against a full relaxing of the lockdown later in 2020, predicting that a return to pre-COVID-19 levels of social contact from July 04, 2020, would induce a second wave up to eight times the original wave. With different levels of ongoing social distancing, future resurgence can be avoided, or the strength of the resurgence can be mitigated. Keeping the daily contact rate lower than 5 or 6, depending on scenarios, can prevent an increase in the number of COVID-19 cases, could keep the effective reproduction number Re below 1 and a secondary COVID-19 wave may be avoided in NEL. A daily contact rate between 6 and 7, across scenarios, is likely to increase Re above 1 and result in a secondary COVID-19 wave with significantly increased COVID-19 cases and associated deaths, but with demand for hospital-based care remaining within the bed capacity of the NEL health and care system. In contrast, an increase in daily contact rate above 8 to 9, depending on scenarios, will likely exceed the acute bed capacity in NEL and may potentially require additional lockdowns. This scenario is associated with significantly increased COVID-19 cases and deaths, and acute COVID-19 care demand is likely to require significant scaling down of the usual operation of the health and care system and should be avoided. Our findings suggest that to avoid future COVID-19 waves and to stay within the acute bed capacity of the NEL health and care system, maintaining social distancing in NEL is advised with a view to limiting the average number of social interactions in the population. Increasing the level of social interaction beyond the limits described in this work could result in future COVID-19 waves that will likely exceed the acute bed capacity in the system, and depending on the strength of the resurgence may require additional lockdown measures.
Conflict of interest statement
The authors declare no competing interests.
Figures
References
-
- World Health Organisation. COVID-19 situation report 170. https://www.who.int/docs/default-source/coronaviruse/situation-reports/2... (2020).
-
- Public Health England. COVID-19 UK data. https://coronavirus.data.gov.uk (2020).
-
- Office for National Statistics. Subnational population projections for England: 2018-based. https://www.ons.gov.uk/peoplepopulationandcommunity/populationandmigrati... (2020).
-
- Office for National Statistics. Deaths involving COVID-19 by local area and socioeconomic deprivation: deaths occurring between 1 March and 17 April 2020. https://www.ons.gov.uk/peoplepopulationandcommunity/birthsdeathsandmarri... (2020).
Publication types
MeSH terms
LinkOut - more resources
Full Text Sources
Other Literature Sources
Medical
Miscellaneous
