. 2021 Mar 11;11(1):5794.
doi: 10.1038/s41598-021-85174-w.

Enteric reabsorption processes and their impact on drug pharmacokinetics

Affiliations

Enteric reabsorption processes and their impact on drug pharmacokinetics

Manuel Ibarra et al. Sci Rep. .

Abstract

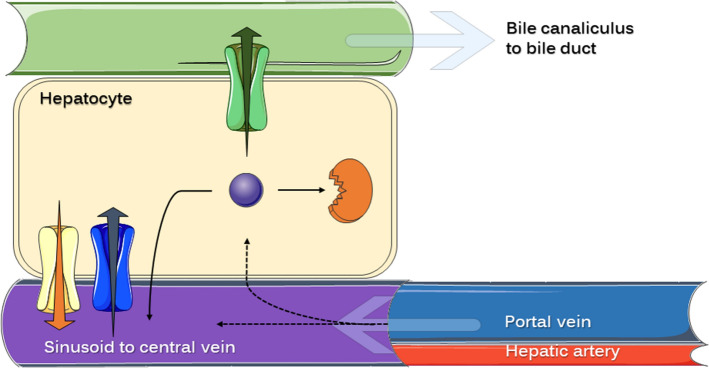
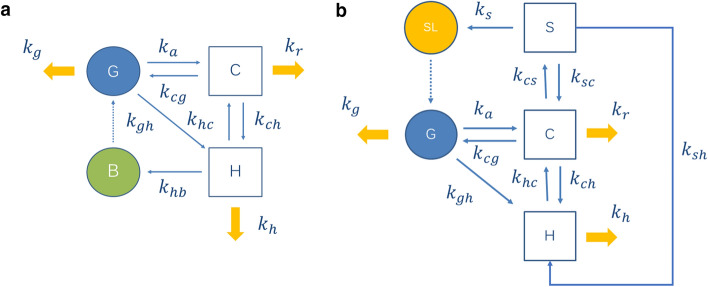
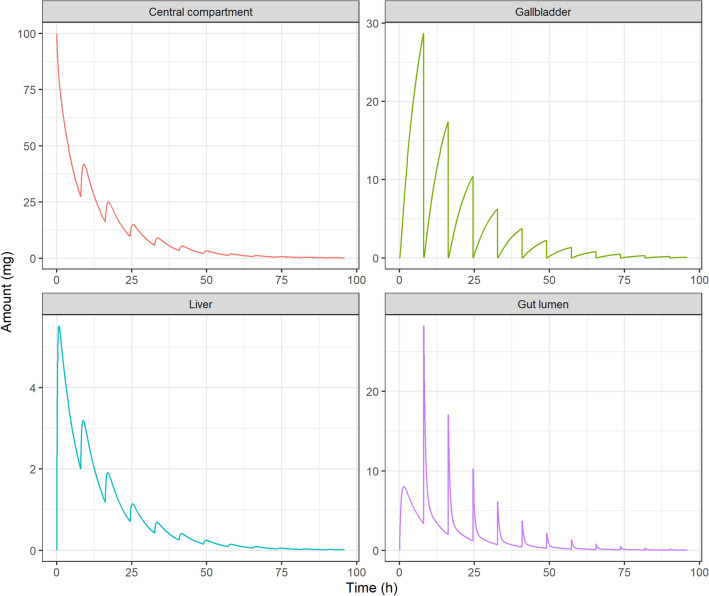
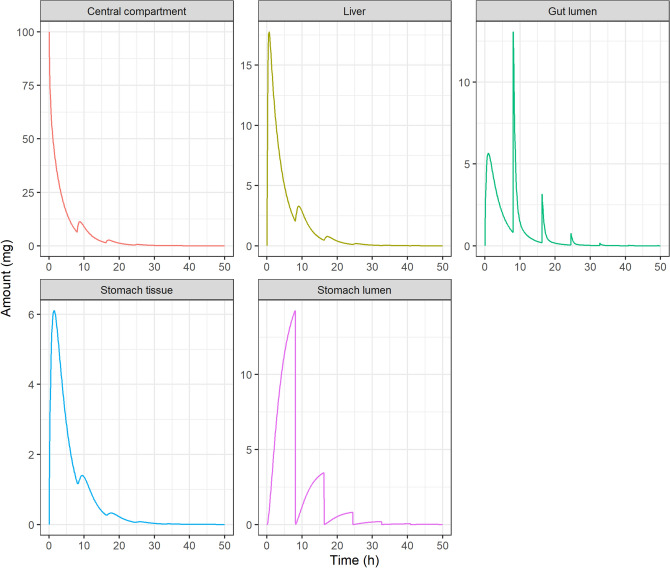
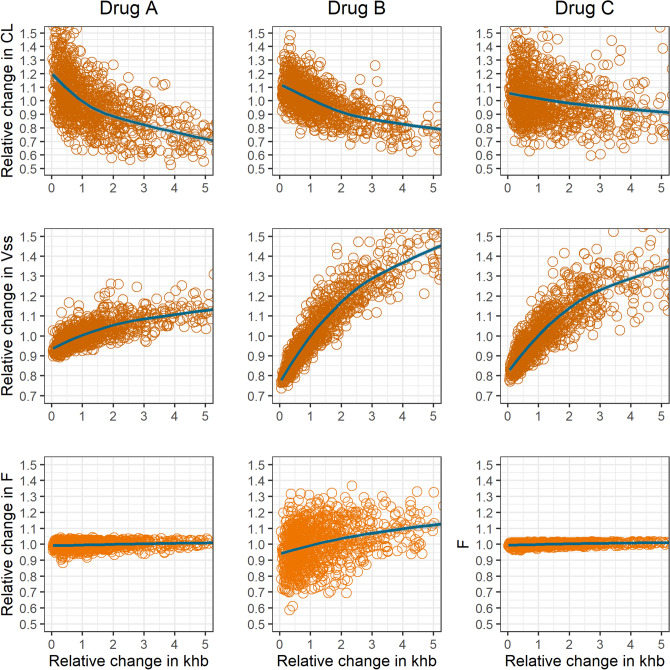
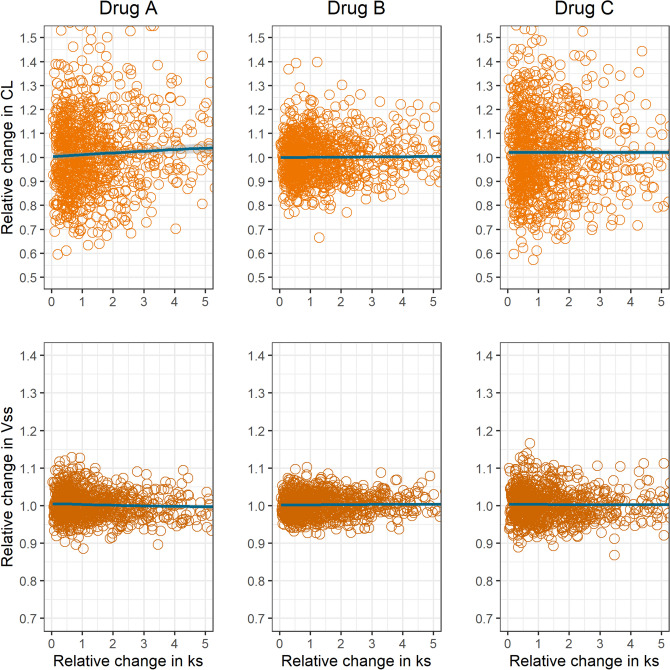
Enteric reabsorption occurs when a drug is secreted into the intestinal lumen and reabsorbed into the systemic circulation. This distribution process is evidenced by multiple peaks in pharmacokinetic profiles. Commonly, hepatobiliary drug secretion is assumed to be the underlying mechanism (enterohepatic reabsorption, EHR), neglecting other possible mechanisms such as gastric secretion (enterogastric reabsorption, EGR). In addition, the impact of drug reabsorption on systemic clearance, volume of distribution and bioavailability has been a subject of long-standing discussions. In this work, we propose semi-mechanistic pharmacokinetic models to reflect EHR and EGR and compare their respective impact on primary pharmacokinetic parameters. A simulation-based analysis was carried out considering three drug types with the potential for reabsorption, classified according to their primary route of elimination and their hepatic extraction: (A) hepatic metabolism-low extraction; (B) hepatic metabolism-intermediate/high extraction; (C) renal excretion. Results show that an increase in EHR can significantly reduce the clearance of drugs A and B, increase bioavailability of B drugs, and increase the volume of distribution for all drugs. Conversely, EGR had negligible impact in all pharmacokinetic parameters. Findings provide background to explain and forecast the role that this process can play in pharmacokinetic variability, including drug-drug interactions and disease states.


Conflict of interest statement

The authors declare no competing interests.

Figures

Figure 1
Figure 1
Schematic representation of the different routes that a drug can follow during its passage through the liver. The hepatocyte environment is shown, emphasizing the presence of drug transporters (influx and efflux) at the different membranes and the spatial relation with blood and bile circulation. Either arriving from the portal vein or the hepatic artery, drug circulating in liver sinusoids can be active or passively transferred into the hepatocyte or keep circulating towards the central vein (systemic circulation). Black dashed arrows represent these transferences. Intracellular drug (violet sphere) will be suffer one of these processes: hepatobiliary secretion (active efflux represented by green transporters), enzyme-mediated biotransformation (orange structure representing intracellular metabolic enzyme) or transference back into sinusoidal blood (active or passive). Yellow structures with orange arrow represent efflux transporters at the basolateral membrane (such as MRP3 and MRP4), while blue structures with blue arrow represent influx transporters (such as OATP). Bile canaliculus convey in the bile duct delivering the fluid into the gallbladder. This figure was prepared using content from Servier Medical Art, licensed under a Creative Common Attribution 3.0 Generic License. http://smart.servier.com/.
Figure 2
Figure 2
Pharmacokinetic model implemented in the analysis of (a) enterohepatic reabsorption (EHR), and (b) enterogastric reabsorption (EGR). Compartments: central compartment (C), gut (G), hepatocytes (H), gallbladder (B), stomach lumen (SL) and gastric parietal cells (S). First-order rate constants describing mass transferences: ka (drug absorption from the gut into the central compartment),kgh(hepatic uptake of drug coming from the gut through portal venous blood), kg (intestinal elimination), kcg(drug transference from the systemic circulation to the gut), khc (drug transference from the hepatocyte to the central compartment), kch (drug transference from the central compartment to the hepatocyte),kh (hepatic elimination), khb (hepatobiliary secretion), kcs (drug transference from the central compartment to the parietal cells), ksc (drug transference from the parietal cells to the central compartment), ks (drug secretion from parietal cells into gastric lumen) ksh (hepatic uptake of drug coming from the parietal cells through the gastric vein), and kr (renal elimination).
Figure 3
Figure 3
Pharmacokinetic profiles simulated for an intravenous administration of 100 mg, drug A, in the EHR model. Drug amounts in the central compartment (AC), gallbladder (AB), liver (AH) and gut lumen (AG) are plotted versus time after dose. The multiple-peaking nature of the profiles corresponds to discrete gallbladder emptying events taking place every 8 h after meal intake and followed by drug reabsorption into the central compartment.
Figure 4
Figure 4
Pharmacokinetic profiles simulated for an intravenous administration of 100 mg, drug A, in the EGR model. Drug amounts in the central compartment (AC), stomach tissue (AS), liver (AH), gut lumen (AG) and stomach lumen (ASL) are plotted versus time after dose. The multiple-peaking nature of the profiles corresponds to discrete gastric emptying events taking place every 8 h after with meal intake and followed by drug reabsorption into the central compartment.
Figure 5
Figure 5
Sensitivity analysis with variability in all first-order rate constants, shown as scatterplots, for the mean impact of drug hepatobiliary secretion first-order rate constant (khb) on systemic clearance (CL), volume of distribution at steady state (Vss) and oral bioavailability (F).
Figure 6
Figure 6
Sensitivity analysis with variability in all first-order rate constants, shown as scatterplots, for the mean impact of drug gastric secretion first-order rate constant (ks) on systemic clearance (CL) and volume of distribution at steady state (Vss).
Figure 7
Figure 7
Plasma drug concentration (left) and AUC (right) versus time plotted for a type A drug changing the magnitude of hepatobiliary secretion first-order rate constant (khb). Ehb corresponds to the hepatobiliary extraction defined as Ehb=khb/khc+khb+kh.

Similar articles

Cited by

References

    1. Davies NM, Takemoto JK, Brocks DR, Yáñez JA. Multiple peaking phenomena in pharmacokinetic disposition. Clin. Pharmacokinet. 2010;49:351–377. doi: 10.2165/11319320-000000000-00000. - DOI - PubMed
    1. Gao Y, et al. Drug enterohepatic circulation and disposition: constituents of systems pharmacokinetics. Drug Discov. Today. 2014;19:326–340. doi: 10.1016/j.drudis.2013.11.020. - DOI - PubMed
    1. Roberts MS, Magnusson BM, Burczynski FJ, Weiss M. Enterohepatic circulation: physiological, pharmacokinetic and clinical implications. Clin. Pharmacokinet. 2002;41:751–790. doi: 10.2165/00003088-200241100-00005. - DOI - PubMed
    1. Okour M, Brundage RC. Modeling enterohepatic circulation. Curr. Pharmacol. Rep. 2017 doi: 10.1007/s40495-017-0096-z. - DOI
    1. Veng-Pedersen P, Miller R. Pharmacokinetics and bioavailability of cimetidine in humans. J. Pharm. Sci. 1980;69:394–398. doi: 10.1002/jps.2600690408. - DOI - PubMed

MeSH terms

Substances