. 2021 Mar;27(3):471-479.
doi: 10.1038/s41591-021-01266-0. Epub 2021 Mar 11.

Plasma metabolites to profile pathways in noncommunicable disease multimorbidity

Affiliations

Plasma metabolites to profile pathways in noncommunicable disease multimorbidity

Maik Pietzner et al. Nat Med. 2021 Mar.

Abstract

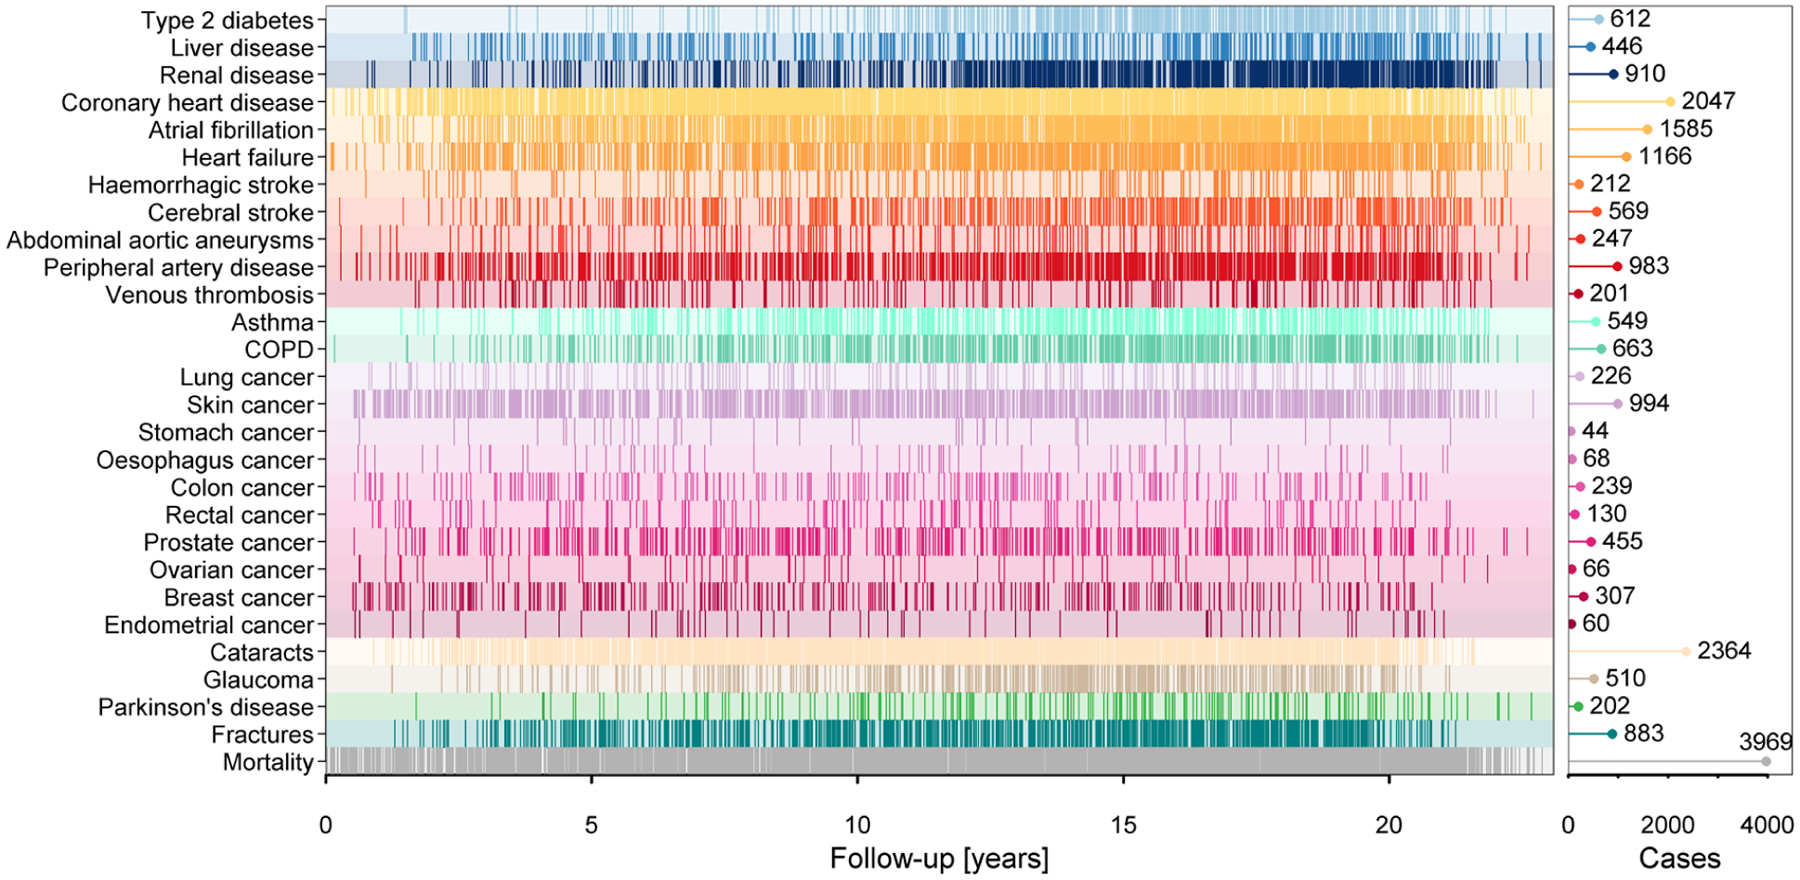
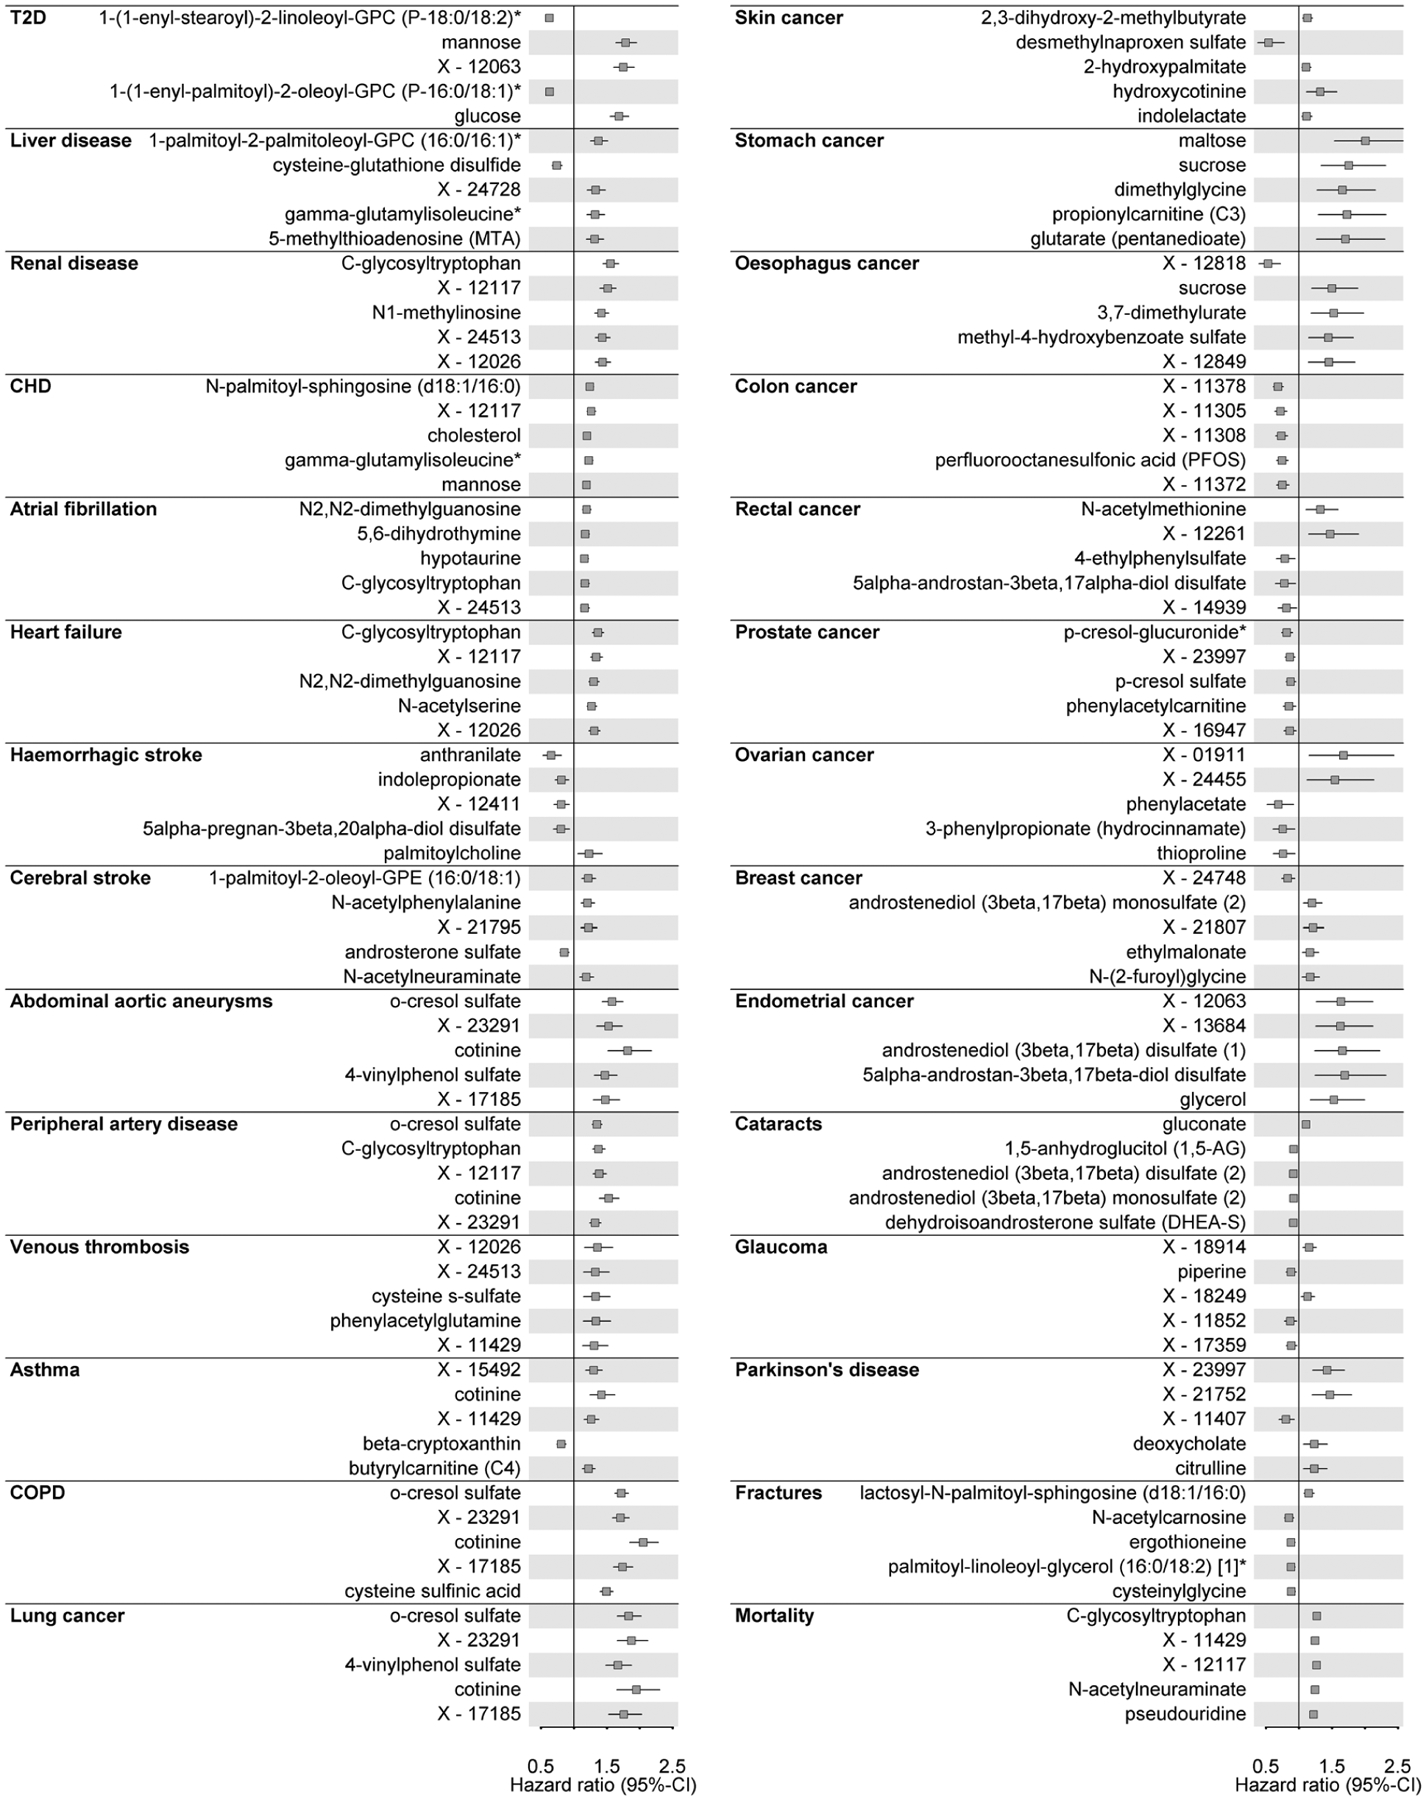
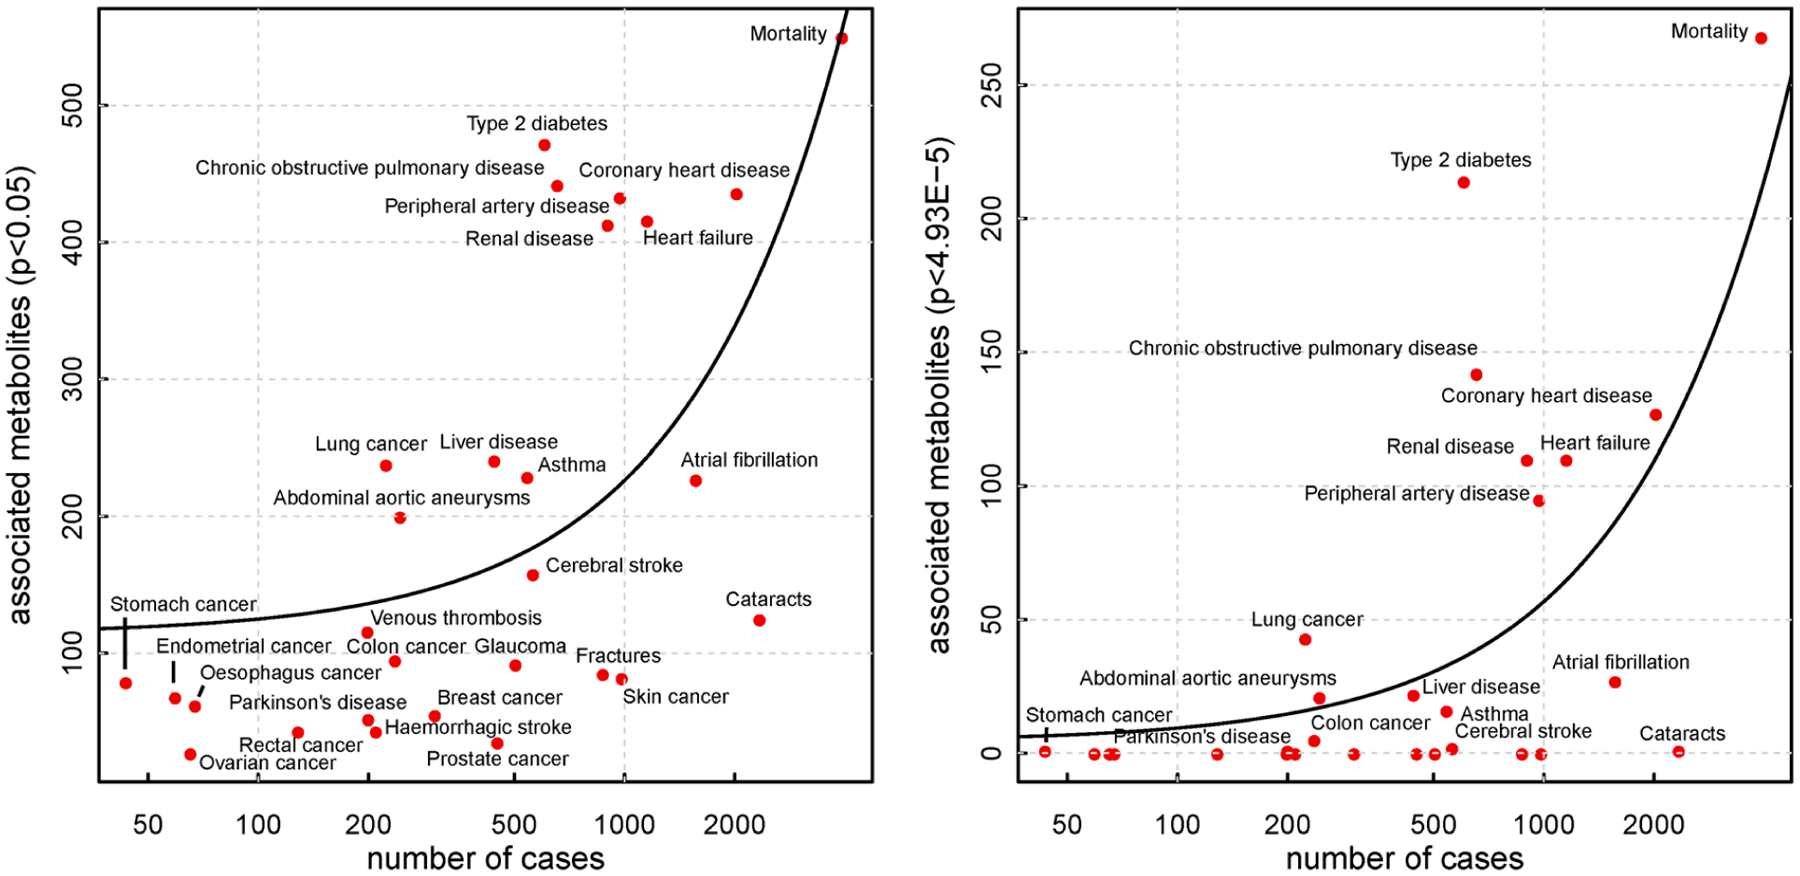
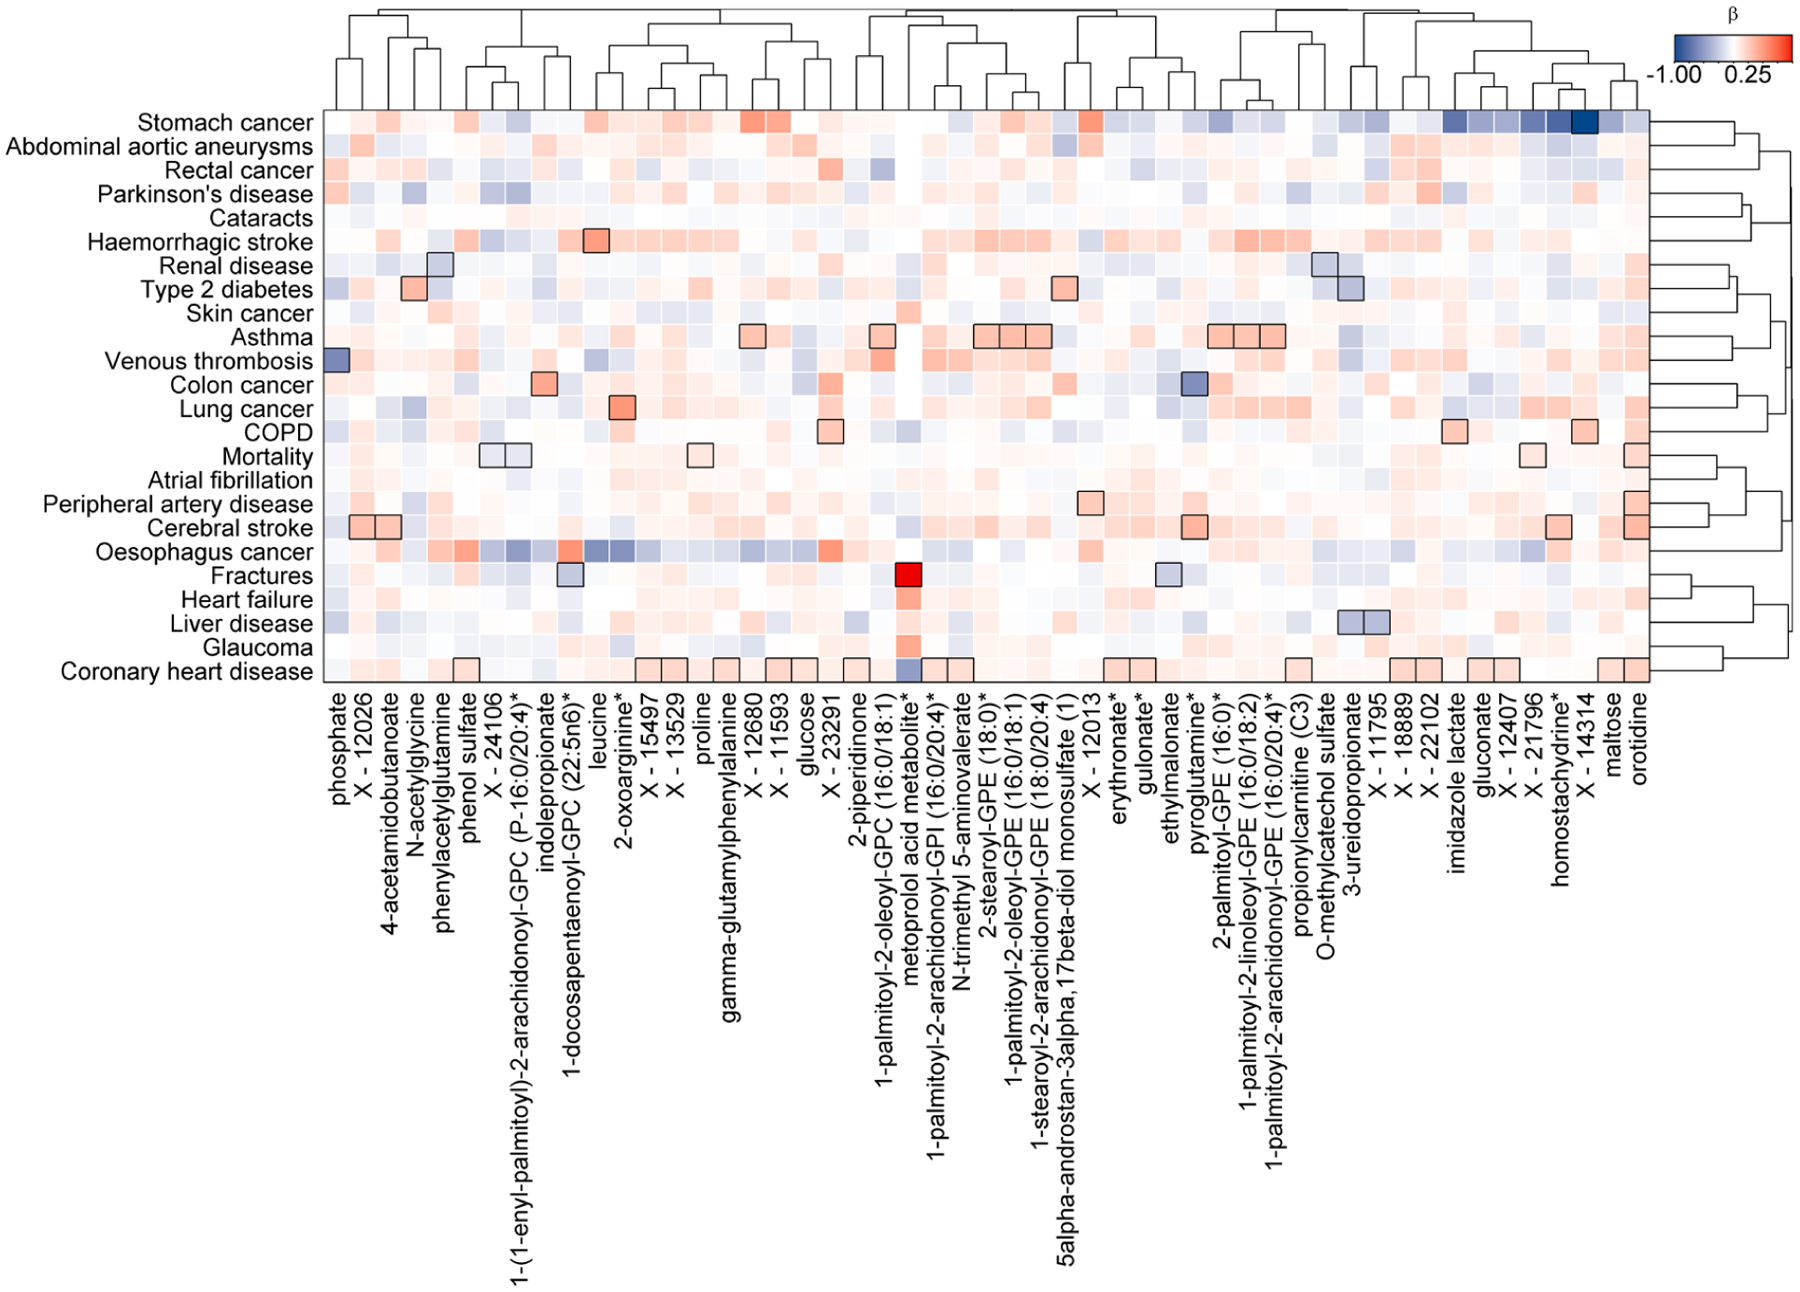
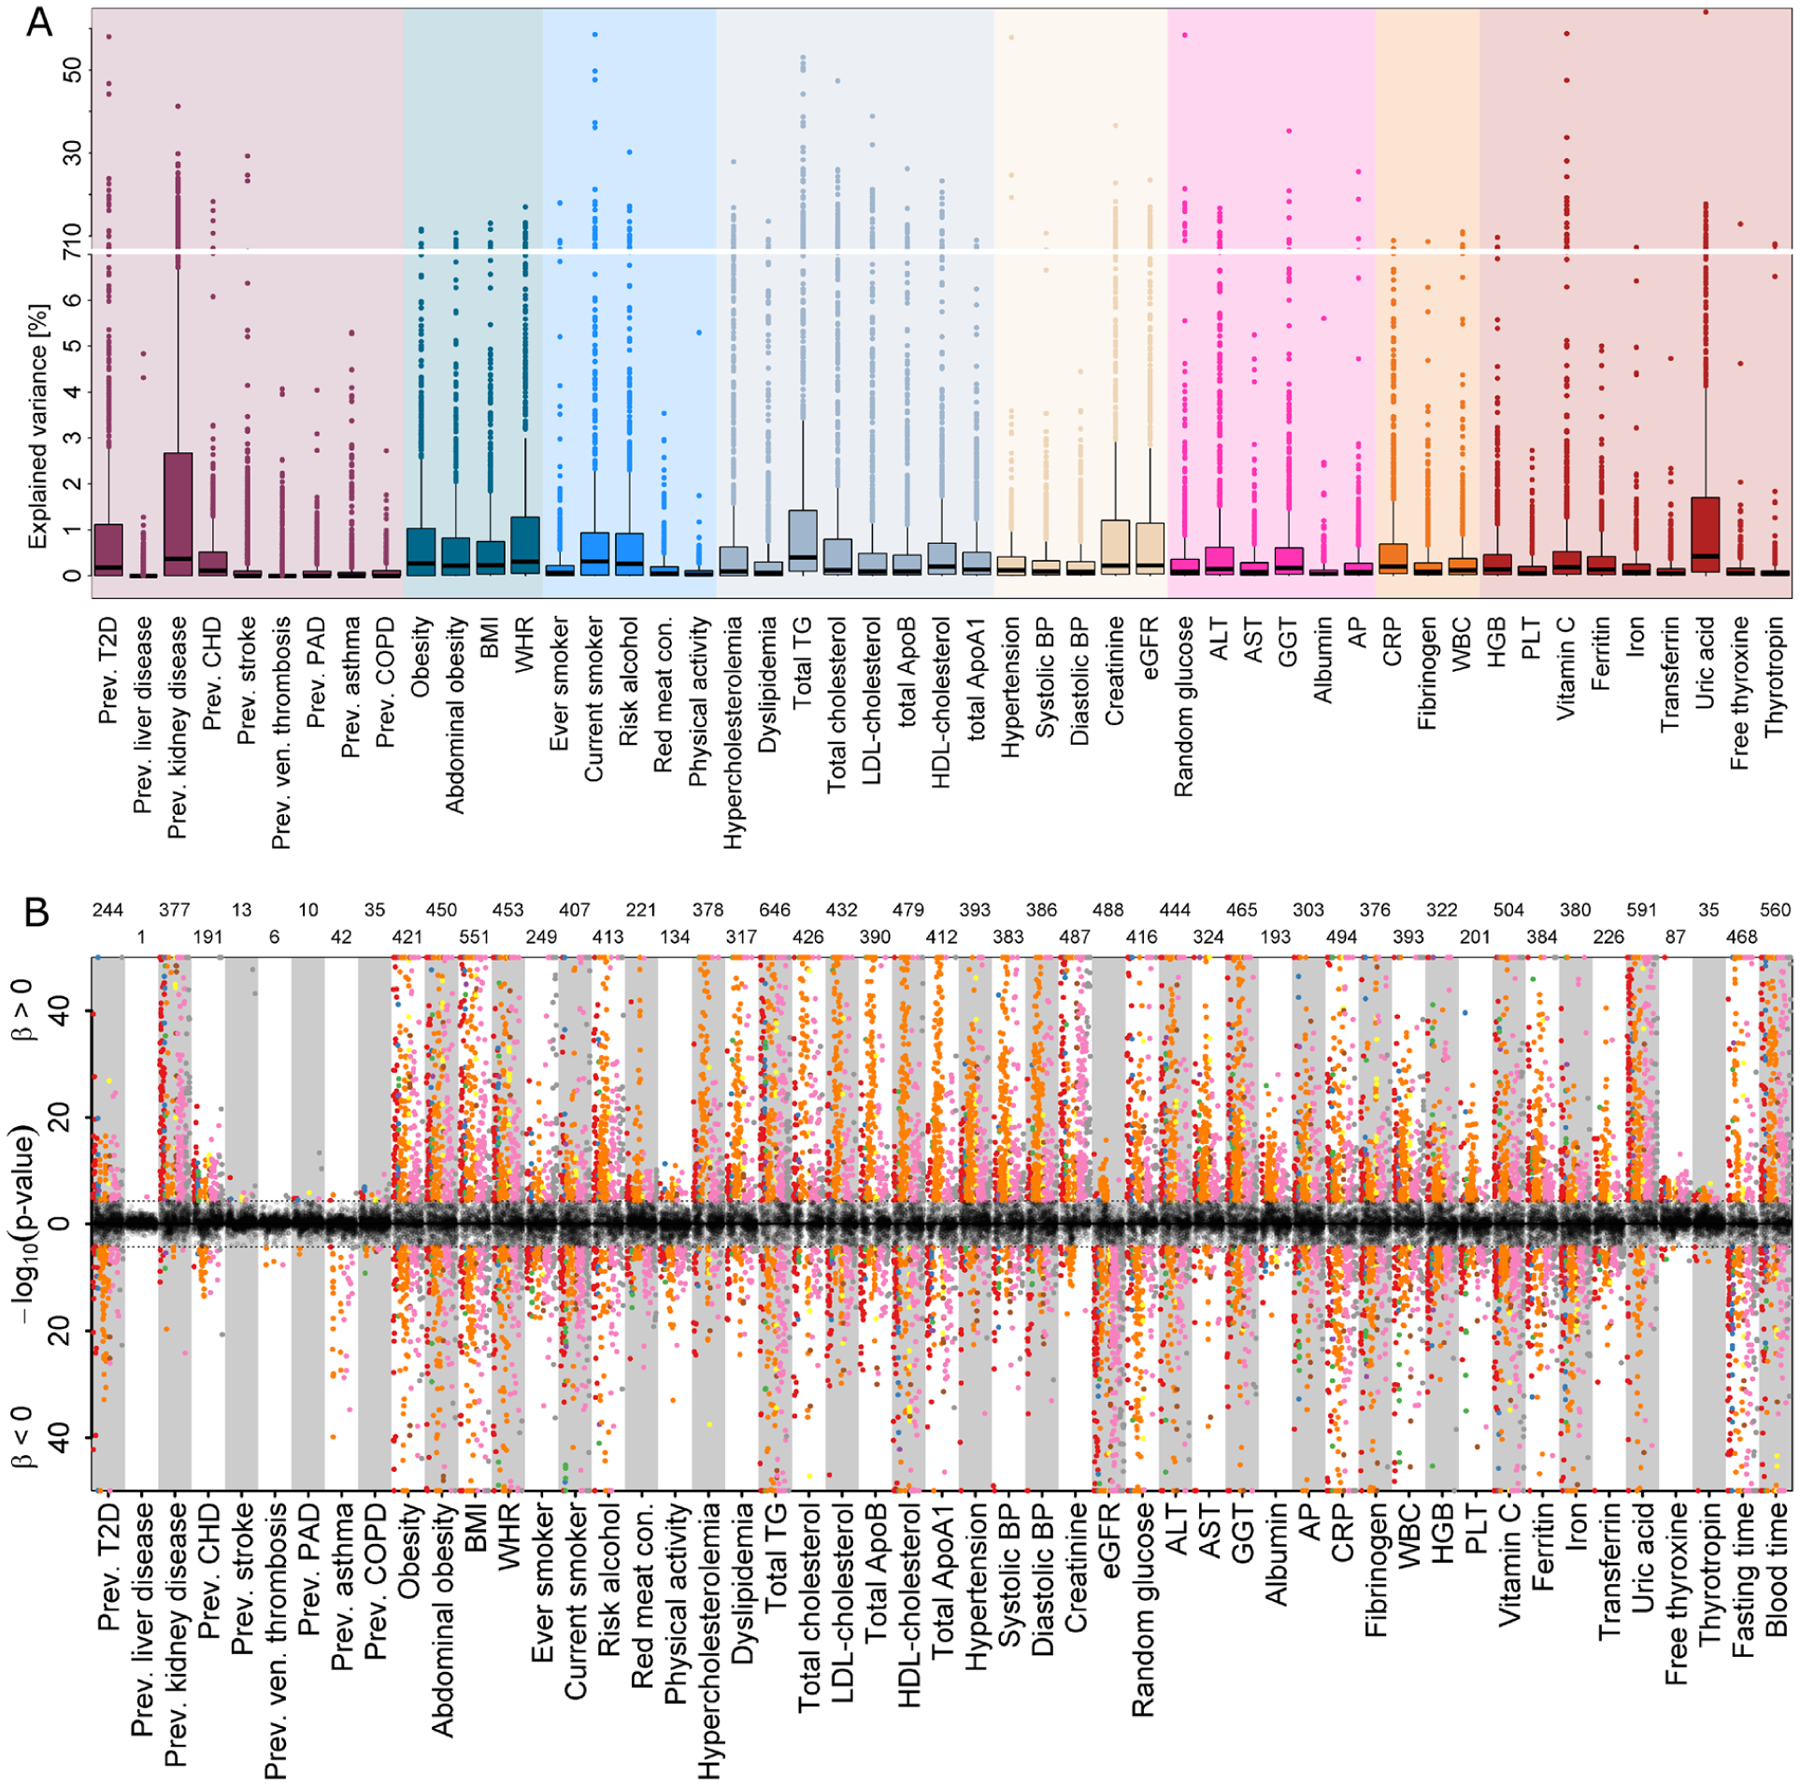
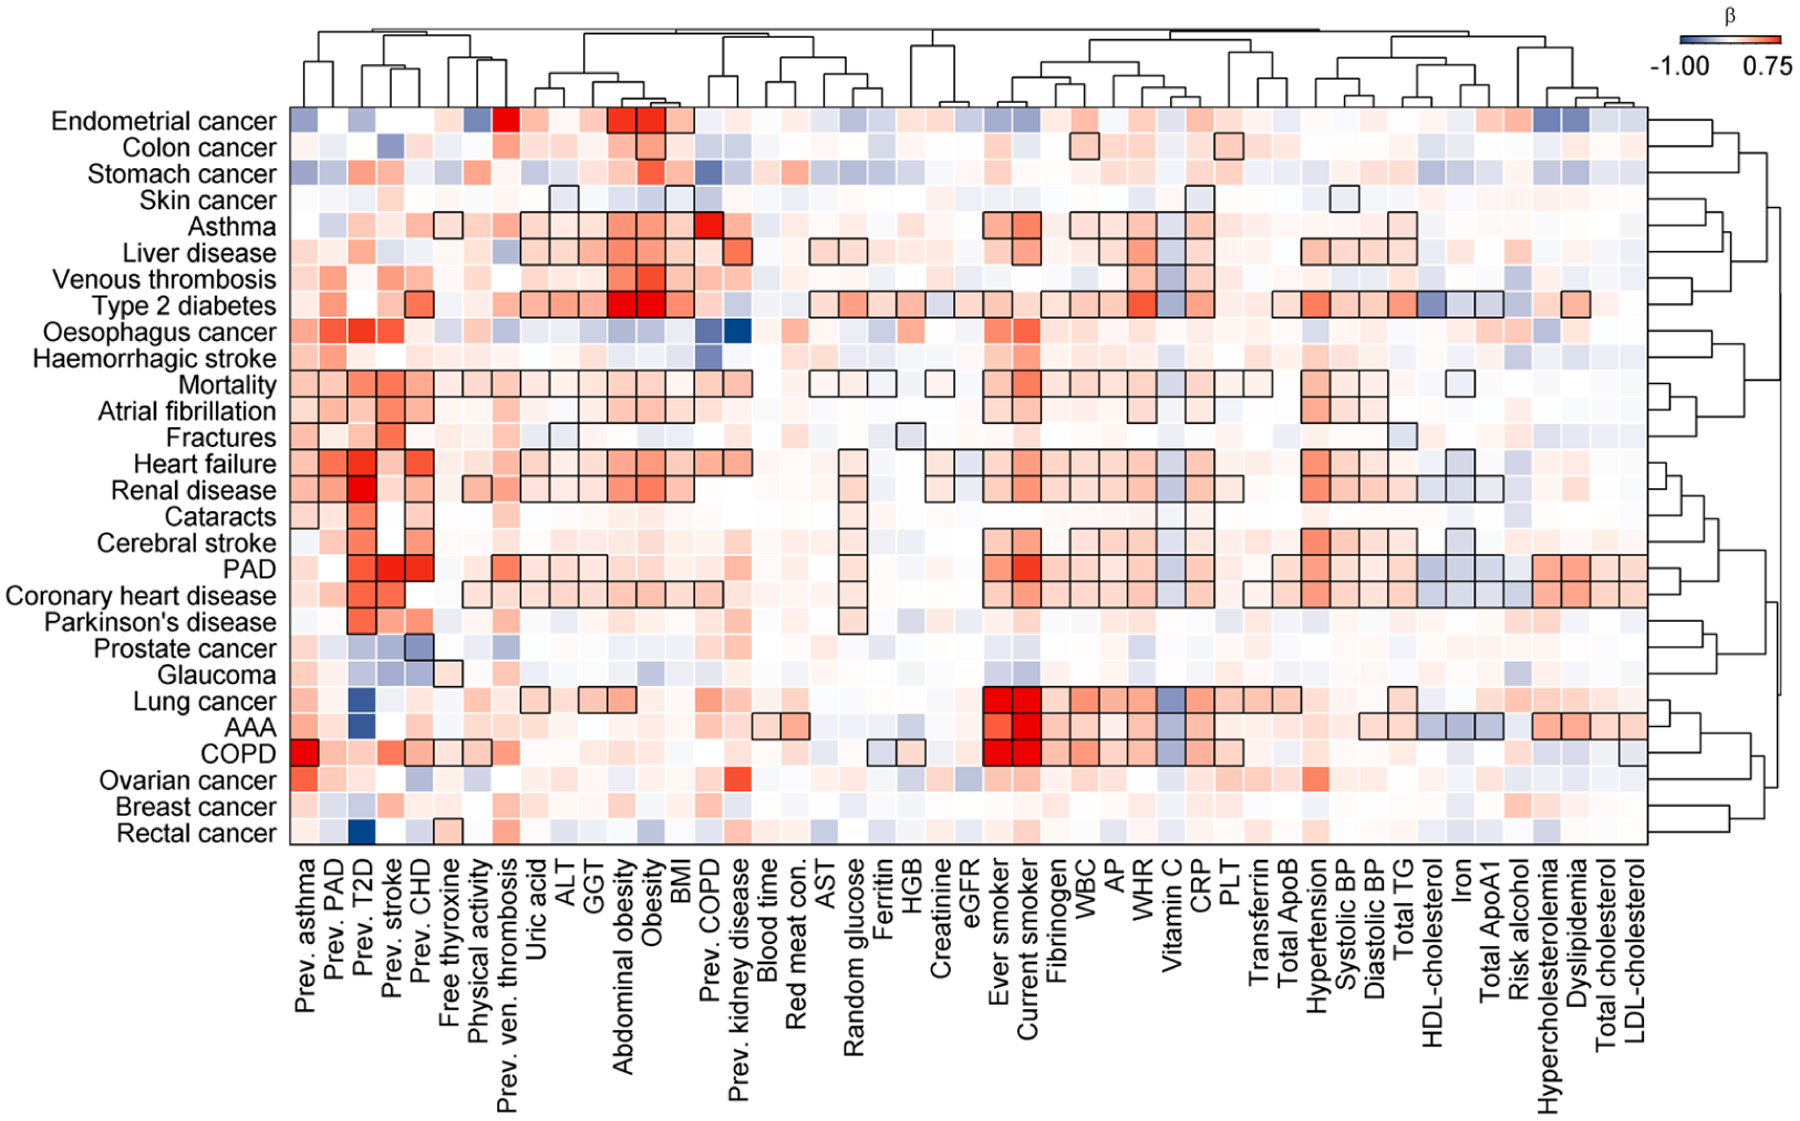
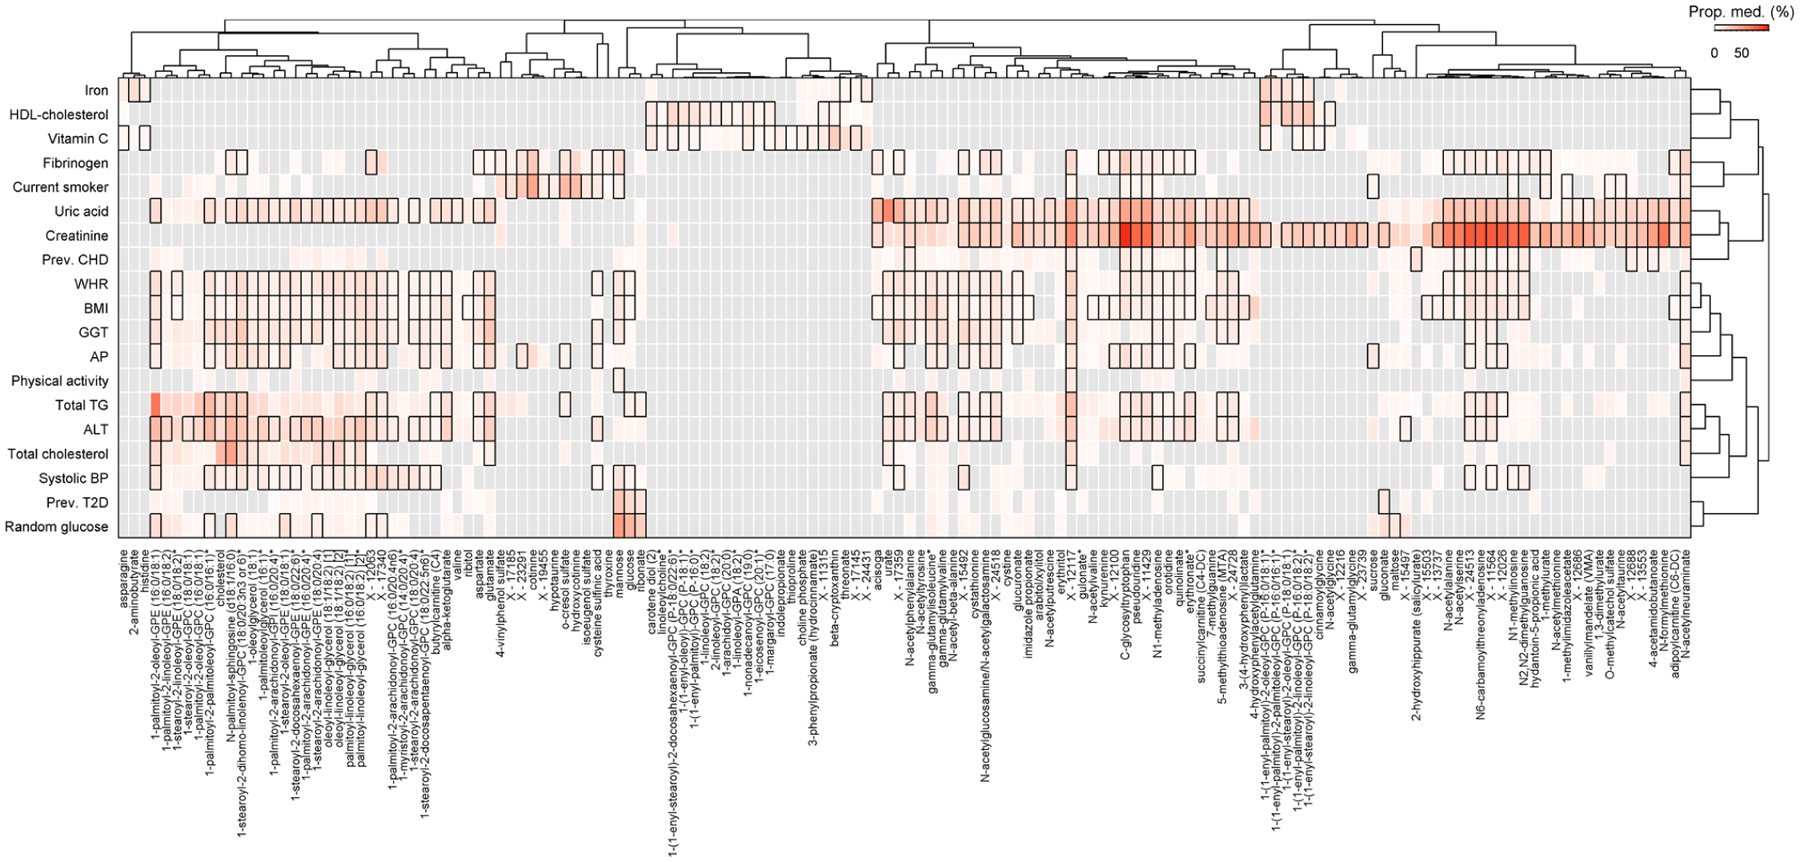
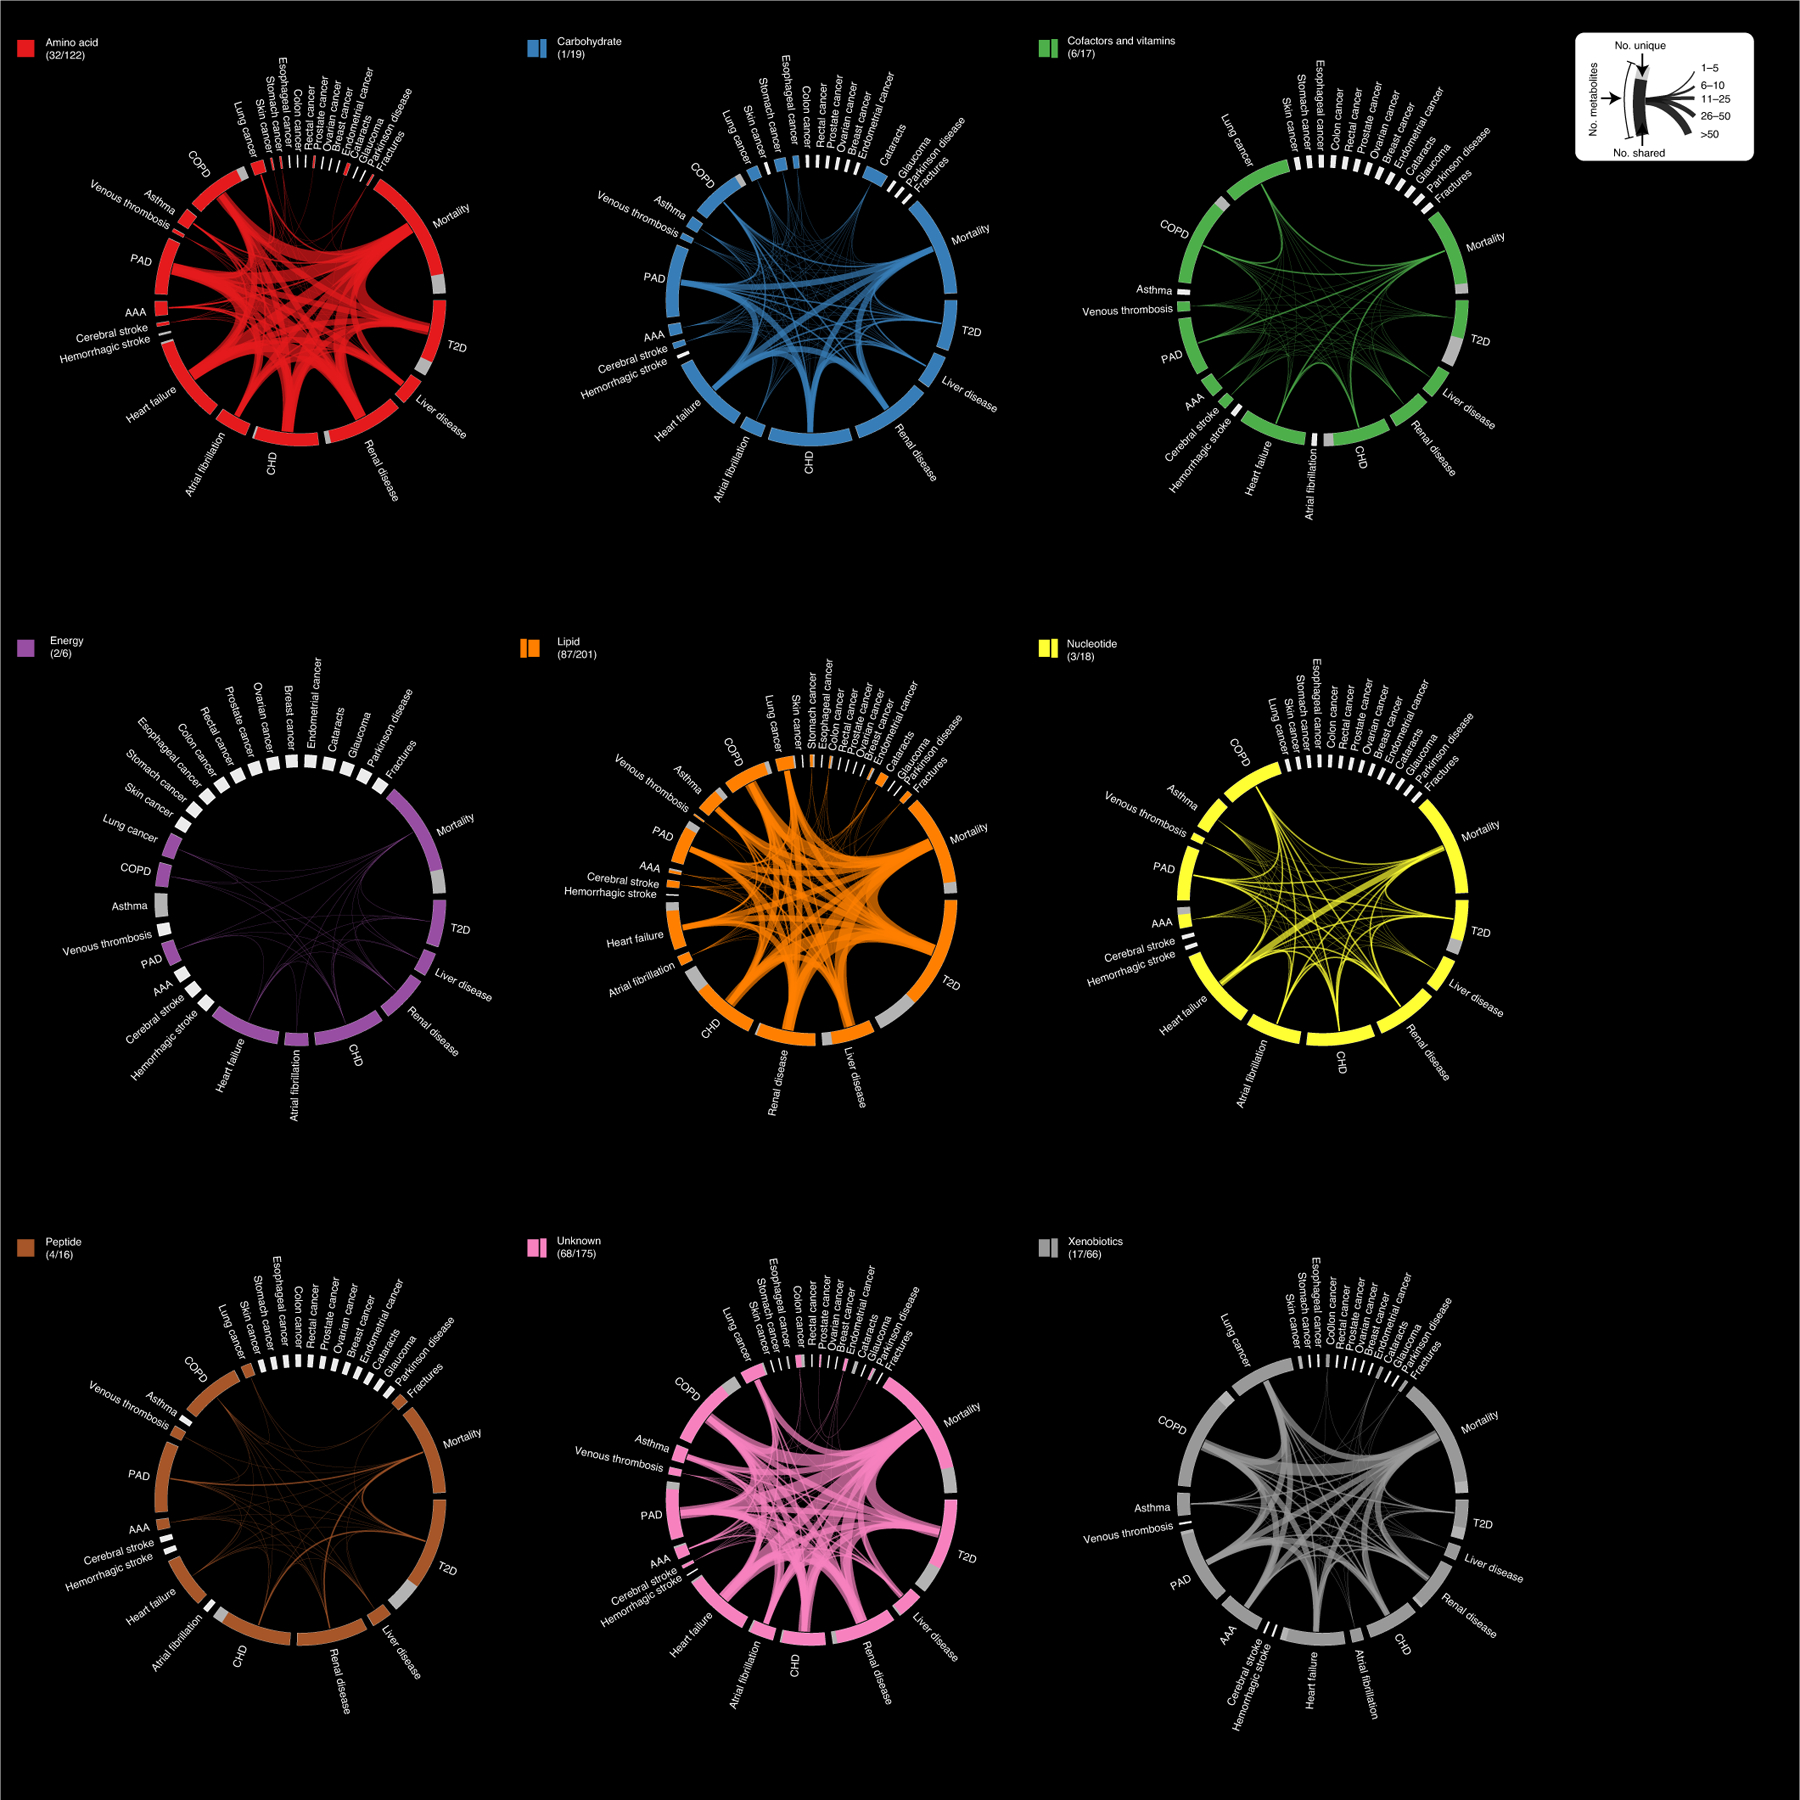
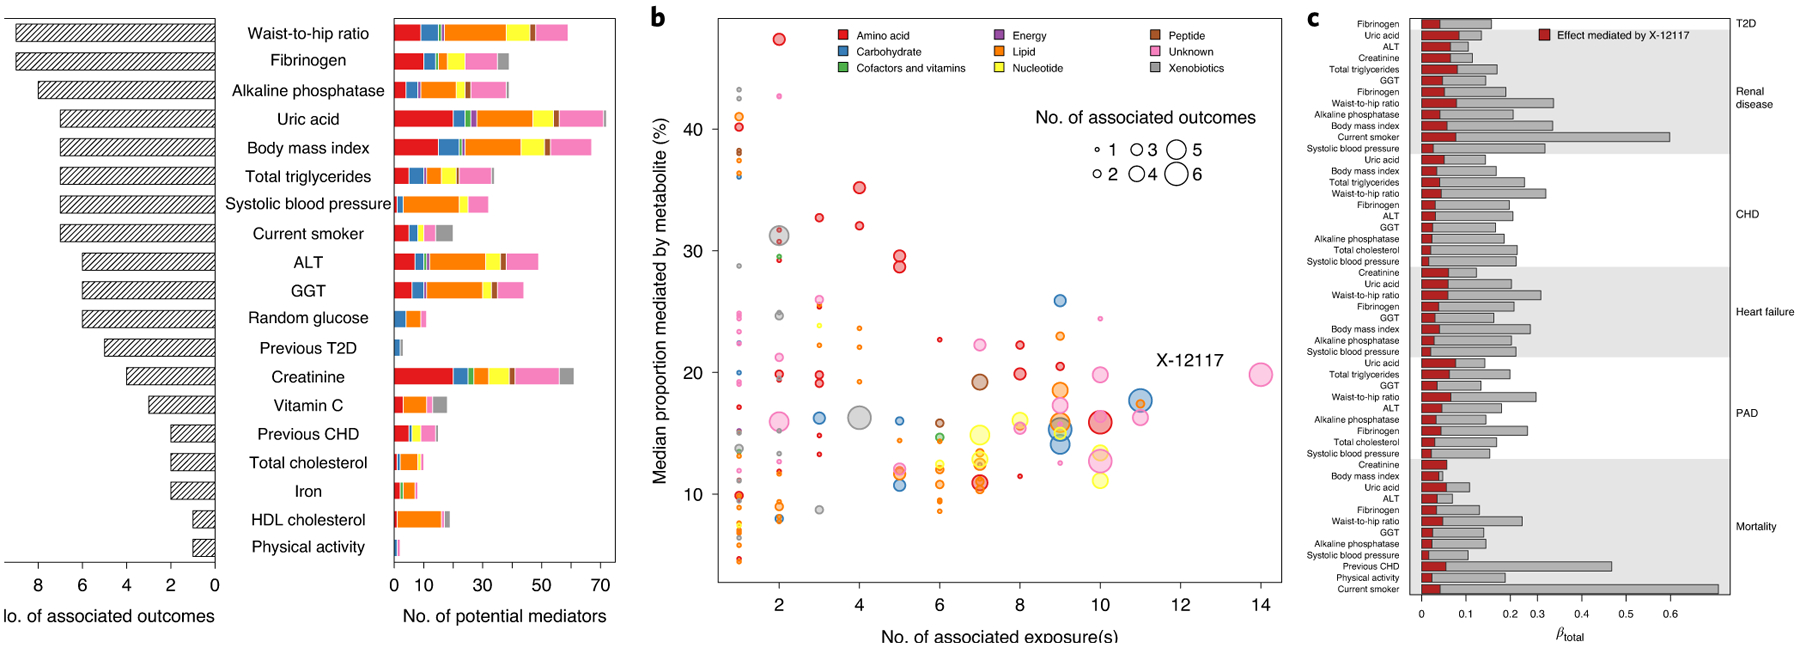
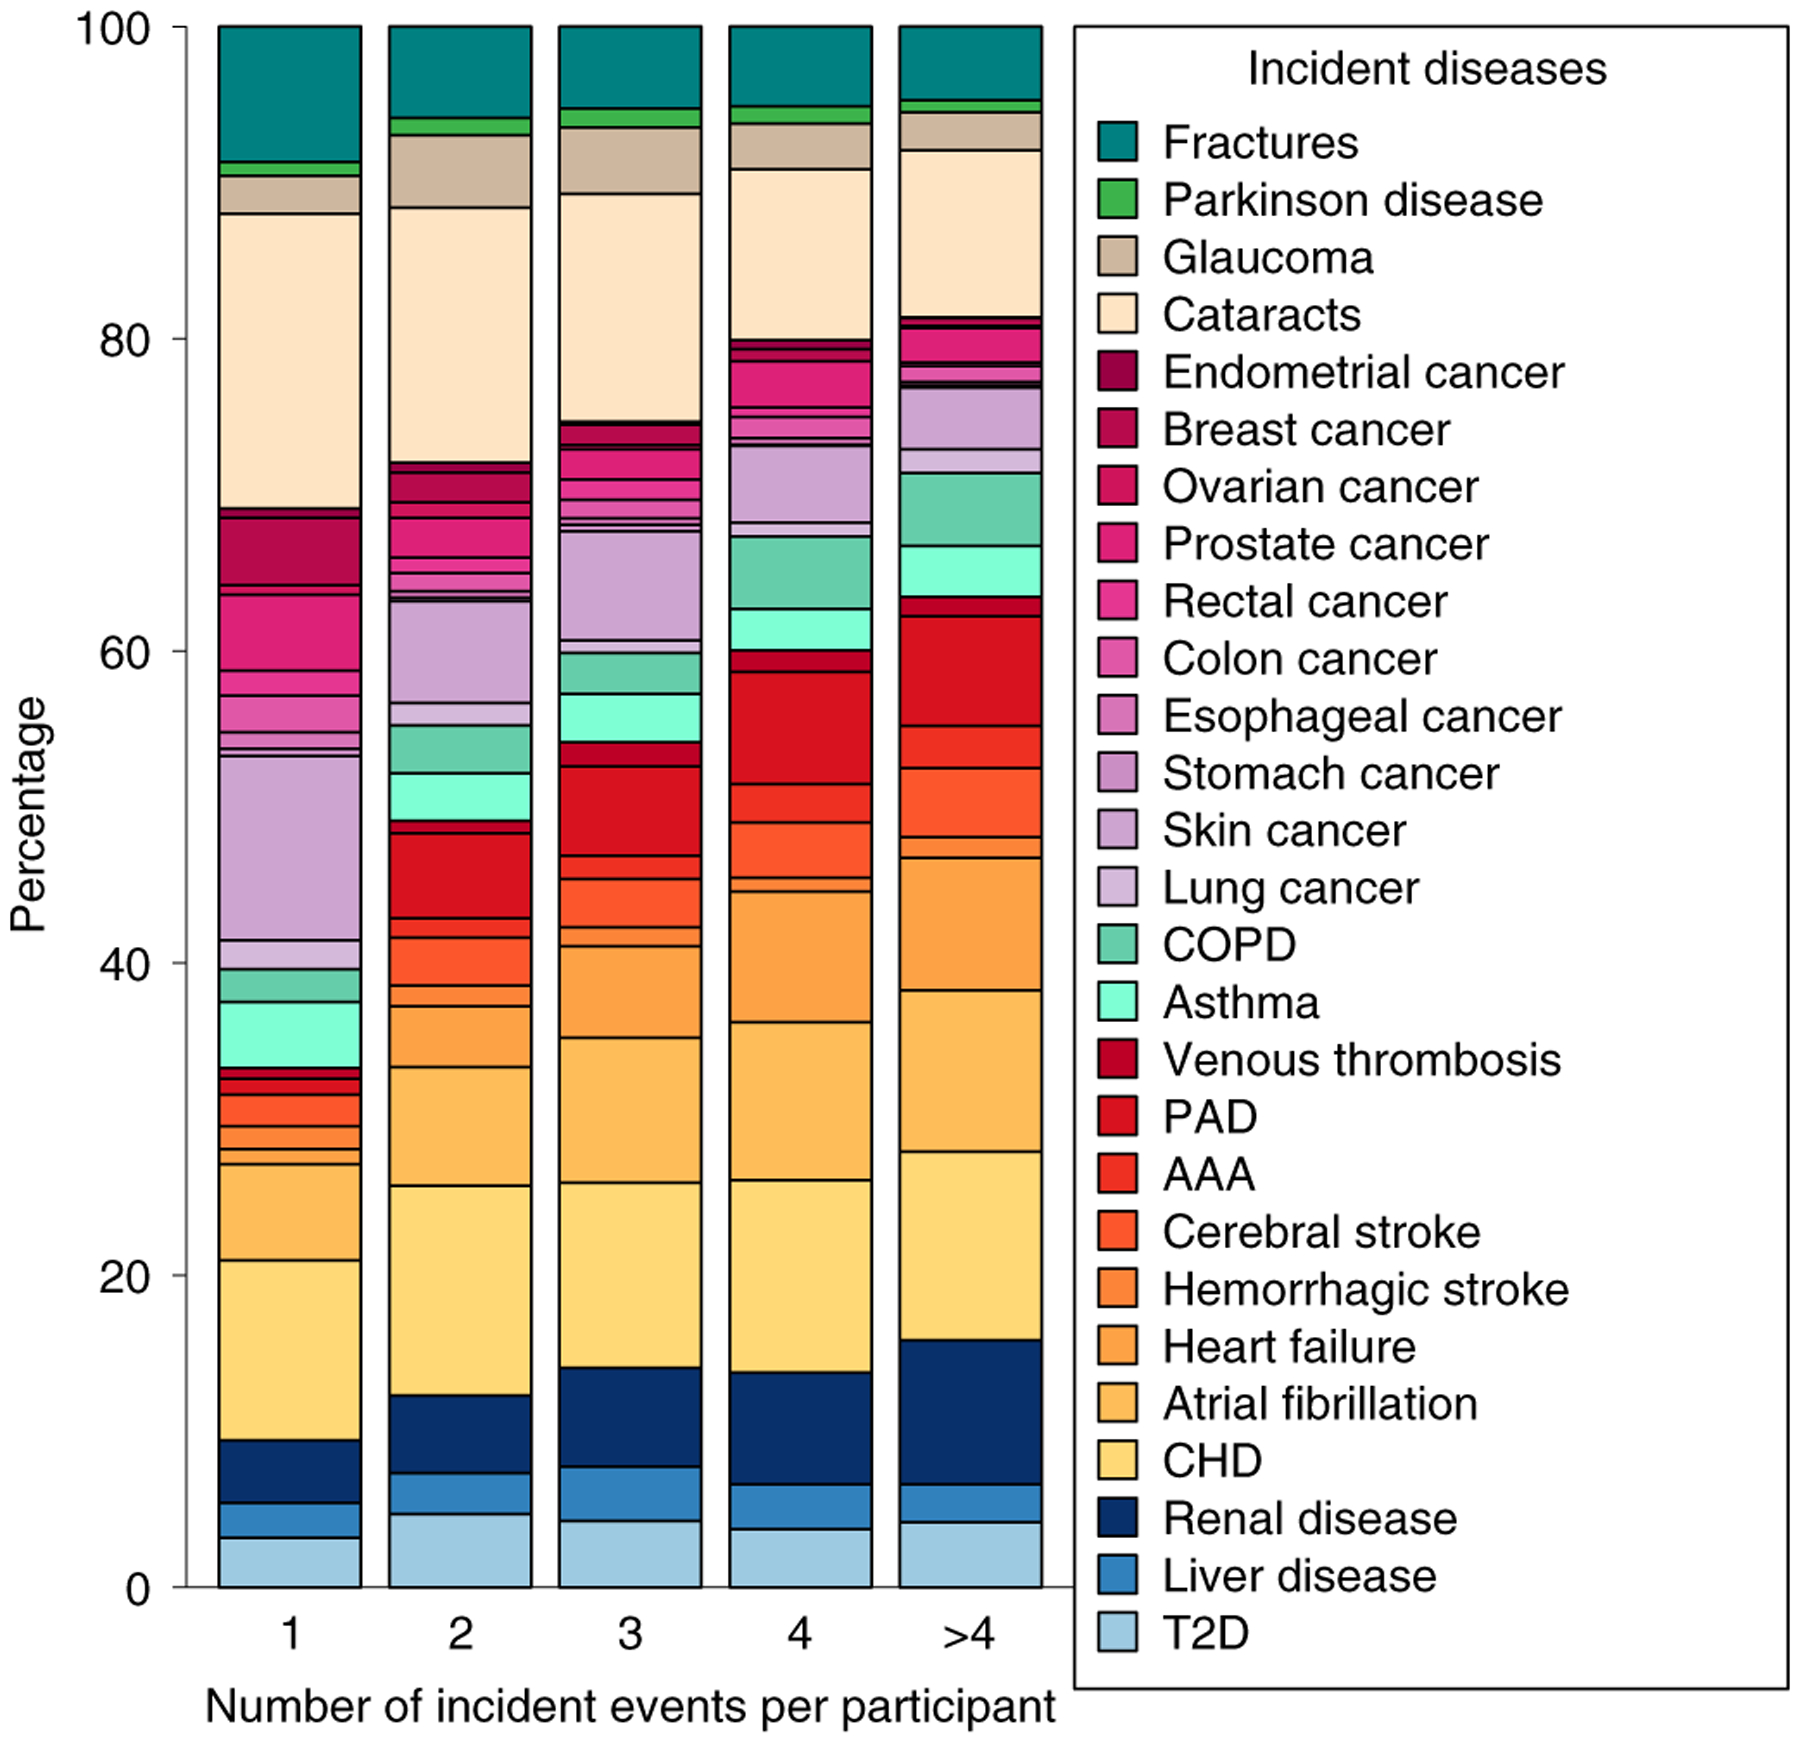
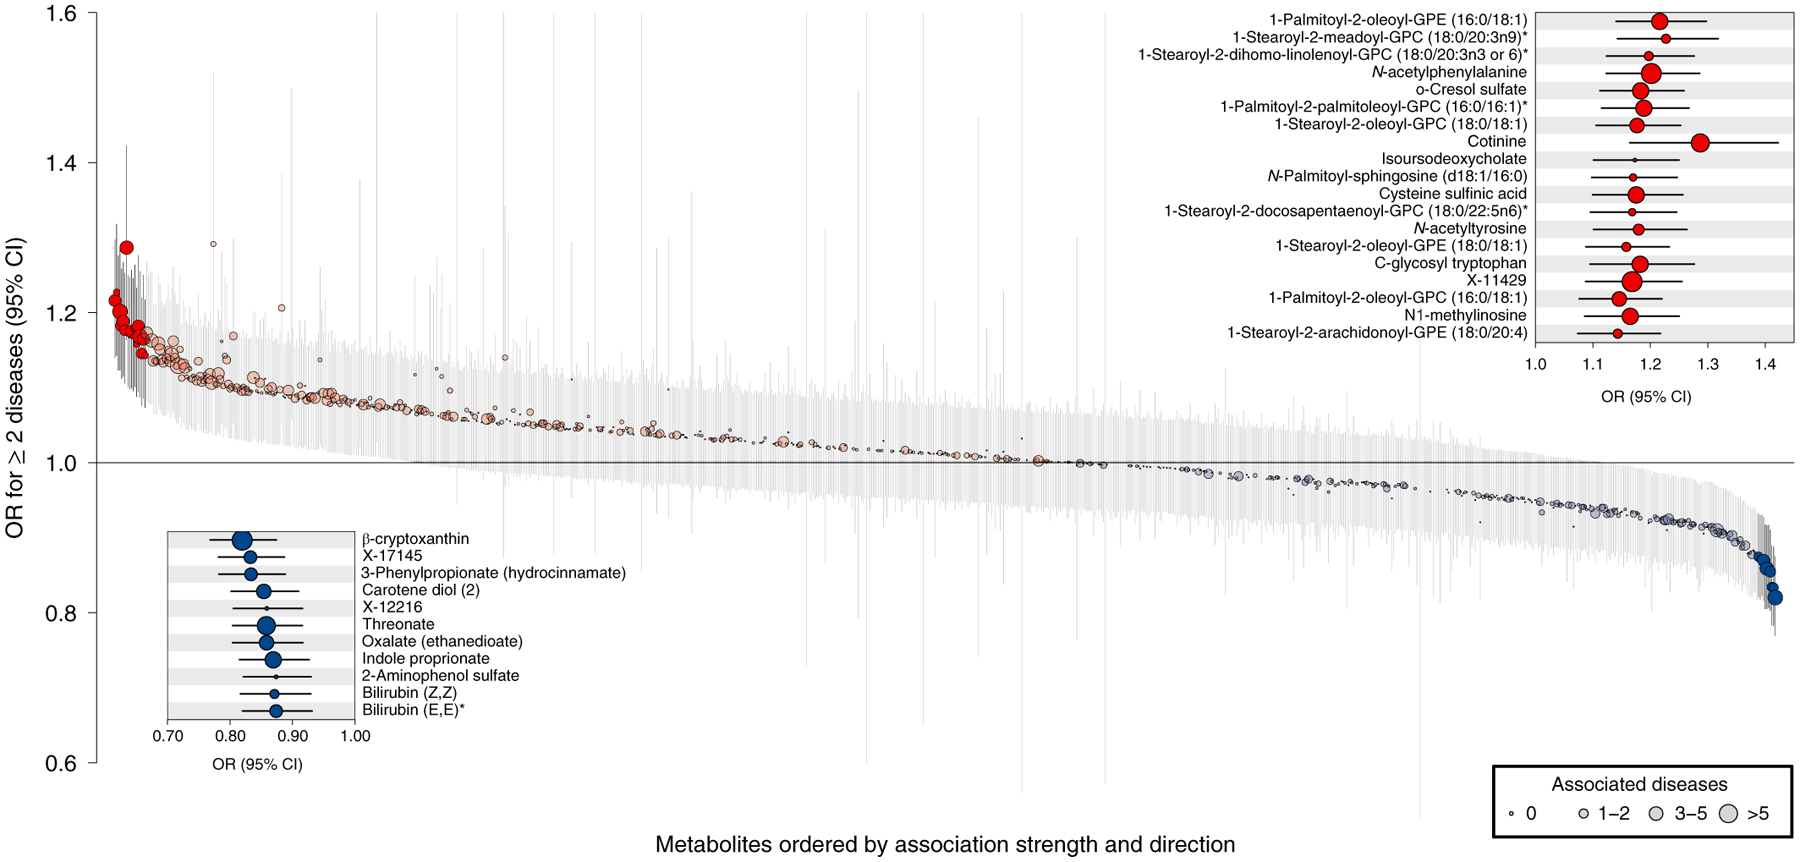
Multimorbidity, the simultaneous presence of multiple chronic conditions, is an increasing global health problem and research into its determinants is of high priority. We used baseline untargeted plasma metabolomics profiling covering >1,000 metabolites as a comprehensive readout of human physiology to characterize pathways associated with and across 27 incident noncommunicable diseases (NCDs) assessed using electronic health record hospitalization and cancer registry data from over 11,000 participants (219,415 person years). We identified 420 metabolites shared between at least 2 NCDs, representing 65.5% of all 640 significant metabolite-disease associations. We integrated baseline data on over 50 diverse clinical risk factors and characteristics to identify actionable shared pathways represented by those metabolites. Our study highlights liver and kidney function, lipid and glucose metabolism, low-grade inflammation, surrogates of gut microbial diversity and specific health-related behaviors as antecedents of common NCD multimorbidity with potential for early prevention. We integrated results into an open-access webserver ( https://omicscience.org/apps/mwasdisease/ ) to facilitate future research and meta-analyses.


Conflict of interest statement

Competing interests

G.A.M. is an employee of Metabolon. All other authors declare no competing interests.

Figures

Extended Data Fig. 1 |
Extended Data Fig. 1 |. Summary of event distribution during follow-up.
Occurrence of events during follow-up. Each line indicates an event. The pin plot on the right gives the total number of cases for each disease. COPD=chronic obstructive pulmonary disease.
Extended Data Fig. 2 |
Extended Data Fig. 2 |. Manhattan-like plot summarizing results from Cox proportional hazard models.
Mirrored Manhattan-like plot showing the p-values from Cox proportional hazard models using metabolite levels as exposure and disease onset as outcome adjusting for age and sex. Colours indicate metabolite classes (see Fig. 1 in main text for a legend) and numbers on top indicate number of significantly associated metabolites (p < 4.93 × 10⁻⁵). Grey dots indicate associations not reaching significance. Positive associations are displayed in the upper panel and inverse associations in the lower. COPD=chronic obstructive pulmonary disease.
Extended Data Fig. 3 |
Extended Data Fig. 3 |. Top five associated metabolites with each outcome.
For each incident disease under investigation hazard ratios with 95%-confidence intervals for the five metabolites with the lowest p-value are shown. Cox models with age as underlying scale were adjusted for sex. T2D=type 2 diabetes mellitus; CHD=coronary heart disease.
Extended Data Fig. 4 |
Extended Data Fig. 4 |. Relation between cases numbers and associated metabolites.
Number of cases against number of significantly associated metabolites for all incident diseases and all-cause mortality, for associations with nominal significance (left) and Bonferroni corrected significance (right panel). The black line indicates a linear fit between both.
Extended Data Fig. 5 |
Extended Data Fig. 5 |. Summary of sensitivity analysis.
A Left panel opposes effect estimates from Cox proportional hazard models (x-axis) with those from logistic regression models (y-axis) using binary event data only. Points are coloured by incident endpoints as labelled on the right and larger points indicate metabolite—disease pairs with p < 0.001. The right panel shows correlation coefficients for effect estimates across all metabolites for a given incident endpoint. B Left panel opposes effect estimates from Cox proportional hazard models (x-axis) including the whole study population with exclusion criteria applied as mentioned in the main text with those from further excluding 469 participants who have died within the first five years after baseline examinations (y-axis). Points are coloured by incident endpoints as labelled on the right and larger points indicate metabolite—disease pairs with p < 0.001. The right panel shows correlation coefficients for effect estimates across all metabolites for a given incident endpoint. C Pearson (left) and Spearman (right) correlation coefficients of effect estimates from Cox proportional hazard models comparing initial results as described in the main text with successive exclusion of participants experiencing any event (excluding all-cause mortality) within the first five years of follow-up.
Extended Data Fig. 6 |
Extended Data Fig. 6 |. Results testing for a modulating effect of sex.
Colour coded heatmap of β-estimates for a sex-metabolite interaction term in Cox proportional hazard models. Cox models were run with the metabolite, sex, and a sex-metabolite interaction term as exposure and disease onset as outcome with age as the underlying time scale. Red shades indicate a stronger effect among women, whereas blue indicates the opposite. Rectangles surrounded with a black frame indicate a p-value<0.001 correcting for 28 outcomes tested for each metabolite.
Extended Data Fig. 7 |
Extended Data Fig. 7 |. Amount of variance explained in plasma levels of metabolites by different risk factors at baseline.
A Results from variance decomposition analysis of plasma metabolites levels using information on 50 baseline characteristics. Each trait was treated separately to avoid collinearity in a model comprising age, sex, blood sampling time, and fasting duration. B Mirrored Manhattan-like plot showing the p-values from linear regression models using one of the traits on the x-axis as exposure and metabolite levels as outcome adjusting for age and sex. Colours indicate metabolite classes and numbers on top indicate number of significantly associated metabolites (p < 4.93 × 10⁻⁵). Grey dots indicate associations not reaching significance. Positive associations are displayed in the upper panel and inverse associations in the lower. Labels are explained in Supplementary Table 2.
Extended Data Fig. 8 |
Extended Data Fig. 8 |. Results from Cox models testing risk factors and outcomes.
Colour coded heatmap of β-estimates from Cox proportional hazard models. Results are restricted to significantly associated (p < 0.01; black frames) cross-sectional traits of at least one incident disease. Positive associations are indicated in red, whereas inverse associations are blue. Diseases and cross-sectional traits were ordered using hierarchical clustering with absolute correlations as distance. All abbreviations are listed in Supplementary Table 2.
Extended Data Fig. 9 |
Extended Data Fig. 9 |. Amount of effect mediated from a risk factor onto an outcome through a specific metabolite.
Heatmap of risk factor—metabolite pairs with a significant indirect effect of the risk factor on at least one of the diseases under investigation. Colouring was done based on the median proportion mediated by a metabolite across all diseases. The proportion mediated was derived as quotient of the main effect from two different Cox proportional hazed models, one with and one without adjusting for the metabolite and both including the risk factor as main exposure. Boxes indicate corrected statistical significance with at least one disease (p < 0.05/6,364) and grey shades indicate not tested due to missing requirements for mediation analysis.
Extended Data Fig. 10 |
Extended Data Fig. 10 |. Pairwise correlation heatmap of multimorbidity candidate metabolites.
Pairwise correlation matrix of plasma metabolites significantly associated with the incidence of NCD multimorbidity. Colours indicate positive (red) or inverse (blue) correlations and black frames indicate statistical significance after correction for multiple testing. Metabolites were clustered based on correlation profiles using hierarchical clustering.
Fig. 1 |
Fig. 1 |. Connectivity between incident diseases established based on associated metabolites.
The outer ring illustrates the number of metabolites associated with each individual disease. Each disease fragment is split to represent associations with at least one other disease (colored) or associations specific to that disease (gray). The lines across the circle connecting two outcomes illustrate the number of metabolites associated with both outcomes, where line width is proportional to the number of metabolites. The outer ring fragments in white indicate that there were no associations with this disease and are proportional to half the size of at least one associated metabolite. Metabolite–disease associations are based on Cox proportional hazards models with age as the underlying timescale adjusting for sex. P < 0.001 was considered significant accounting for 28 diseases tested for each metabolite. Graphs were grouped and colored according to biochemical entities, for example, the graph Amino acid contains only metabolite associations originating from amino acid-related compounds. The numbers in parentheses indicate the number of uniquely associated metabolites and the total number of associated metabolites.
Fig. 2 |
Fig. 2 |. Brick plot showing the ranking of metabolites based on the number of associated incident end points.
Metabolite–disease associations are based on Cox proportional hazards models with age as the underlying timescale adjusting for sex. P < 0.001 was considered significant accounting for 28 diseases tested for each metabolite. The x axis displays the rank of each metabolite according to the number of associated metabolites, counting inverse associations as negative numbers to ease representation of the results. The y axis counts the number of associated metabolites, whereby positive numbers indicate positive associations and negative numbers indicate inverse associations. The colors of each box indicate the associated end point. Selected metabolites with multiple associated end points have been annotated. The single asterisk indicates metabolites that were annotated based on in silico prediction. An interactive version of this figure is available on our web server.
Fig. 3 |
Fig. 3 |. Summary of mediation analysis.
a, Bar chart showing for each exposure the number of putative mediating metabolites (colored bar indicating the composition of metabolite species) and number of associated incident outcomes (shaded bar). Only exposures with at least one associated incident outcome are listed and have been sorted by the number of outcomes. b, For each metabolite, the number of source exposures is plotted against the median proportion mediated by the metabolite. The dot sizes indicate the number of associated outcomes for which the metabolite mediated at least some percentage of the effect of an exposure. c, Detailed listing for the effect estimated to be significantly mediated by X-12117 from the exposures on the left on the risk for a disease listed on the right.
Fig. 4 |
Fig. 4 |. Percentage of each disease acquired during follow-up.
Counts were normalized to the total number of diseases each participant developed. Only participants without any of these diseases at baseline were included (n = 5,699).
Fig. 5 |
Fig. 5 |. Metabolites associated with multimorbidity.
ORs and 95% CIs from logistic regression analysis with plasma metabolites as the exposure and a binary NCD multimorbidity variable (onset of two or more diseases during follow-up) as the outcome adjusting for age and sex. Metabolites were ordered by association strength and direction (from left to right). Coloring indicates the association direction (red, positively; blue, inversely) and statistical significance correcting for multiple testing (darker colors, P < 4.93 × 10⁻⁵). The size of the dots indicates the number of associated diseases in disease-specific Cox models. The single asterisk indicates that metabolites were annotated based on in silico prediction.
Fig. 6 |
Fig. 6 |. Variance explained in the plasma levels of selected metabolites associated with multimorbidity.
Amount of variance explained by risk factors and other continuous traits on selected metabolites, which are representative of metabolites associated with incident NCD multimorbidity (see main text). Solid colors indicate positive associations with metabolite levels, whereas shading indicates inverse associations. The column on the far right indicates the maximum amount of variance for any metabolite by each risk factor: (1) 1,5-anhydroglucitol (1,5-AG); (2) X-14662; (3) creatinine; (4) 2-hydroxyhippurate (salicylurate); (5) X-21364; (6) X-23291; (7) X-12063; (8) cotinine; (9) o-cresol sulfate; (10) X-24293; (11) 1-(1-enyl-stearoyl)- 2-arachidonoyl-GPE (P-18:0/20:4)*; (12) 1-(1-enyl-palmitoyl)-2-linoleoyl-GPC (P-16:0/18:2)*; (13) cholesterol; (14) palmitoyl-linoleoyl-glycerol (16:0/18:2)*; (15) 1-(1-enyl-palmitoyl)-2-oleoyl-GPC (P-16:0/18:1)*; (16) 1-(1-enyl-stearoyl)-2-oleoyl-GPC (P-18:0/18:1); (17) atenolol; (18) glycerol; (19) glucose; (20) N-acetylmethionine; (21) cysteine-glutathione disulfide; (22) retinol (vitamin A); (23) choline phosphate; (24) serine; (25) N-acetylneuraminate; (26) citrate; (27) γ-glutamylglutamine; (28) threonate; (29) perfluorooctanesulfonic acid; (30) bilirubin (Z,Z); (31) betaine; (32) urate; (33) thyroxine; the single asterisk indicates that metabolites were annotated based on in silico prediction. eGFR, estimated glomerular filtration rate.

References

    1. Karczewski KJ & Snyder MP Integrative omics for health and disease. Nat. Rev. Genet 19, 299–310 (2018). - PMC - PubMed
    1. Zhou W et al. Longitudinal multi-omics of host–microbe dynamics in prediabetes. Nature 569, 663–671 (2019). - PMC - PubMed
    1. Alpert A et al. A clinically meaningful metric of immune age derived from high-dimensional longitudinal monitoring. Nat. Med 25, 487–495 (2019). - PMC - PubMed
    1. Schüssler-Fiorenza Rose SM et al. A longitudinal big data approach for precision health. Nat. Med 25, 792–804 (2019). - PMC - PubMed
    1. Hoyles L et al. Molecular phenomics and metagenomics of hepatic steatosis in non-diabetic obese women. Nat. Med 24, 1070–1080 (2018). - PMC - PubMed

Publication types

LinkOut - more resources