. 2021 Dec;5(12):1472-1484.
doi: 10.1038/s41551-021-00691-3. Epub 2021 Mar 11.

A dysfunctional TRPV4-GSK3β pathway prevents osteoarthritic chondrocytes from sensing changes in extracellular matrix viscoelasticity

Affiliations

A dysfunctional TRPV4-GSK3β pathway prevents osteoarthritic chondrocytes from sensing changes in extracellular matrix viscoelasticity

Pranay Agarwal et al. Nat Biomed Eng. 2021 Dec.

Abstract

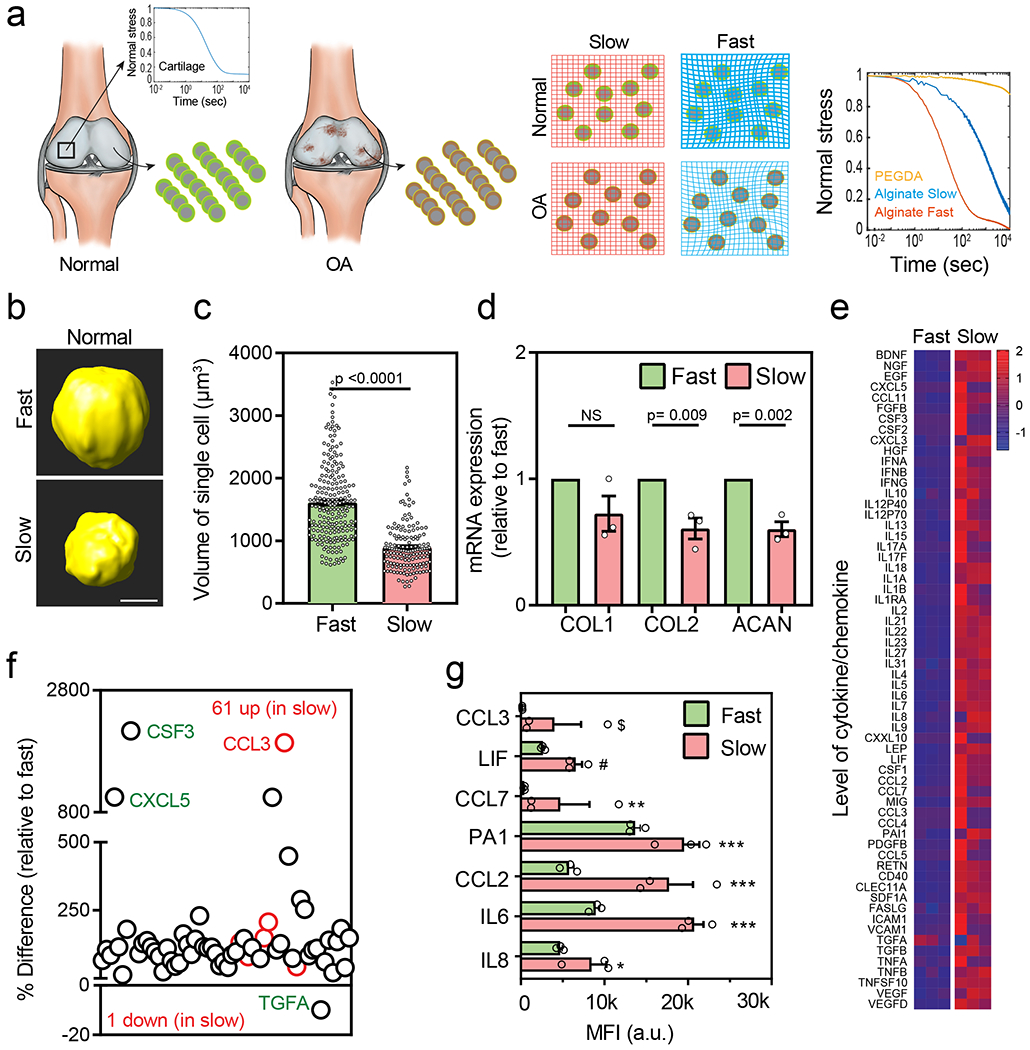
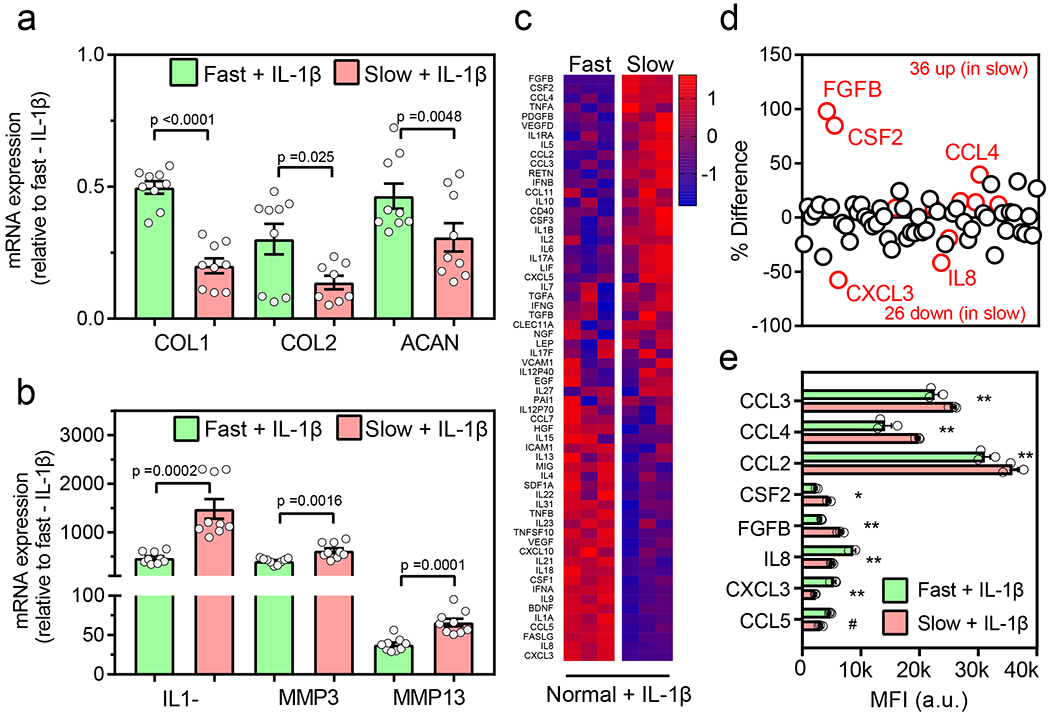
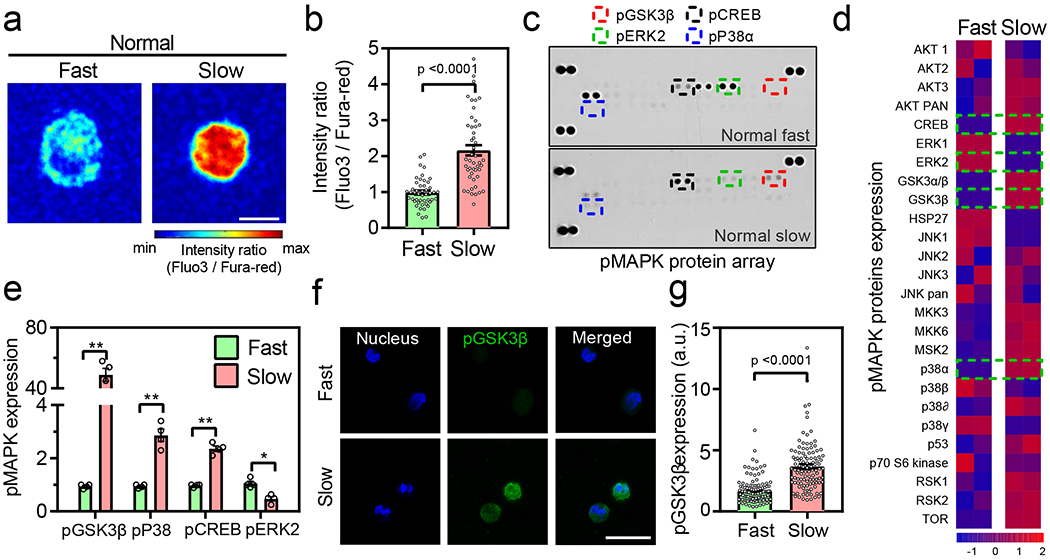
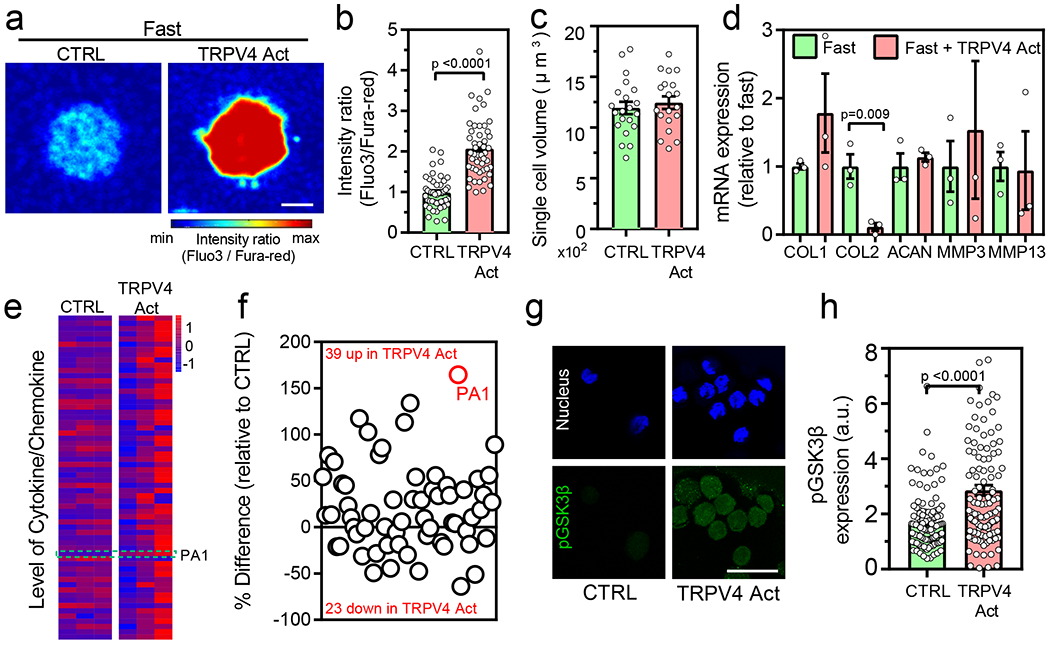
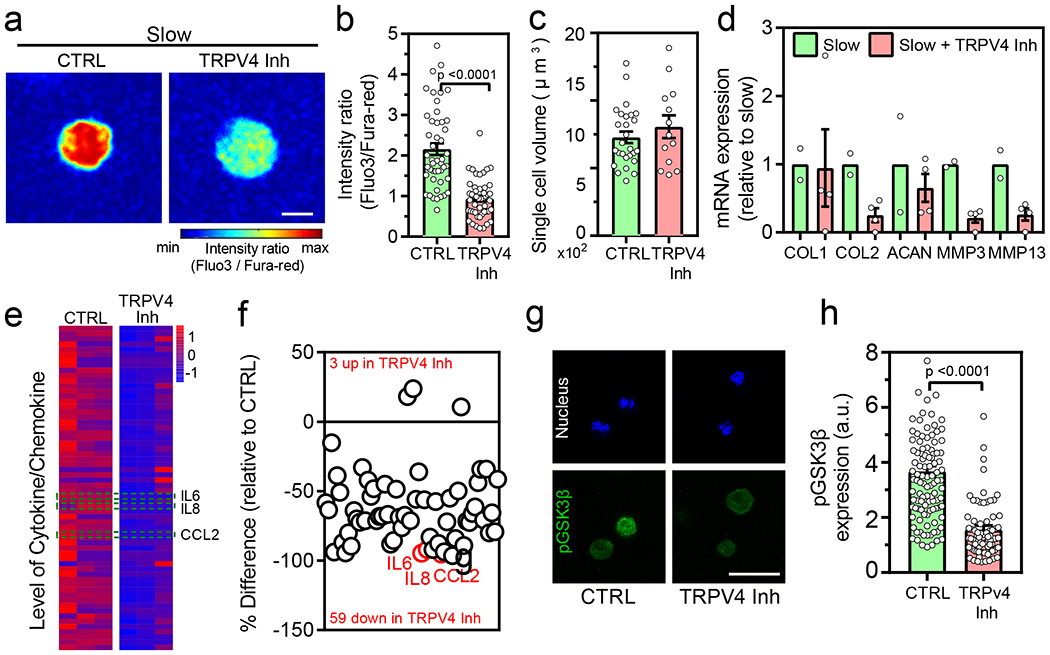
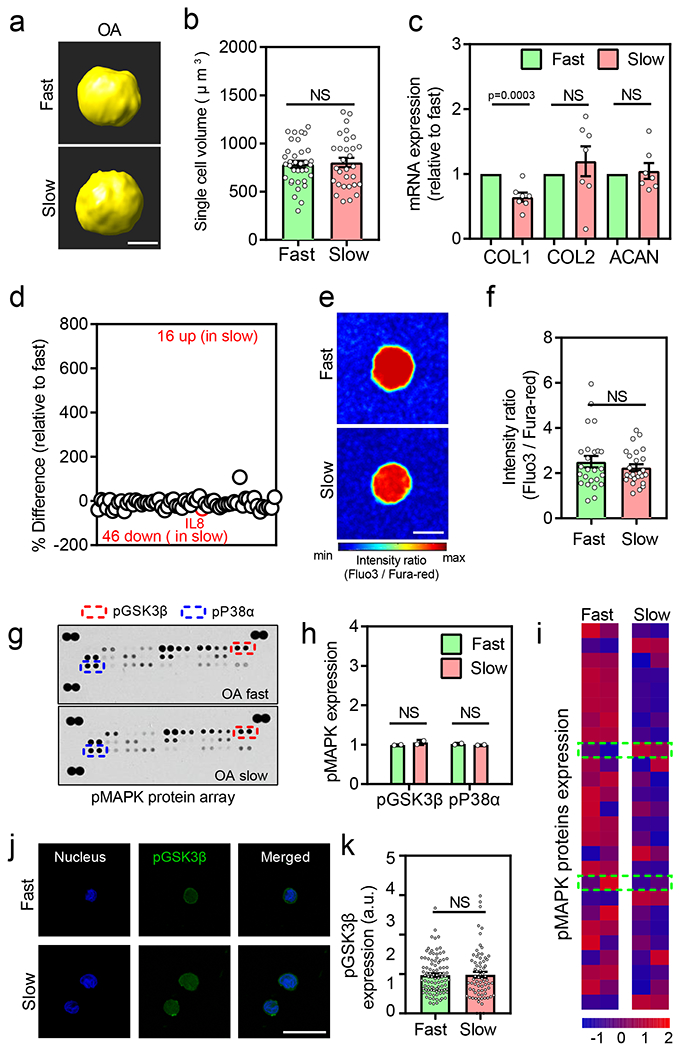
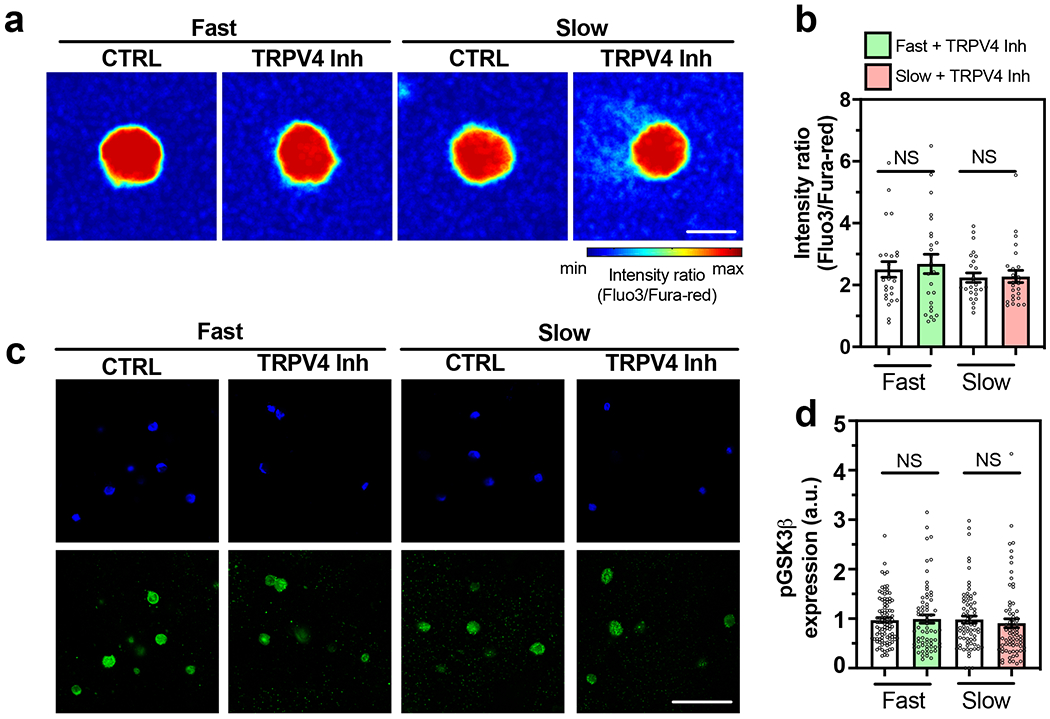
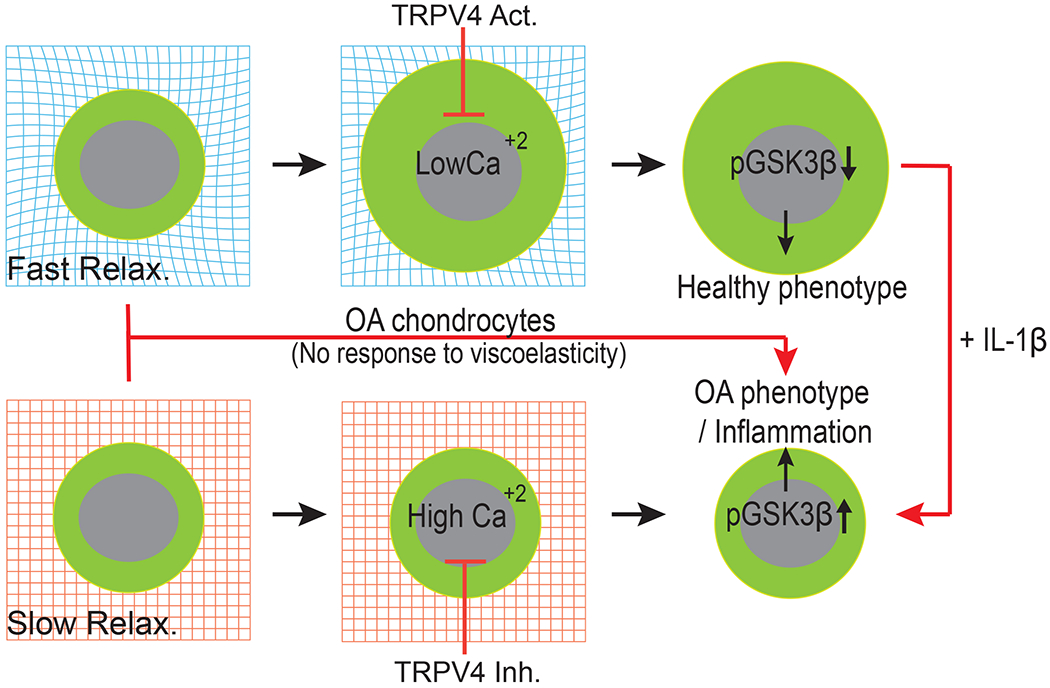
Changes in the composition and viscoelasticity of the extracellular matrix in load-bearing cartilage influence the proliferation and phenotypes of chondrocytes, and are associated with osteoarthritis. However, the underlying molecular mechanism is unknown. Here we show that the viscoelasticity of alginate hydrogels regulates cellular volume in healthy human chondrocytes (with faster stress relaxation allowing cell expansion and slower stress relaxation restricting it) but not in osteoarthritic chondrocytes. Cellular volume regulation in healthy chondrocytes was associated with changes in anabolic gene expression, in the secretion of multiple pro-inflammatory cytokines, and in the modulation of intracellular calcium regulated by the ion-channel protein transient receptor potential cation channel subfamily V member 4 (TRPV4), which controls the phosphorylation of glycogen synthase kinase 3β (GSK3β), an enzyme with pleiotropic effects in osteoarthritis. A dysfunctional TRPV4-GSK3β pathway in osteoarthritic chondrocytes rendered the cells unable to respond to environmental changes in viscoelasticity. Our findings suggest strategies for restoring chondrocyte homeostasis in osteoarthritis.


Conflict of interest statement

Competing interests

The authors declare no competing interests. Neither financial support nor other benefits have been obtained from any commercial sources for this study.

Figures

Fig. 1 |
Fig. 1 |. Normal chondrocytes exhibit a robust response to differential stress relaxation with changes in volume, gene expression and secreted factors.
(a) Schematic of the experimental procedure to isolate healthy chondrocytes and diseased (OA) chondrocytes (from patients undergoing total knee arthroplasty). Inset graph depicts the stress relaxation profile of a normal cartilage. After isolation, chondrocytes were expanded and encapsulated in slow and fast relaxing 3D alginate gels with an initial modulus of ~3kPa (middle panels). Stress relaxation profiles of fast and slow relaxing gels without cells are also shown (right panel). The relaxation profile of PEGDA is shown which is a generally used covalently crosslinked synthetic biopolymer for 3D cell encapsulation, (b) Representative 3D rendering of single normal chondrocytes from confocal imaging in fast (top panel) and slow (bottom panel) stress relaxation states at day 7with Representative 3D rendering of single normal chondrocytes from confocal imaging in fast (top panel) and slow (bottom panel) stress relaxation states at day 7 (nFast =213, nSlow =155 single cells from 3 different normal donors, p < 0.0001, significance was determined by unpaired two-tailed Student’s t test), (d) mRNA expression of anabolic genes type I collagen (COL1), type II collagen (COL2), and aggrecan (ACAN) in fast and slow relaxing gels for normal (n=3, biological replicates from 3 different normal donors per condition. Expression values are evaluated relative to fast relaxing group. pCOL2 =0.009 and pACAN = 0.002, significance was determined by unpaired two-tailed Student’s t test), (e) Heatmap showing the results of quantitative 62-plex Luminex assay for cytokine/chemokine content in normal chondrocytes cultured in fast and slow relaxing gels. Data is normalized by evaluating Z-score. Colour bar represents the Z-Score. (f) Quantification of % difference (relative to fast relaxing gels) in cytokine/chemokine secretion in normal chondrocytes. Red circles denote all cytokines determined to be statistically different represented in (g), n=3 biological replicates from a single donor per condition, *** p < 0.0001, ** p = 0.0006, * p = 0.007, # p = 0.003, $ p = 0.018 by unpaired multiple t test corrected using Holm-Sidak method. MFI is a raw mean fluorescent intensity. Scale bar: (b) 5 μm. All data shown as mean ± SEM.
Fig. 2 |
Fig. 2 |. Slow ECM stress relaxation primes normal chondrocytes for an elevated response to inflammatory cues.
Normal chondrocytes encapsulated in fast and slow relaxing gels were treated with 40 ng/ml IL1-β for 48 hr. (a) Relative mRNA expression of anabolic genes, type I collagen (COL1), type II collagen (COL2), and aggrecan (ACAN), and (b) catabolic genes, interleukin 1β (IL1-β), matrix metallopeptidases 3 (MMP3) and 13 (MMP13) for normal chondrocytes in fast and slow relaxing gels (nslow_COL2=8 and others n=9 biological replicates per condition from a single normal donor, pCOL1 <0.0001, pCOL2 =0.025, pACAN =0.0048, pIL1-β=0.0002, pMMP3 =0.0016, pMMP13 =0.0001, significance determined by unpaired two-tailed Student’s t test). Expression values are normalized to fast - IL1-β group, (c) Heatmap showing the results of quantitative 62-plex Luminex assay for cytokine/chemokine content in normal chondrocytes in fast and slow relaxing gels. Data is normalized by evaluating Z-score. Colour bar represents the Z-Score. (d) Quantification of % difference (relative to fast relaxing gels) in cytokine/chemokine secretion in normal chondrocytes in fast and slow relaxing gels. Red circles denote all cytokines determined to be statistically different represented in (e), n=3 biological replicates from a single donor per condition, ** p < 0.0001, * p = 0.0002, # p = 0.009 by unpaired multiple t test corrected using Holm-Sidak method. MFI is a raw mean fluorescent intensity. All data shown as mean ± SEM.
Fig. 3 |
Fig. 3 |. Intracellular calcium-dependent changes in cellular signaling landscape in normal chondrocytes.
(a-b) Representative images and quantification of intracellular calcium in normal chondrocytes cultured in fast and slow relaxing gels on day 7 (n= 47 single cells from 3 normal donors per condition, p < 0.0001 significance determined by unpaired two-tailed Student’s t test), (c-d) Representative images and heatmap of phospho MAPK protein array for normal chondrocytes cultured in fast and slow relaxing gels. Data in heatmap is normalized by evaluating Z-score. Colour bar represents the Z-Score. (e) Quantification of expression of phosphorylated GSK3β, P38α, CREB, and ERK2 normal chondrocytes cultured in fast and slow relaxing gels (n=4 biological replicates per condition from cells derived from a single normal donor, ** p < 0.0001, * p = 0.02 by unpaired multiple t test corrected using Holm-Sidak method. Values are normalized to fast relaxing group, (f) Representative confocal images (>100 single cells were imaged per group) of nucleus (blue) and pGSK3β (green) for normal chondrocytes in fast and slow relaxing gels. Bar graph in (g) represents the quantification of pGSK3β fluorescence in all conditions (nfast = 120 and nslow = 109 single cells from 3 normal donors per condition, p < 0.0001 significance determined by unpaired two-tailed Student’s t test). Scale bar: (a) 10 μm (g) 25 μm. All data shown as mean ± SEM.
Fig. 4 |
Fig. 4 |. Activation of TRPV4 leads to increased intracellular calcium levels, pGSK3β expressed and increased inflammatory phenotype.
(a-b) Representative images and quantification of intracellular calcium in normal chondrocytes after treatment with TRPV4 activator (nfast=47, nfast+TRPV4Act=51 single cells from 3 normal donors, p <0.0001 significance determined by unpaired two-tailed Student’s t test), (c) Quantification of volume in normal chondrocytes cultured in indicated conditions (nfast=19, nfast+TRPV4Act=21 single cells derived from a single normal donor, not significant by unpaired two-tailed Student’s t test), (d) Relative mRNA expression of anabolic and catabolic genes (COL1, COL2 ACAN, MMP3, and MMP13) for normal chondrocytes cultured in indicated conditions (nfast=3, nfast+TRPV4Act=3 replicates from a single normal donor, p= 0.009 significance determined by unpaired two-tailed Student’s t test). Expression values in fast relaxing group is utilized to normal the data, (e) Heatmap showing the results of quantitative 62-plex Luminex assay for cytokine/chemokine content in normal chondrocytes from a single donor cultured in indicated conditions. Data in heatmap is normalized by evaluating Z-score. Colour bar represents the Z-Score. Quantification of % difference in cytokine/chemokine secretion is also shown in (f) for the indicated conditions. Red circles denote all cytokines determined to be statistically different by unpaired multiple t test corrected using Holm-Sidak method (p <0.0001 for PA1) (g) Representative confocal images of nucleus (blue) and pGSK3β (green) for normal chondrocytes cultured in the indicated conditions and the quantification of pGSK3β is shown in (h) (nfast=120, nfast+TRPV4Act=116 single cells derived from 3 different normal donors, p <0.0001 significance determined by unpaired two-tailed Student’s t test). Scale bar: (a) 10 μm (g) 25 μm. All data shown as mean ± SEM.
Fig. 5 |
Fig. 5 |. Inhibition of TRPV4 leads to decreased intracellular calcium levels, pGSK3β expression and reduced inflammatory phenotype.
(a-b) Representative images and quantification of intracellular calcium in normal chondrocytes cultured after treatment with TRPV4 inhibitor (nslow=47 and nslow+TRPV4Inh=48 single cells from 3 normal donors, p <0.0001 significance determined by unpaired two-tailed Student’s t test), (c) Quantification of volume in normal chondrocytes cultured in indicated conditions (nslow=27 and nslow+TRPV4Inh=13 single cells derived from a single normal donor, not significant by unpaired two-tailed Student’s t test), (d) Relative mRNA expression of anabolic and catabolic genes (COL1, COL2 ACAN, MMP3, and MMP13) for normal chondrocytes cultured in indicated conditions (nslow=2 and nslow+TRPV4Inh=4 replicates from a single normal donor, significance determined by unpaired two-tailed Student’s t test). Expression values in slow relaxing group is utilized as an internal control, (e) Heatmap showing the results of quantitative 62-plex Luminex assay for cytokine/chemokine content in normal chondrocytes from a single donor cultured in indicated conditions. Data in heatmap is normalized by evaluating Z-score. Colour bar represents the Z-Score. Quantification of % difference in cytokine/chemokine secretion is also shown in (f) for the indicated conditions. Red circles denote all cytokines determined to be statistically different by unpaired multiple t test corrected using Holm-Sidak method (p <0.0001 for IL6, CCL2 and p=0.016 for IL8) (g) Representative confocal images of nucleus (blue) and pGSK3β (green) for normal chondrocytes cultured in the indicated conditions and the quantification of pGSK3β is shown in (h) (nslow=109 and nslow+TRPV4Inh=84 single cells derived from 3 different normal donors, p <0.0001 significance determined by unpaired two-tailed Student’s t test). Scale bar: (a) 10 μm (g) 25 μm. All data shown as mean ± SEM.
Fig. 6 |
Fig. 6 |. Response to viscoelasticity is absent in OA chondrocytes.
(a) Representative 3D rendering of single OA chondrocytes from confocal imaging in different stress relaxation at day 7. (b) Quantification of cell volumes of chondrocytes cultured in different stress relaxation at day 7 (nFast =30 and nslow =35 single cells derived from 3 different OA donors, not significant by unpaired two-tailed Student’s t test), (c) Relative mRNA expression of anabolic genes type I collagen (COL1), type II collagen (COL2), and aggrecan (ACAN) in fast and slow relaxing gels for OA chondrocytes (n=7 OA patients per condition, pCOL1 =0.0003 significance determined by unpaired two-tailed Student’s t test), (d) Quantification of % difference (relative to fast relaxing gels) in cytokine/chemokine secretion in OA chondrocytes. Red circles denote all cytokines determined to be statistically different (n=3 OA patients per condition), p = 0.038 by unpaired multiple t test corrected using Holm-Sidak method), (e-f) Representative images and quantification of intracellular calcium in OA chondrocytes cultured in fast and slow relaxing gels on day 7 (n=26 single cells from 3 different OA patients per condition, not significant by unpaired two-tailed Student’s t test), (g-i) Representative images, quantification of expression of phosphorylated GSK3β and p38α, and heatmap of MAPK protein array for OA chondrocytes cultured in fast and slow relaxing gels Values in (h) are normalized to fast relaxing group (n=2 biological replicates per condition from a single OA donor, significance determined by multiple t test corrected using Holm-Sidak method ). Data in (i) is normalized by evaluating Z-score. Colour bar represents the Z-Score. Top and bottom green-dashed box regions represent data for phosphorylated GSK3β and p38α, respectively, (j) Representative confocal images of nucleus (blue) and pGSK3β (green) for normal chondrocytes in fast and slow relaxing gels. Bar graph in (k) represents the quantification of pGSK3β in all fast and slow relaxing gels (nfast =95 and nslow= 72 single cells from at least 3 OA patients per condition, not significant by unpaired two-tailed Student’s t test). Scale bar: (a) 5 μm, (e) 10 μm (j) 25 μm. All data shown as mean ± SEM.
Fig. 7 |
Fig. 7 |. OA chondrocytes fail to regulate intracellular calcium through TRPV4 leading to perpetually high GSK3β and inflammation.
(a-b) Representative images and quantification of intracellular calcium in OA chondrocytes cultured in fast and slow relaxing gels after treatment with TRPV4 inhibitor (n=25 single cells from 3 OA patients, not significant by unpaired two-tailed Student’s t test), (c) Representative confocal images of nucleus (blue) and pGSK3β (green) as well as the quantification of pGSK3β fluorescence in (d) for OA chondrocytes cultured in the indicated conditions (nfast =95, nfast+TRPV4Inh =67, nslow =72, nslow+TRPV4Inh =71 single cells from 3 OA patients per condition, not significant by unpaired two-tailed by Student’s t test). Scale bar: (a) 10 μm, (c) 50 μm. All data shown as mean ± SEM.
Fig. 8 |
Fig. 8 |. Matrix viscoelasticity is transduced to chondrocytes via TRPV4-GSK3β axis in normal cartilage but not osteoarthritic cartilage.
Chondrocytes cultured in fast relaxation (viscoelastic) matrices can readily remodel their surrounding ECM to dissipate physical stresses, expands volume, and decrease intracellular calcium concentration (low TRPV4 activity). This decrease in intracellular calcium enable higher GSK3β activity (by decreasing phosphorylation of GSK3β) which in turn increases cartilage matrix production and low inflammation associated with healthy phenotype of chondrocytes. In slow relaxing (elastic) matrices (much like a pre-OA microenvironment) physical stress inhibits volume expansion and enables accumulation of intracellular calcium (high TRPV4 activity). This in turn inactivates GSK3β by increasing its phosphorylation leading to high susceptibility to inflammatory insults.

Comment in

References

    1. Glyn-Jones S et al. Osteoarthritis. The Lancet 386, 376–387 (2015). - PubMed
    1. Martel-Pelletier J et al. Osteoarthritis. Nat. Rev. Dis. Primer 2, 16072 (2016). - PubMed
    1. Vincent TL Targeting mechanotransduction pathways in osteoarthritis: a focus on the pericellular matrix. Curr. Opin. Pharmacol. 13, 449–454 (2013). - PubMed
    1. Kim YJ, Bonassar LJ & Grodzinsky AJ The role of cartilage streaming potential, fluid flow and pressure in the stimulation of chondrocyte biosynthesis during dynamic compression. J. Biomech. 28, 1055–1066 (1995). - PubMed
    1. Gu WY, Lai WM & Mow VC Transport of fluid and ions through a porous-permeable charged-hydrated tissue, and streaming potential data on normal bovine articular cartilage. J. Biomech. 26, 709–723 (1993). - PubMed

Publication types

Substances

LinkOut - more resources