. 2021 Apr;17(4):438-447.
doi: 10.1038/s41589-021-00753-2. Epub 2021 Mar 11.

Palmitoylated acyl protein thioesterase APT2 deforms membranes to extract substrate acyl chains

Affiliations

Palmitoylated acyl protein thioesterase APT2 deforms membranes to extract substrate acyl chains

Laurence Abrami et al. Nat Chem Biol. 2021 Apr.

Abstract

Many biochemical reactions require controlled recruitment of proteins to membranes. This is largely regulated by posttranslational modifications. A frequent one is S-acylation, which consists of the addition of acyl chains and can be reversed by poorly understood acyl protein thioesterases (APTs). Using a panel of computational and experimental approaches, we dissect the mode of action of the major cellular thioesterase APT2 (LYPLA2). We show that soluble APT2 is vulnerable to proteasomal degradation, from which membrane binding protects it. Interaction with membranes requires three consecutive steps: electrostatic attraction, insertion of a hydrophobic loop and S-acylation by the palmitoyltransferases ZDHHC3 or ZDHHC7. Once bound, APT2 is predicted to deform the lipid bilayer to extract the acyl chain bound to its substrate and capture it in a hydrophobic pocket to allow hydrolysis. This molecular understanding of APT2 paves the way to understand the dynamics of APT2-mediated deacylation of substrates throughout the endomembrane system.


Conflict of interest statement

Competing Financial Interests Statement

The authors declare no competing interests.

Figures
Extended Data Figure 1
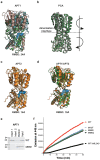
Extended Data Figure 1. The APT crystallographic dimers.
a. Comparative superimposition of S119A APT1/6QGO (light-blue), WT APT1/6QGS (green) and WT APT1/1FJ2 (dark-pink). The average backbone RMSD value is 24 Å. b. Principal component analysis based on atomistic MD simulations on the WT APT1; c. Comparative superimposition of WT APT2/5SYN (orange) and WT APT2/6BJE (light yellow). The average backbone RMSD value is 14 Å; d. Superimposition of WT APT1/6QGS (green) and WT APT2/5SYN (Orange). The average backbone RMSD value is 20 Å. In surface blue representation are the catalytic residues: S119, D74 and H208. e. Association of WT APT1 and β-tongue mutant with liposomes. WT and mutant APT1 proteins were incubated with liposomes and loaded on the bottom of a sucrose gradient. The different interfaces from the top (1) to bottom were collected, loaded on an SDS-PAGE gel, and revealed with Coomassie blue. f. The thioesterase activity of WT APT2, the PosPatch or the ß tongue mutants was monitored as a function of time after the addition of substrate and detergent. APT2-specific inhibitor ML349 was included as a positive control. Technical replicates were averaged within each experiment. Average of the activity between multiple independent experiments at time 60 min are shown in Fig. 2.
Extended Data Figure 2
Extended Data Figure 2. WT and palmitoylation deficient APT2.
HeLa cells were transfected with different myc-tagged APT2 constructs for 24 h. a. Cells were then metabolically labeled for 3 h at 37°C with H-palmitic acid. Proteins were extracted, immunoprecipitated with anti-myc antibodies, subjected to SDS-PAGE gel, analyzed by autoradiography (H-palm), and quantified using the Typhoon Imager or by immunoblotting with anti-myc antibodies. The calculated value of H-palmitic acid incorporation into WT APT2 was set to 100%, and the values for the mutants were expressed relative to this (results are mean SD, n = 5 independent experiments). b. Cells were pulsed with S Cys/Met for 20 min and were chased for the indicated time before immunoprecipitation and SDS-PAGE. Degradation kinetics were analyzed by autoradiography, and were quantified using the Typhoon Imager. S-Met/Cys incorporation was quantified for each time point. S-Met/Cys incorporation was set to 100% for t = 0 after the 20 min pulse, and the different chase times were expressed relative to this (results are mean SD, n = 5 independent experiments). c. Cells were incubated with 1 µM of Palmostatin B for different times at 37°C, lysed, subjected to SDS-PAGE, and analyzed by immunoblotting with anti-myc antibodies. d. Thermal denaturation profiles of WT APT2 protein alone or associated with liposomes (interface 1 of sucrose gradient) as monitored by circular dichroism at 222 nm. The temperature of the samples was increased from 4°C to 94°C by 2°C intervals. The normalized ellipticity at 222 nm is plotted against temperature, results are mean SD, n = 3 technical replicates. e. The levels of APT1 and 2 mRNA were determined by qPCR upon silencing of APT1 or 2, or various ZDHHC genes.
Extended Data Figure 3
Extended Data Figure 3. Effect of S-acylation on APT2 localization and stability.
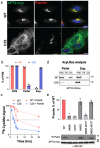
a-e : HeLa cells were transfected with plasmids encoding WT or C2S APT2 for 24 h. a. Confocal microscopy images of cells expressing WT or C2S APT2-myc immunolabeled for APT2 and Giantin. Nuclei were stained with Hoechst. Scale bar: 10 µm. b. PNSs were prepared and ultra-centrifuged to separate the membrane (Pellet) and cytosolic (Sup.) fractions. Equal volumes were analyzed by SDS-PAGE. APT2 WT or C2S levels in each fraction were normalized to that in the PNS (results are mean SD, n = 3 independent experiments). c. Cells expressing APT2-myc constructs were treated or not for 4 h with Palmostatin B, pulsed with S Cys/Met for 20 min and then chased for the indicated time before immunoprecipitation and SDS-PAGE. S-Met/Cys levels were determined for each time point by autoradiography and quantified using the Typhoon Imager. S-Met/Cys levels were normalized to that at t = 0 after the 20-min pulse (results are mean SD, n = 3 independent experiments). d. PNS were prepared from cells expressing WT or C2S APT2-myc and ultra-centrifuged to separate membrane (Pellet) and cytosolic (Sup.) fractions. The amount of palmitoylated protein was determined using Acyl-RAC. For each fraction, palmitoylated proteins were detected after hydroxylamine treatment (+HA). Equal volumes were by analyzed SDS-PAGE and immunoblotting with anti-GFP antibodies. e. Cells were treated for 4 h with MG132 and were then metabolically labeled for 3 h at 37°C with H-palmitic acid. The proteins were extracted, immunoprecipitated with anti-myc antibodies, separated via SDS-PAGE, and analyzed by autoradiography (H-palm), which was quantified using the Typhoon Imager or by immunoblotting with anti-myc antibodies. The calculated value of H-palmitic acid incorporation into WT APT2 was set to 100%, and mutants were expressed relative to this (results are mean SD, n = 3 independent experiments).
Extended Data Figure 4
Extended Data Figure 4. Identification of the APT2 acyltransferases.
a. HeLa cells were silenced for 3 days with individual or mixed pools of ZDHHC RNAi transfected with plasmids encoding citrine-tagged WT APT2. Cells were immunolabeled for citrine-APT2 (green). Bar 10 µM. b. HeLa cells, silenced for 3 days using a control siRNA or an siRNA against ZDHHC3 were immunolabeled against endogenous ZDHHC3 or the Golgi marker GM130. Bar 10 µM. c. HeLa cells expressing myc-ZDHHC7 were immunostained against myc and the ER marker Bap31. Bar: 10 µM. d. The kinetics of recovery after photobleaching were determined for cytosolically expressed mCitrine (~27 kDa) and mCherry-mCitrine (~55 kDa). T1/2 were computed from FRAP curves using non-linear regression assuming one-phase association. Results are mean SEM, n = 8 independent experiments. The recovery time was not affected by the molecular weight difference.
Extended Data Figure 5
Extended Data Figure 5. Palmitate binding in the APT hydrophobic pocket.
a. Ribbon diagrams of APT1 WT and mutants showing the palmitate moiety in blue into the catalytic pocket with the Fo-Fc map in grey mesh. b. APT1 WT showing the 2-bromopalmitate (2-BP) moiety in yellow into the catalytic pocket with the Fo-Fc map in grey mesh. The Br Fo-Fc is displayed with a red mesh. In the dashed circle a zoom in of the 2-BP orientation with the relative anomalous density map in red mesh. b. Determination of the effect of 2-BP on the thioesterase activity of WT APT1 and WT APT2 at 60 min after the addition of substrate and detergent. APT1-specific inhibitor ML348 or APT2-specific inhibitor ML349 at 10 µM were included as positive and negative controls, results are mean SD, n = 3 technical replicates. cd. HeLa cells were transfected with plasmids encoding myc-tagged WT ZDHHC6 constructs for 24 h. Cells were metabolically labeled for 2 h at 37°C with H-palmitic acid and were chased for different times in new complete medium in the presence or not of 2-BP only during the chase. Proteins were extracted, immunoprecipitated with anti-myc antibodies, subjected to SDS-PAGE, analyzed by autoradiography (H-palm), and quantified using the Typhoon Imager or by immunoblotting with anti-myc antibodies. H-palmitic acid incorporation was set to 100% for cells after the pulse, and values obtained after different chase times were expressed relative to this (results are mean SD, n = 3 independent experiments). e. 2-bromopalmitate was bound in all APT1 subunits in the asymmetric unit. Ribbon diagram of the 2-BP/APT1 asymmetric unit. The 2-BP molecules are shown in sticks. g. Ribbon diagram of the side (left) and front (right) view of the APT1 enzyme. The residues forming the binding pocket are shown in sticks representation: in red the residues forming the entrance of the pocket, in blue the residues composing the top of the pocket and in light-blue the residues defining the end of the pocket. The rest of the channel is formed by the residues in pink. The entrance of the channel is solvent-exposed and indicated with an orange arrow. The palmitic acid is shown as blue sticks. g. Ribbon diagram of the front view of the apo WT APT1 enzyme (light-green) and palmitate-bounded WT APT1 enzyme (dark-green). In sticks representation, the residues involved in the regulation of the lipid access: Leu184, Phe181, and Leu78.
Extended Data Figure 6
Extended Data Figure 6. The APT2 hydrophobic pocket is essential for activity.
a. Level of expression of APT2 pocket mutants. Total cell extract (TCE) from cells expressing WT or mutant APT2 for 24 h were subjected to SDS-PAGE, and analyzed by immunoblotting with anti-myc antibodies. Anti-actin antibodies were used as a loading control. b. HeLa cells were transfected 24h with plasmids encoding the indicated APT2 constructs. Cells were then metabolically labeled for 2 h at 37°C with H-palmitic acid. APT2 was immunoprecipitated with anti-myc antibodies, subjected to SDS-PAGE, immunoblotted with anti-myc antibodies, and analyzed by autoradiography (H-palm). Quantification of the H-palmitic acid incorporation into different APT2 mutants. The calculated value of H-palmitic acid incorporation into WT APT2 was set to 100%, and the mutants were expressed relative to this (results are mean SD, n = 3 independent experiments). c. ZDHHC6 palmitoylation upon overexpression of APT2 pocket mutants. HeLa cells were silenced for 3 days with APT2 RNAi and were transfected with plasmids encoding myc-tagged WT ZDHHC6 and the indicated APT2 constructs for 24 h. The cells were then metabolically labeled for 2 h at 37°C with H-palmitic acid and were chased for 3 h. Proteins were extracted, immunoprecipitated with anti-myc antibodies, separated via SDS-PAGE, immunoprecipitated with anti-myc antibodies, and analyzed by autoradiography (H-palm). The total extracts (40 µg) were immunoblotted with anti-myc antibodies to determine the expression level of WT and mutant APT2. The calculated value of H-palmitic acid incorporation into ZDHHC6 with WT APT2 was set to 100%, and the mutants were expressed relative to this (results are mean SD, n = 3 independent experiments). d. Representative snapshot of the membrane-bound APT2 state. In orange, the APT2 protein. The catalytic pocket is shown as blue surface, and the membrane bilayer in grey.
Figure 1
Figure 1. Structure and membrane interaction of APTs,
a. Ribbon diagram of APT1 (PDB id: 1FJ2), with β strands in green arrows and helices in orange. An insertion atypical of the α/β hydrolase is boxed. The catalytic active site and the β-tongue are contoured in black. b. Topology of the APT enzymes (APT1 residue numbering is used). c. SEC-MALS analysis of APT1 and APT2. d. Distance plot monitoring APT1 (green) and APT2 (orange) membrane interaction over the MD simulation time. The published APT2 structure (PDB id 5SYN) was used in the MD analyses . n = 5 independent MD replicas were considered for both APT1 and APT2 systems. The filled colors represent the 95% confidence level interval for APT1 (green) and APT2 (orange) distance measurements. e. Electrostatic surface potential of APT1 (left) and APT2 (right) shows the highly positive surface (blue) on the surface. f. Close-up view of the enzyme-protein interaction for APT1 (left) and APT2 (right). The β-tongue is highlighted in blue. The side chains of the residues involved in the membrane interaction are shown as blue sticks.
Figure 2
Figure 2. Membrane binding of APTs.
a. Purified WT APT1 and APT2 protein were incubated with liposomes and applied to the bottom of a step sucrose gradient. The interfaces were collected from top to bottom, loaded on an SDS-PAGE gel, and stained with Coomassie blue. b. Interface 1 (Interf. 1) for APT2-loaded liposomes was analyzed by negative staining and cryo EM. Bar = 100 µm. c. Circular dichroism spectra of WT APT2, the Positive Patch (PosPatch:H38A-H58A-R61A-K69A-K94A) and the ß tongue M68E mutants. d. Thermal denaturation profiles of WT APT2, the PosPatch or the ß tongue mutants as monitored by circular dichroism at 222 nm. The normalized ellipticity at 222 nm is plotted against temperature. e. The thioesterase activity of WT APT2, the PosPatch or the ß tongue mutants was determined at 60 min after the addition of substrate and detergent. APT2-specific inhibitor ML349 was included as a positive control. Technical replicates were averaged within each experiment, and each experiment was normalized to WT. Two-tailed two-sample unequal variance t-tests were performed on the raw values normalized to the plate (n = 3 independent experiments, except PosPastch n = 4). f. WT and different APT2 mutants were incubated with liposomes and applied to the bottom of a sucrose gradient. The different interfaces from the top to bottom were collected and loaded on an SDS-PAGE and stained with Coomassie blue.
Figure 3
Figure 3. Cellular expression and distribution of APT2 PosPatch and ß tongue mutants.
a. Confocal microscopy images of HeLa cells transfected with plasmids encoding APT2-myc WT or Positive Patch (PosPatch: H38A-H58A-R61A-K69A-K94A) for 24 h. Cells were immunolabeled for APT2-myc and Giantin, as Golgi marker. Scale bar: 10 µm. b. HeLa cells expressing WT or the PosPatch APT2 mutant for 24 h were incubated or not for 4 h with MG132. Protein extracts (40 µg) were separated via SDS-PAGE and analyzed by immunoblotting with anti-myc antibodies. Actin was used as a loading control. c. HeLa cells were transfected with plasmids encoding WT or PosPatch mutant APT2-myc for 24 h. Post-nuclear supernatants (PNS) were prepared and ultra-centrifuged to separate membrane (P) from cytosolic (S) fractions. Equal volumes were loaded on a 4–20% gradient SDS-PAGE gel and were analyzed by immunoblotting with anti-myc and anti-Calnexin antibodies. d. HeLa cells expressing WT or mutant APT2-myc for 24 h were incubated or not for 4 h with MG132 and analyzed as in b. e. HeLa cells were transfected with different APT2-myc constructs for 24 h. Cells were pulsed with S Cys/Met for 20 min and chased for the indicated time before immunoprecipitation and SDS-PAGE. Degradation kinetics were analyzed by autoradiography and were quantified using the Typhoon Imager. S-Met/Cys incorporation was quantified for each time point and was normalized to protein expression levels. S-Met/Cys incorporation was set to 100% for t = 0, and all chase times were expressed relative to this (results are mean/SD, n = 3 independent experiments). f. Confocal microscopy images of HeLa cells transfected with plasmids encoding APT2-myc mutants for 24 h. Cells were incubated for 4 h with MG132 and were immunolabeled for APT2-myc and Giantin, as Golgi marker. Scale bar: 10 µm. g. HeLa cells were transfected with plasmids encoding WT or mutant APT2-myc for 24 h. Where applicable, cells were incubated for 4 h with MG132. PNS were prepared and analyzed as in c.
Figure 4
Figure 4. ZDHHCs 3 and 7-mediated APT2 S-acylation and the effect on activity.
a. HeLa cells were silenced for 3 days with APT2 RNAi and transfected with plasmids encoding myc-tagged WT ZDHHC6 and APT2 WT or C2S for 24 h. The cells were then metabolically labeled for 2 h at 37°C with H-palmitic acid and chased for 3 h in free medium. Proteins were extracted, immunoprecipitated with anti-myc antibodies, subjected to SDS-PAGE, and analyzed by autoradiography (H-palm) or by immunoblotting with anti-myc antibodies. b. Confocal microscopy images of HeLa cells transfected with siRNAs against ZDHHC3, 7, or both, plasmids encoding APT2-citrine for 24h, and immunolabelled for GM130. Scale bar: 10 µm. c. High-throughput automated immunofluorescence quantification of HeLa cells processed as in b, depicting the ratio of APT2 mean intensity values between the Golgi (marked by GM130) and the cytosol (cell mask without nuclei and Golgi). Violin plots show the frequency distribution of all values within a representative experiment with median (red line) and quartiles (black lines). n = 1920, siCtr; 1856, siZDHHC3; 2333, siZDHHC7; 2140, siZDHHC3/7 and p values were obtained by One-way ANOVA with Tiukey’s multiple comparison test (p****<0.0001). Equivalent results were obtained for two independent analyses. d. HeLa cells were transfected with siRNAs against ZDHHC3, 7 or both and a plasmid encoding APT2-myc, then metabolically labeled for 2 h at 37°C with H-palmitic acid. Proteins were extracted, immunoprecipitated with anti-myc antibodies, subjected to SDS-PAGE, and analyzed by autoradiography (H-palm) or by immunoblotting with anti-myc antibodies (results are meanHSD, n = 5 independent experiments). ef. Fluorescence recovery after photobleaching curves for APT2 WT and palmitoylation deficient C2S mutant. The recovery within a bleached region chosen outside of the Golgi area was followed for 20 s at 180 ms intervals and expressed as percentage relative to prebleach fluorescence value of the region (f). Data were fit using non-linear regression. Half-time of recovery (t1/2) was defined as the time required to achieve half of the maximum fluorescence value, was computed using one-phase association equation (e). Results are mean)SEM, n = 6 independent experiments.
Figure 5
Figure 5. APT2 ß tongue mutants undergo ubiquitination on Lys-69.
a. Ribbon diagram of membrane-bound APT2. b. HeLa cells expressing WT or mutant APT2 for 24 h were lysed and immunoprecipitated with anti-myc agarose beads overnight. Protein extracts (40 µg) and immunoprecipitated products were separated via SDS-PAGE and analyzed by immunoblotting with anti-myc or anti-ubiquitin antibodies. Tubulin was blotted as a loading control. c. HeLa cells were silenced for 3 days with APT2 siRNA and were transfected with plasmids encoding myc-tagged WT ZDHHC6 and the indicated APT2 constructs for 24 h. Cells were incubated for 4 h with MG132, then metabolically labeled for 2 h at 37°C with H-palmitic acid and chased for 3 h in fresh medium. Proteins were extracted, immunoprecipitated with anti-myc antibodies, subjected to SDS-PAGE, immunoblotted with anti-myc antibodies, and analyzed by autoradiography (H-palm). The total extracts (40 µg) were immunoblotted with anti-myc antibodies to detect WT and mutant APT2. d. Quantification of H-palmitic acid incorporation into ZDHHC6 in the presence of different APT2 mutants. Values were normalized to protein expression level. The calculated value of H-palmitic acid incorporation into ZDHHC6 with WT APT2 was set to 100%, and the mutants were expressed relative to this (results are meaneSD, n = 3 independent experiments).
Figure 6
Figure 6. Identification of an acyl chain binding pocket in APTs.
a. Close-up view of the hydrophobic channel of APT1 containing palmitic acid in van der Waals representation. Side-chain of residues forming the hydrophobic cavity are shown as blue sticks. b. Analysis of the ligands associated with purified APT1 enzyme detected by Q-TOF-MS. The y-axes represent negative-ion count for selected masses of anion in forms of fatty acid. The top panel depicts the binding of the 4 fatty acid standards: lauric acid (green), myristic acid (orange), palmitic acid (blue) and oleic acid (red). The bottom panel depicts binding of C16:0 by APT1. c. Close-up view of the hydrophobic channel of APT2 with ML349 in van der Waals representation. d. The thioesterase activity of the APT2 hydrophobic pocket mutants was determined at 60 min after the addition of substrate and detergent. The APT2-specific inhibitor ML349 was included as a positive control. Technical replicates were averaged within each experiment, and each experiment was then normalized to WT. The average of each experiment was graphed. Two-tailed two-sample unequal variance t-tests were performed on the raw values normalized to the plate, results are mean-SD, n = 3 independent experiments. e. MD-averaged membrane-thickness. In white is the space explored by the protein during the simulation. h. Averaged phosphate Z-coordinates for the APT-bound and APT-unbound states. The dashed line highlights the membrane bound region explored by APT during the simulation.

Comment in

References

    1. Khoury GA, Baliban RC, Floudas CA. Proteome-wide post-translational modification statistics: frequency analysis and curation of the swiss-prot database. Sci Rep. 2011;1 - PMC - PubMed
    1. Blanc M, David FPA, van der Goot FG. SwissPalm 2: Protein S-Palmitoylation Database. Methods Mol Biol. 2019;2009:203–214. - PubMed
    1. Gadalla MR, Veit M. Toward the identification of ZDHHC enzymes required for palmitoylation of viral protein as potential drug targets. Expert Opinion on Drug Discovery. 2020;15:159–177. - PubMed
    1. Brown RWB, Sharma AI, Engman DM. Dynamic protein S-palmitoylation mediates parasite life cycle progression and diverse mechanisms of virulence. Crit Rev Biochem Mol Biol. 2017;52:145–162. - PMC - PubMed
    1. Zaballa M-E, van der Goot FG. The molecular era of protein S-acylation: spotlight on structure, mechanisms, and dynamics. Crit Rev Biochem Mol Biol. 2018;53:420–451. - PubMed

Publication types

LinkOut - more resources