

Use of a convolutional neural network to identify infarct core using computed tomography perfusion parameters
- PMID: 33707811
- PMCID: PMC7946163
- DOI: 10.1117/12.2579753
Use of a convolutional neural network to identify infarct core using computed tomography perfusion parameters
Abstract
Purpose: Computed tomography perfusion (CTP) is used to diagnose ischemic strokes through contralateral hemisphere comparisons of various perfusion parameters. Various perfusion parameter thresholds have been utilized to segment infarct tissue due to differences in CTP software and patient baseline hemodynamics. This study utilized a convolutional neural network (CNN) to eliminate the need for non-universal parameter thresholds to segment infarct tissue.
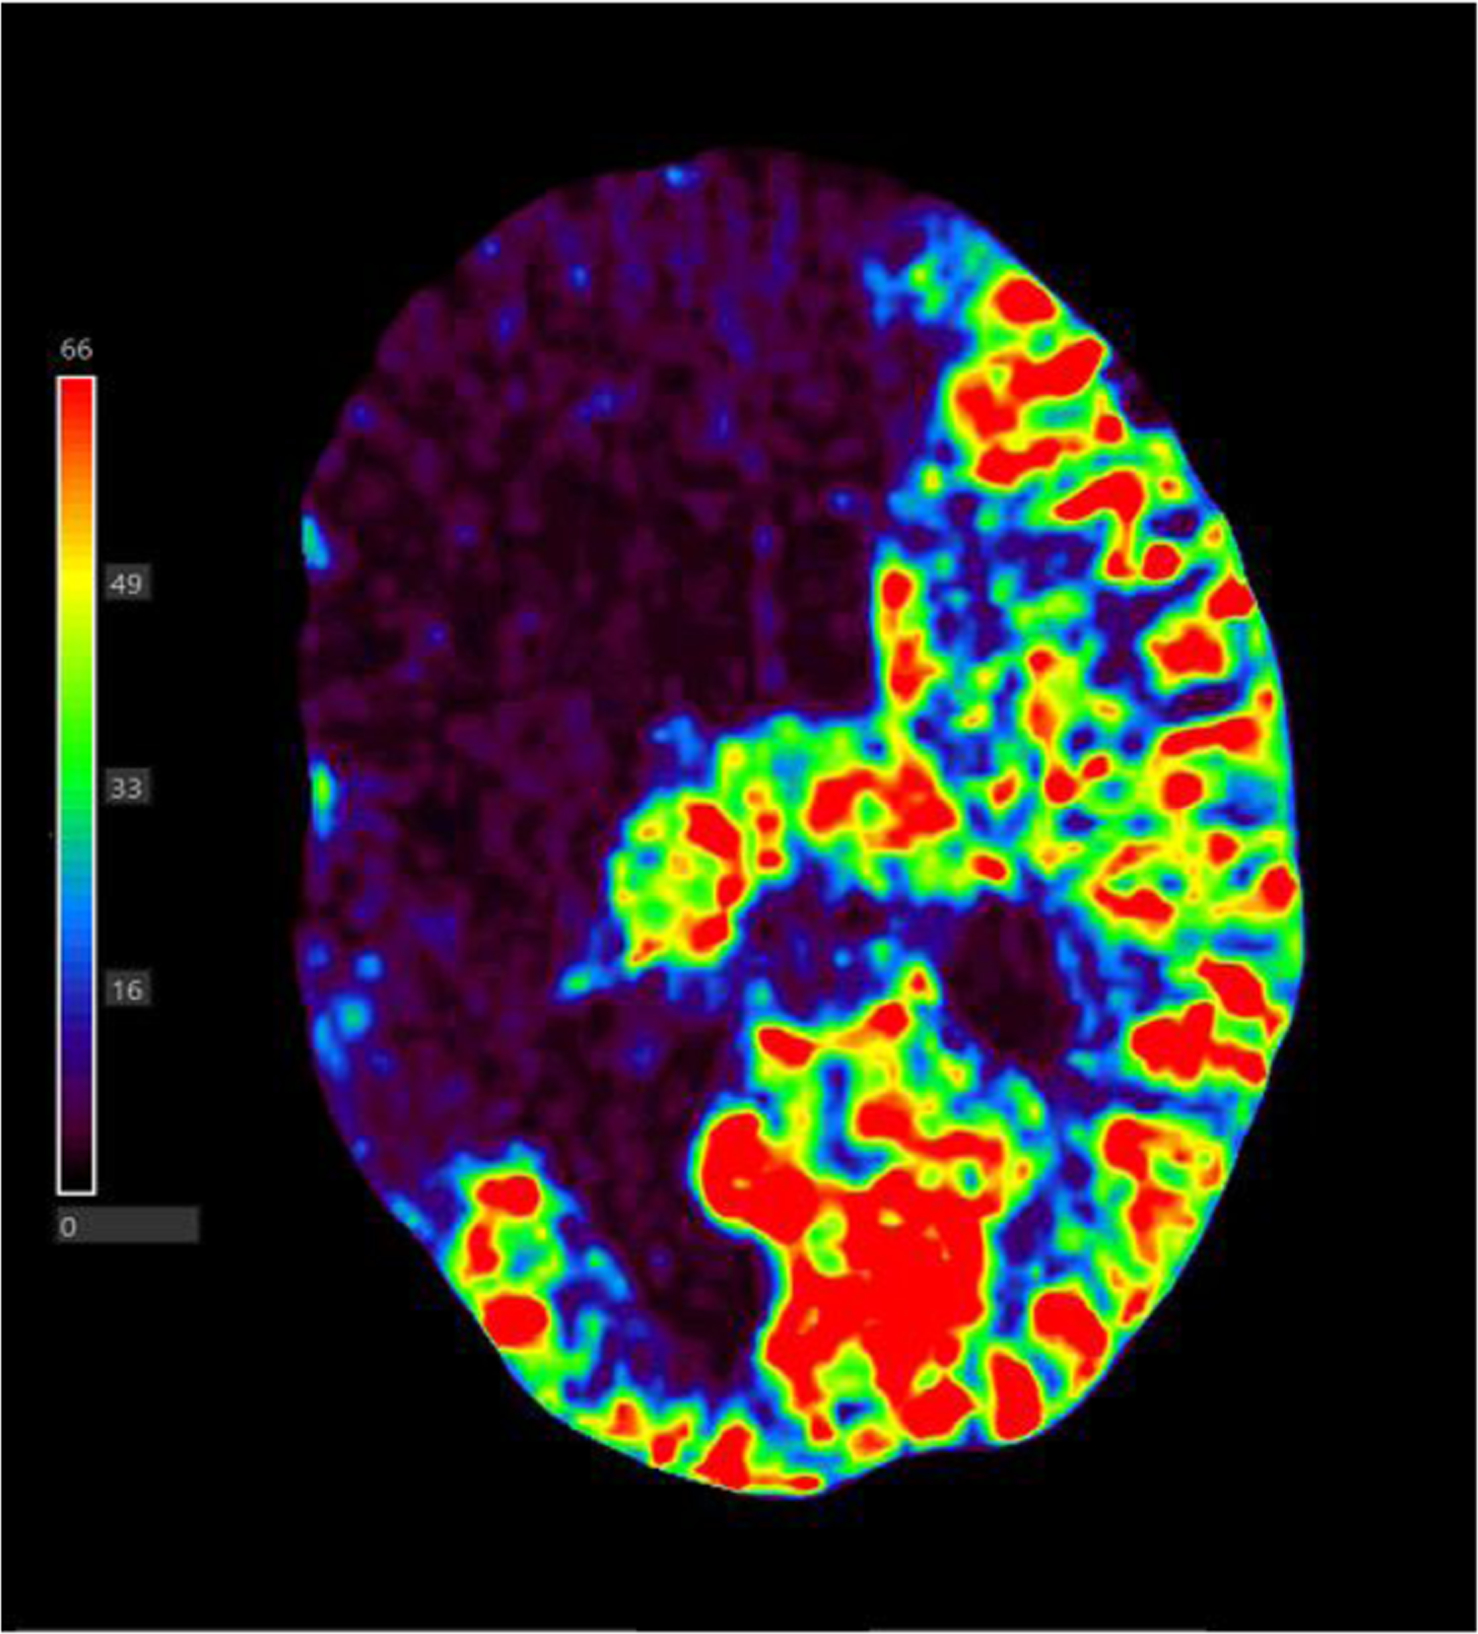
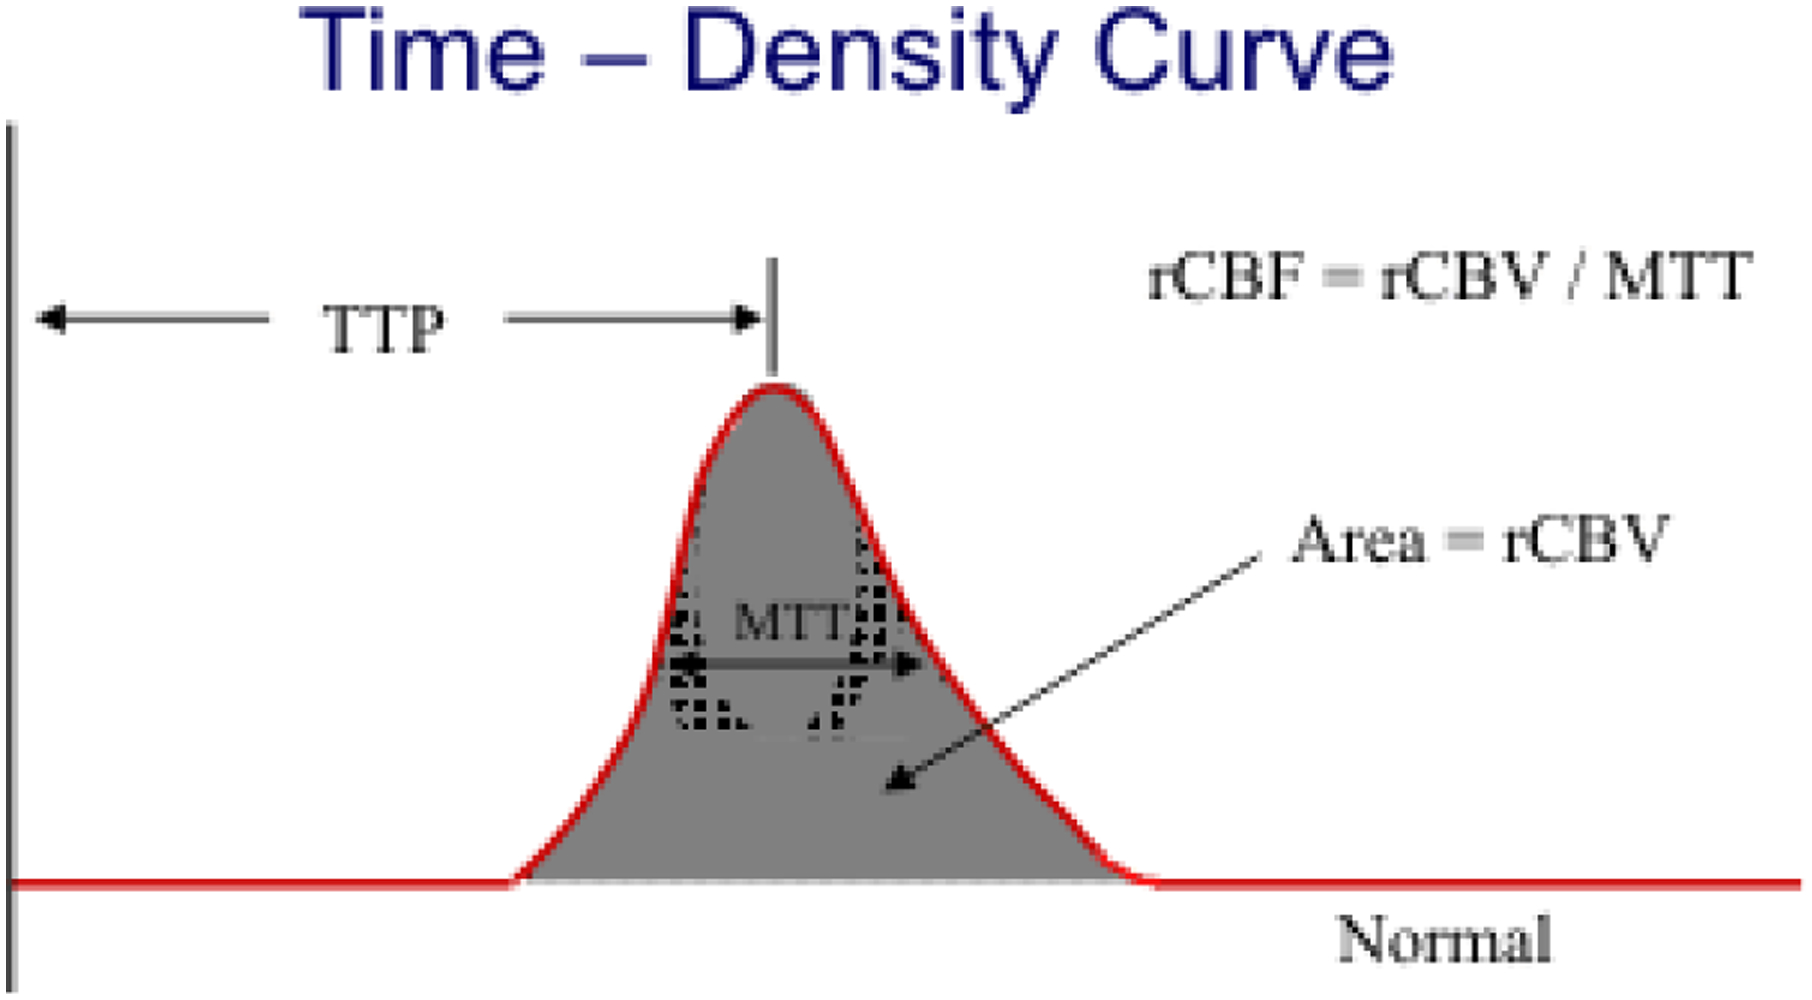
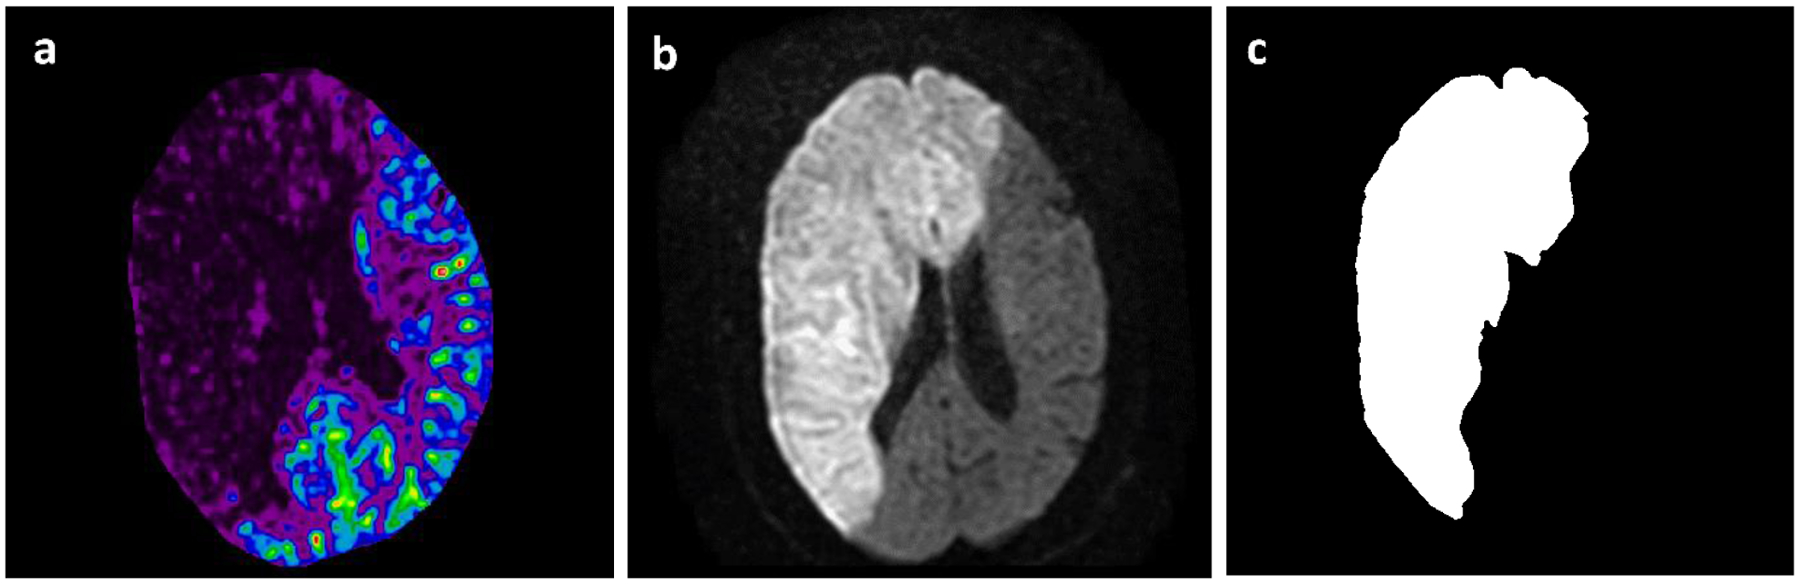
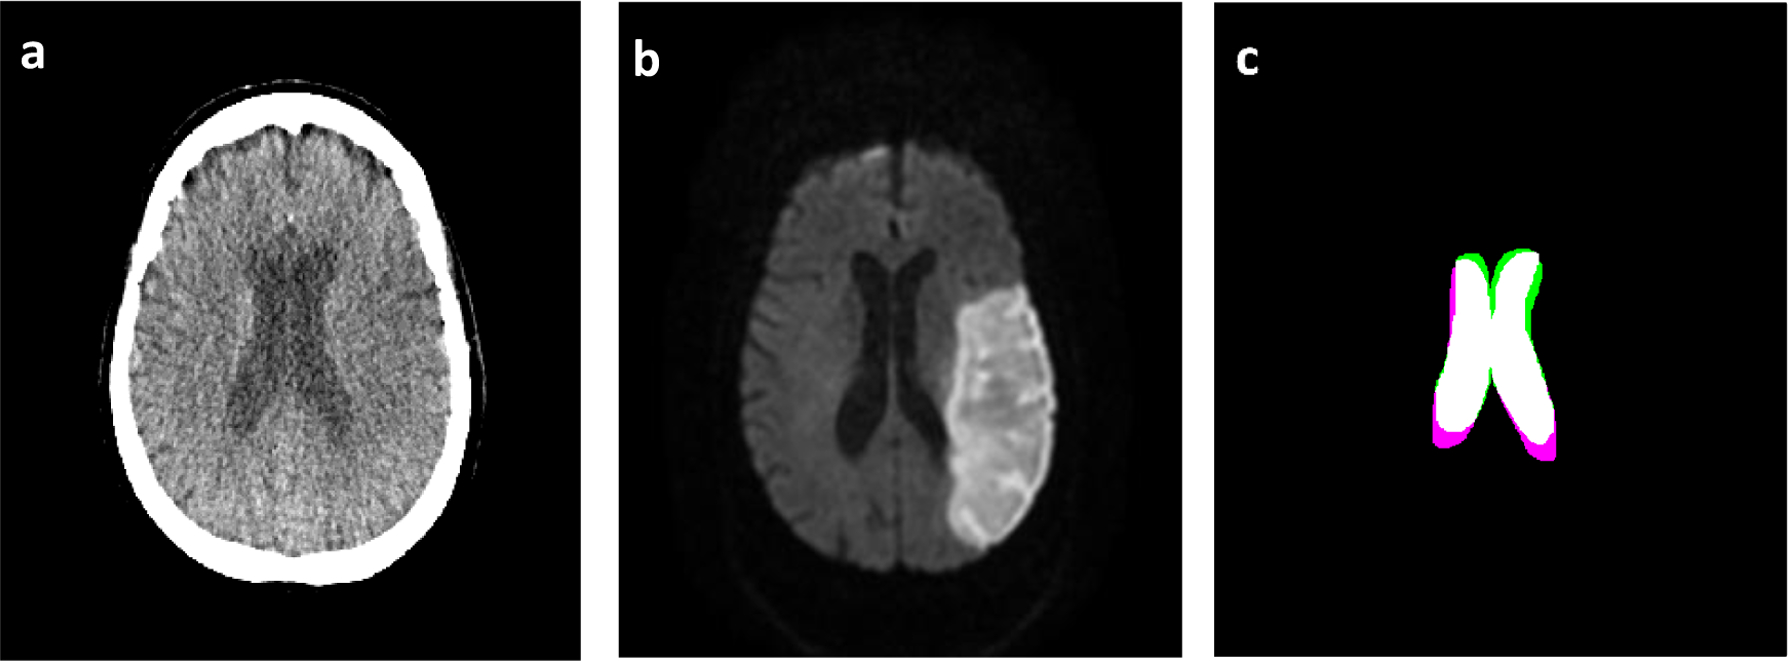
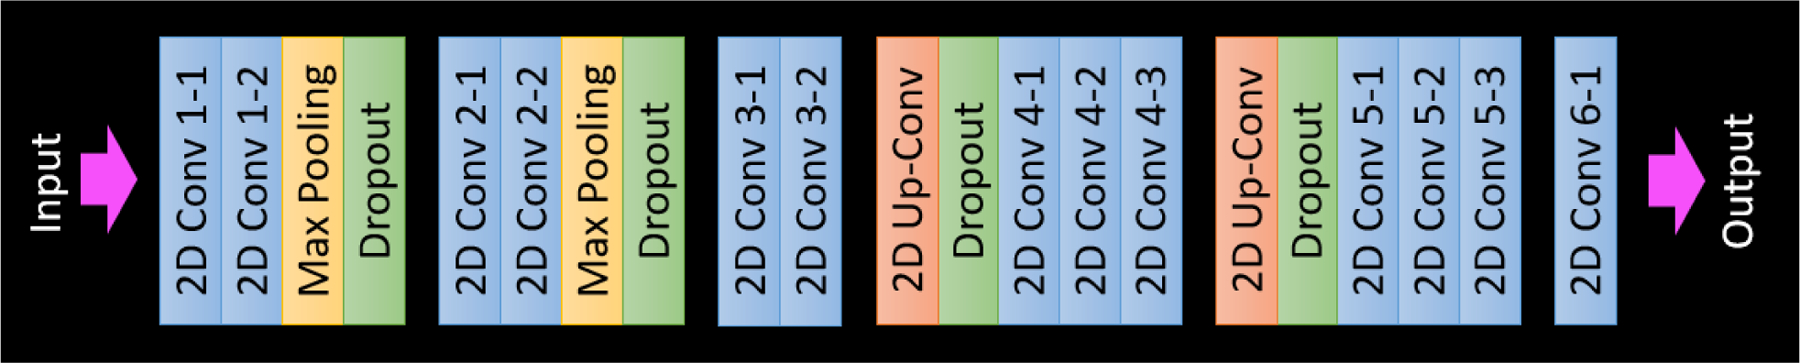
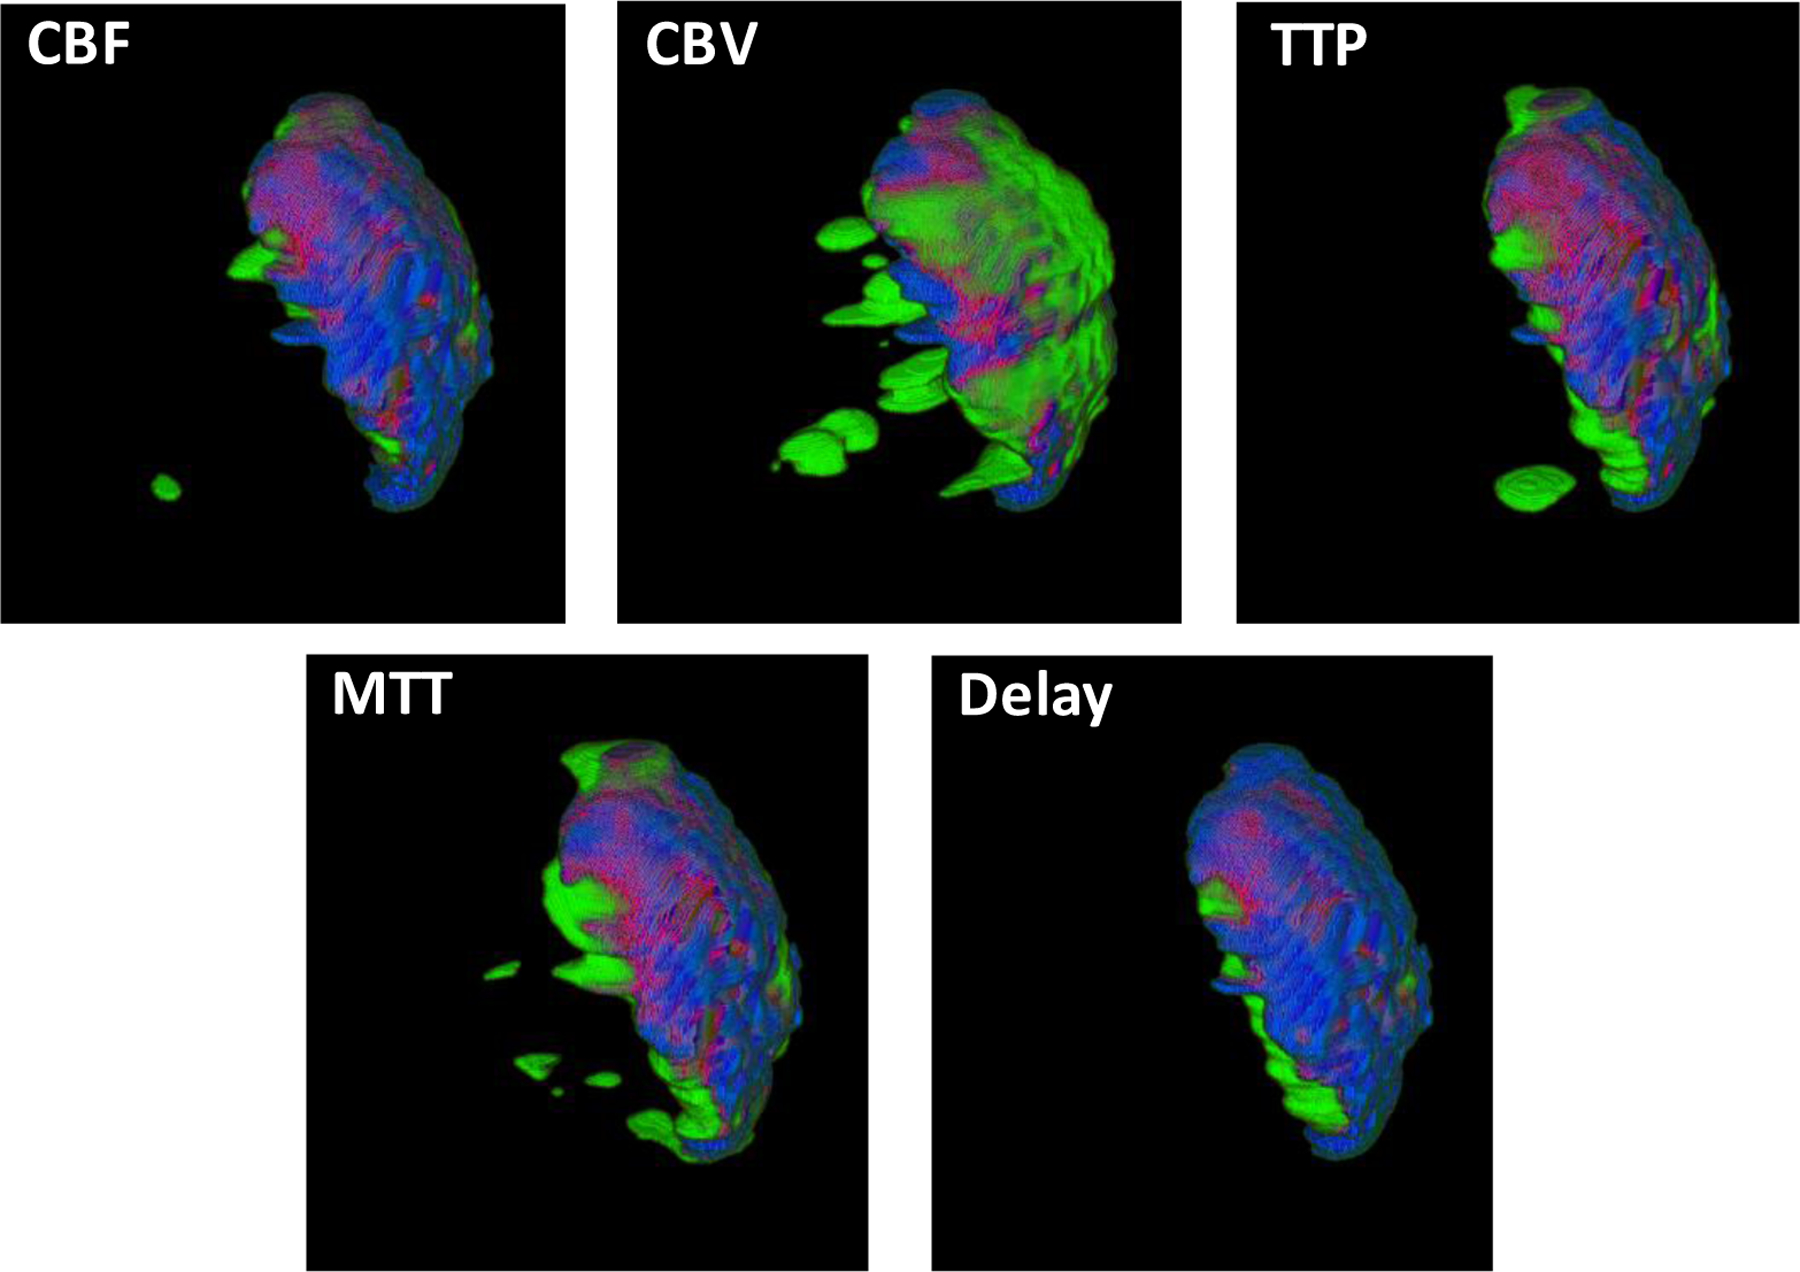
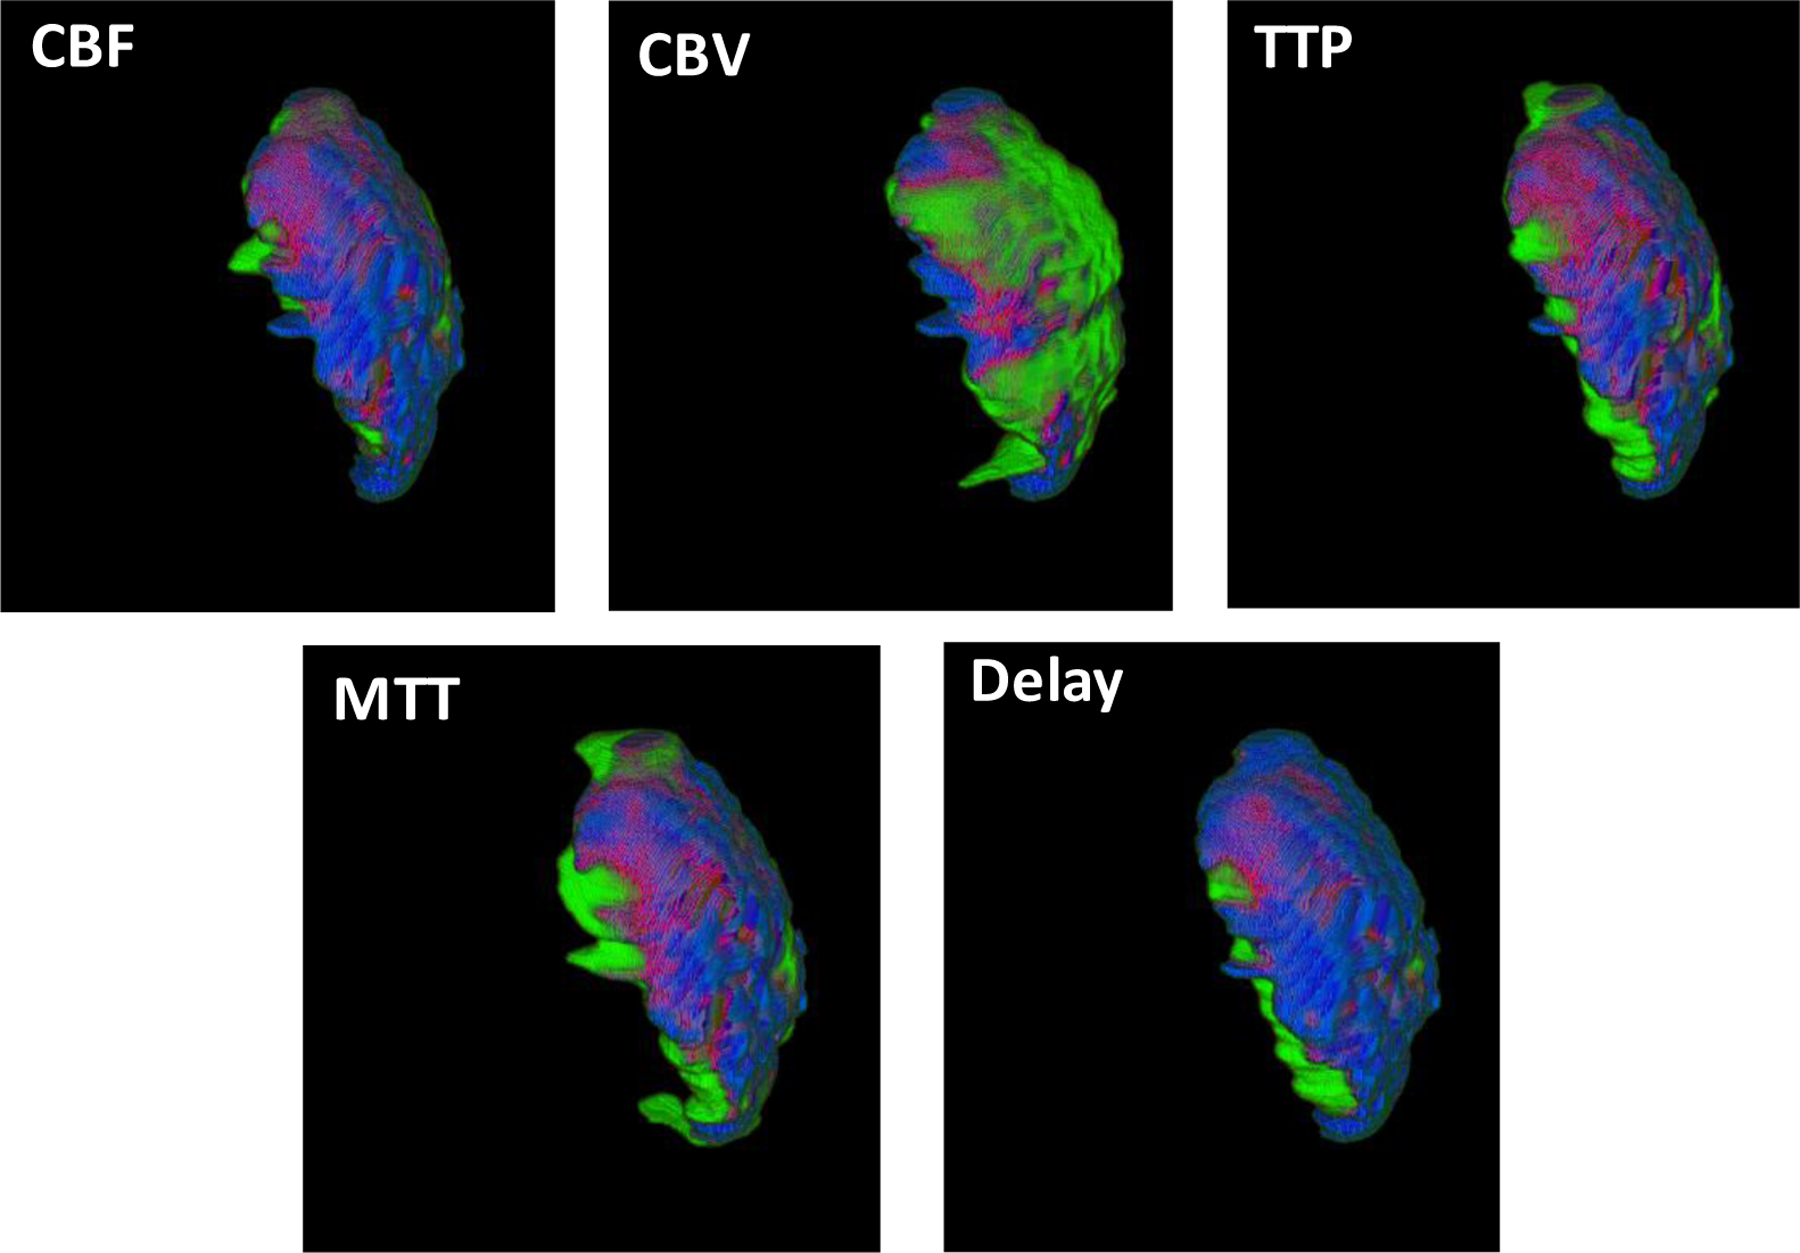
Methods: CTP data from 63 ischemic stroke patients was retrospectively collected and perfusion parameter maps were generated using Vitrea CTP software. Infarct ground truth labels were segmented from diffusion-weighted imaging (DWI) and CTP and DWI volumes were registered. A U-net based CNN was trained and tested five separate times using each CTP parameter (cerebral blood flow (CBF), cerebral blood volume (CBV), time-to-peak (TTP), mean-transit-time (MTT), delay time). 8,352 infarct slices were utilized with a 60:30:10 training:testing:validation split and Monte Carlo cross-validation was conducted using 20 iterations. Infarct volumes were reconstructed following segmentation from each CTP slice. Infarct spatial and volumetric agreement was compared between each CTP parameter and DWI.
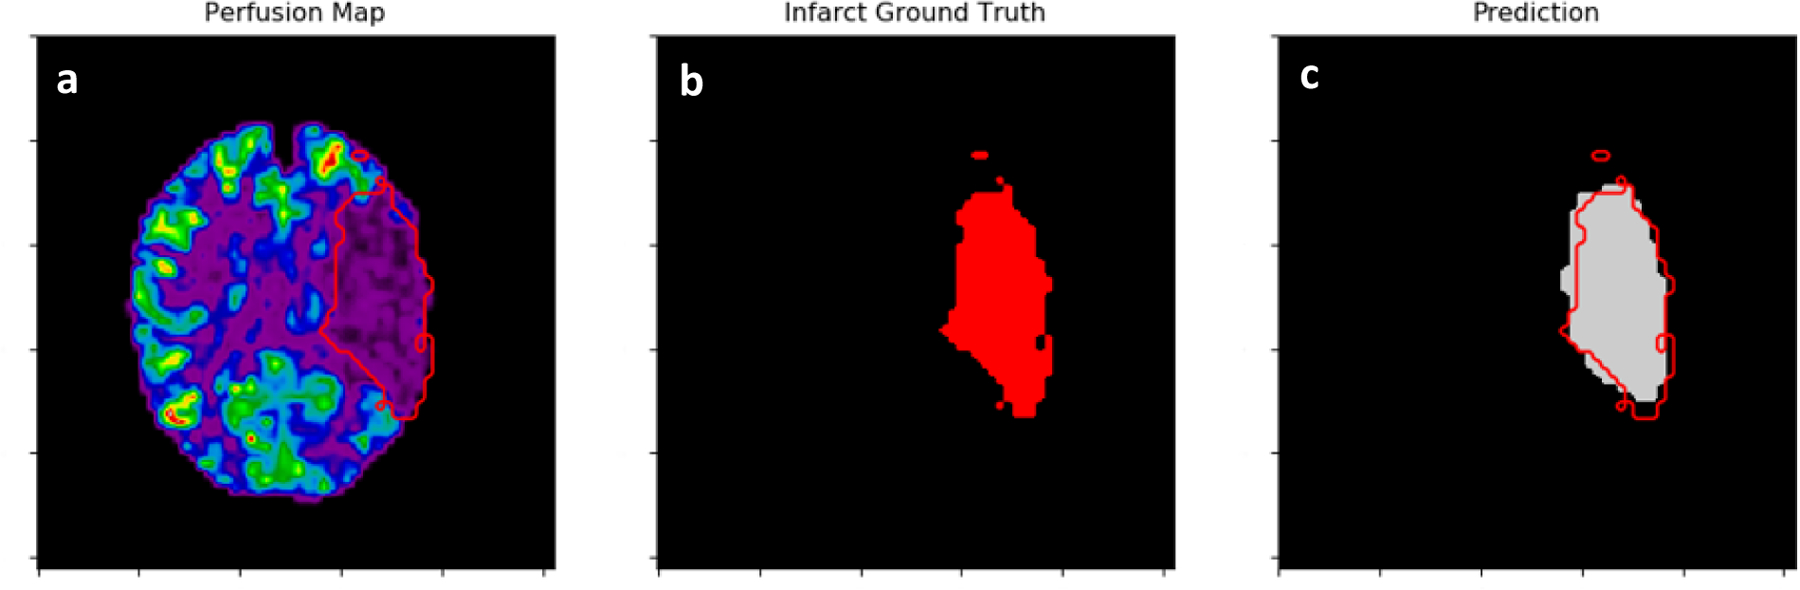
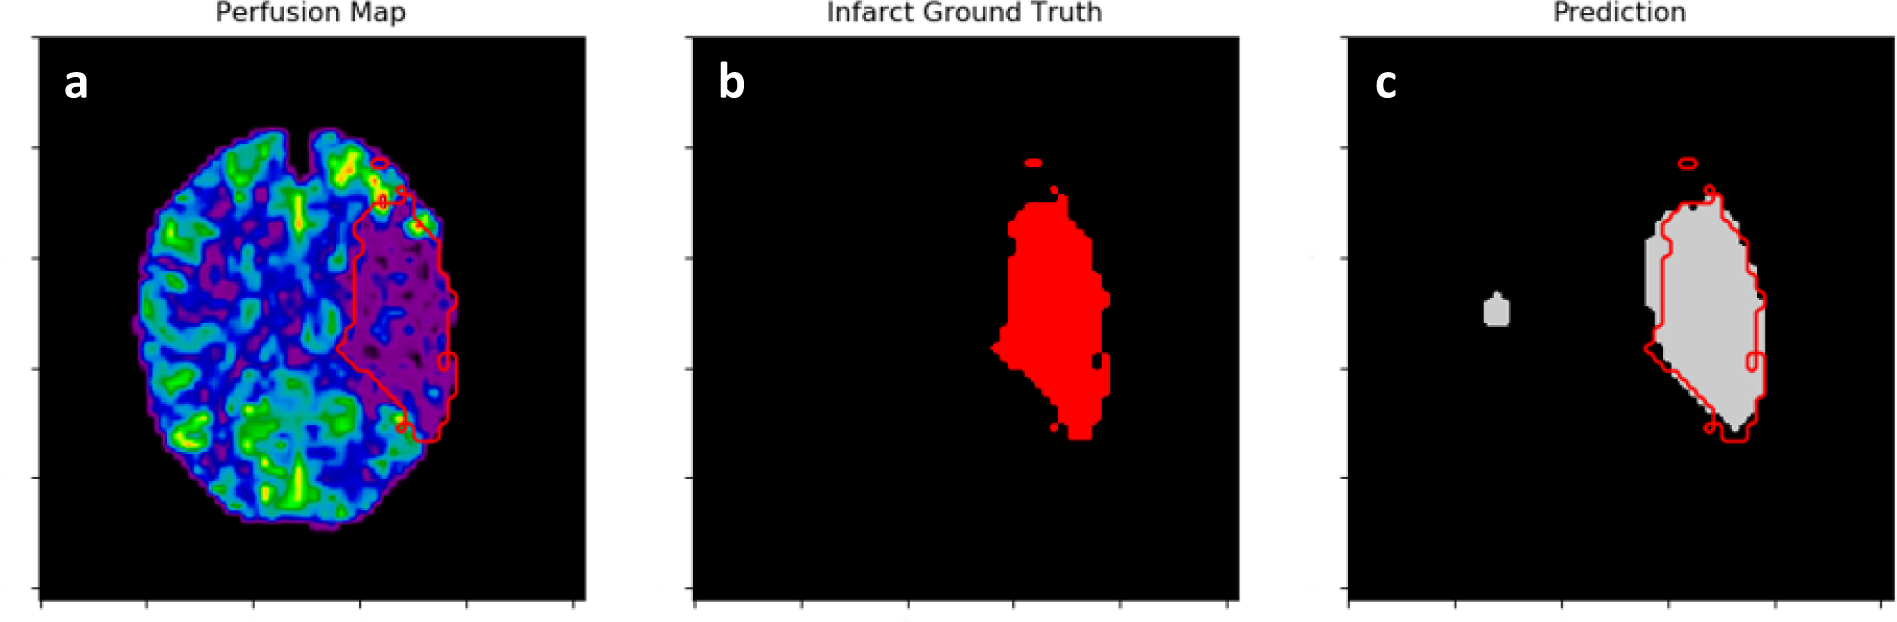
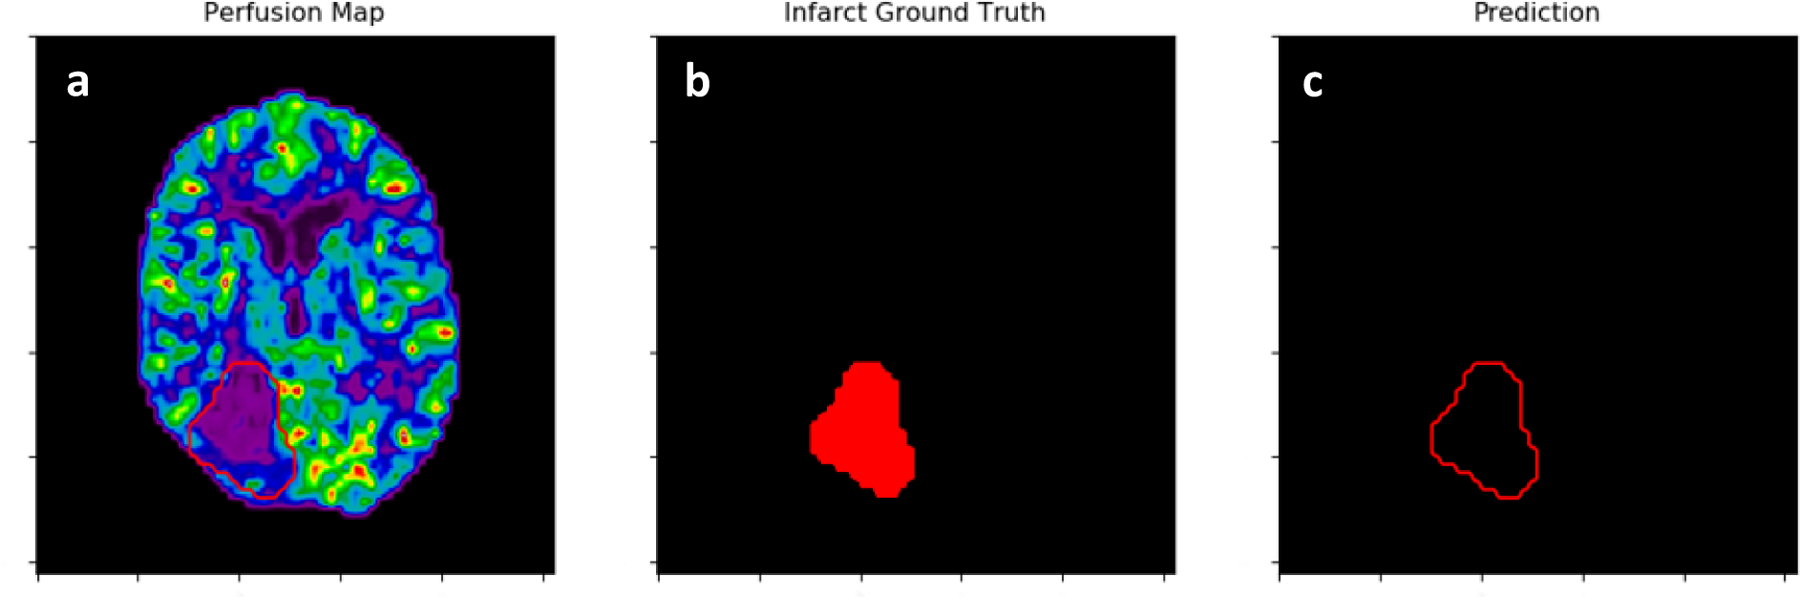
Results: Spatial agreement metrics (Dice coefficient, positive predictive value) for each CTP parameter in predicting infarct volumes are: CBF=(0.67, 0.76), CBV=(0.44, 0.62), TTP=(0.60, 0.67), MTT=(0.58, 0.62), delay time=(0.57, 0.60). 95% confidence intervals for volume differences with DWI infarct are: CBF=14.3±11.5 mL, CBV=29.6±21.2 mL, TTP=7.7±15.2 mL, MTT=-10.7±18.6 mL, delay time=-5.7±23.6 mL.
Conclusions: CBF is the most accurate CTP parameter in segmenting infarct tissue. Segmentation of infarct using a CNN has the potential to eliminate non-universal CTP contralateral hemisphere comparison thresholds.
Keywords: Computed tomography perfusion; cerebral infarct tissue; convolutional neural network; semantic segmentation.
Figures
Similar articles
-
Investigation of convolutional neural networks using multiple computed tomography perfusion maps to identify infarct core in acute ischemic stroke patients.J Med Imaging (Bellingham). 2021 Jan;8(1):014505. doi: 10.1117/1.JMI.8.1.014505. Epub 2021 Feb 10. J Med Imaging (Bellingham). 2021. PMID: 33585662 Free PMC article.
-
Quantifying infarct core volume in ischemic stroke: What is the optimal threshold and parameters of computed tomography perfusion?J Stroke Cerebrovasc Dis. 2023 Jun;32(6):107062. doi: 10.1016/j.jstrokecerebrovasdis.2023.107062. Epub 2023 Mar 20. J Stroke Cerebrovasc Dis. 2023. PMID: 36948076
-
Limited reliability of computed tomographic perfusion acute infarct volume measurements compared with diffusion-weighted imaging in anterior circulation stroke.Stroke. 2015 Feb;46(2):419-24. doi: 10.1161/STROKEAHA.114.007117. Epub 2014 Dec 30. Stroke. 2015. PMID: 25550366 Free PMC article.
-
CT perfusion in stroke: Comparing conventional and RAPID automated software.Curr Probl Diagn Radiol. 2024 Mar-Apr;53(2):201-207. doi: 10.1067/j.cpradiol.2023.10.011. Epub 2023 Oct 22. Curr Probl Diagn Radiol. 2024. PMID: 37891080 Review.
-
Basis and current state of computed tomography perfusion imaging: a review.Phys Med Biol. 2022 Sep 7;67(18). doi: 10.1088/1361-6560/ac8717. Phys Med Biol. 2022. PMID: 35926503 Review.
Cited by
-
Investigation of convolutional neural networks using multiple computed tomography perfusion maps to identify infarct core in acute ischemic stroke patients.J Med Imaging (Bellingham). 2021 Jan;8(1):014505. doi: 10.1117/1.JMI.8.1.014505. Epub 2021 Feb 10. J Med Imaging (Bellingham). 2021. PMID: 33585662 Free PMC article.
-
Agreement between estimated computed tomography perfusion ischemic core and follow-up infarct on diffusion-weighted imaging.Insights Imaging. 2022 Dec 13;13(1):191. doi: 10.1186/s13244-022-01334-0. Insights Imaging. 2022. PMID: 36512159 Free PMC article.
-
Validation of an artificial intelligence-driven large vessel occlusion detection algorithm for acute ischemic stroke patients.Neuroradiol J. 2021 Oct;34(5):408-417. doi: 10.1177/1971400921998952. Epub 2021 Mar 3. Neuroradiol J. 2021. PMID: 33657922 Free PMC article.
-
Identification of infarct core and ischemic penumbra using computed tomography perfusion and deep learning.J Med Imaging (Bellingham). 2023 Jan;10(1):014001. doi: 10.1117/1.JMI.10.1.014001. Epub 2023 Jan 9. J Med Imaging (Bellingham). 2023. PMID: 36636489 Free PMC article.
References
-
- Benjamin EJ, Muntner P, and Bittencourt MSJC, “Heart disease and stroke statistics-2019 update: a report from the American Heart Association,” 139(10), e56–e528 (2019). - PubMed
-
- Mozaffarian D et al., “Heart disease and stroke statistics-2016 update a report from the American Heart Association,” Circulation 133(4), e38–e48 (2016). - PubMed
-
- Dani KA et al., “Computed tomography and magnetic resonance perfusion imaging in ischemic stroke: definitions and thresholds,” Annals of neurology 70(3), 384–401 (2011). - PubMed
-
- Goyal M, Menon BK, and Derdeyn CP, “Perfusion imaging in acute ischemic stroke: let us improve the science before changing clinical practice,” Radiology 266(1), 16–21 (2013). - PubMed
-
- Mokin M et al., “Endovascular treatment of acute ischemic stroke: the end or just the beginning?,” Neurosurgical focus 36(1), E5 (2014). - PubMed
Grants and funding
LinkOut - more resources
Full Text Sources
Other Literature Sources