. 2020 Oct 22;30(43):2004307.
doi: 10.1002/adfm.202004307. Epub 2020 Sep 6.

Injectable Drug-Releasing Microporous Annealed Particle Scaffolds for Treating Myocardial Infarction

Affiliations

Injectable Drug-Releasing Microporous Annealed Particle Scaffolds for Treating Myocardial Infarction

Jun Fang et al. Adv Funct Mater. .

Abstract

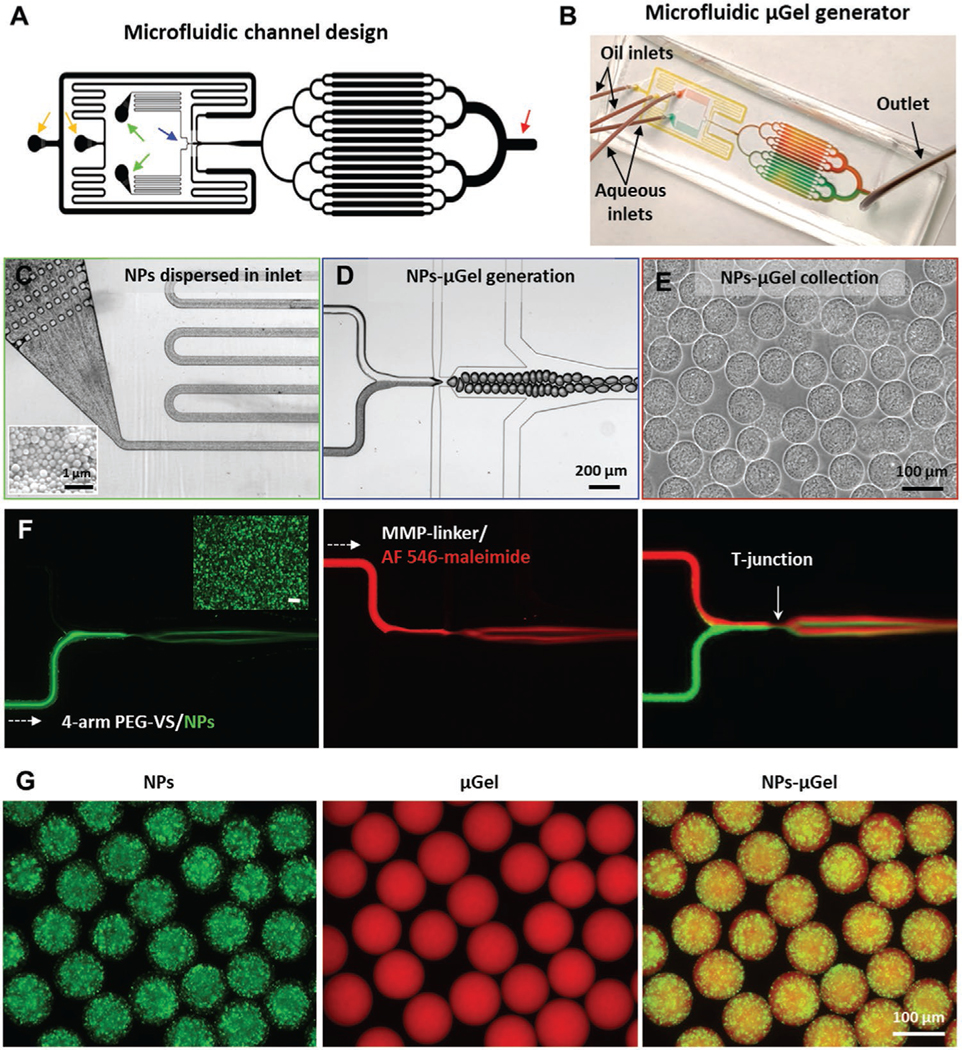
Intramyocardial injection of hydrogels offers great potential for treating myocardial infarction (MI) in a minimally invasive manner. However, traditional bulk hydrogels generally lack microporous structures to support rapid tissue ingrowth and biochemical signals to prevent fibrotic remodeling toward heart failure. To address such challenges, a novel drug-releasing microporous annealed particle (drugMAP) system is developed by encapsulating hydrophobic drug-loaded nanoparticles into microgel building blocks via microfluidic manufacturing. By modulating nanoparticle hydrophilicity and pregel solution viscosity, drugMAP building blocks are generated with consistent and homogeneous encapsulation of nanoparticles. In addition, the complementary effects of forskolin (F) and Repsox (R) on the functional modulations of cardiomyocytes, fibroblasts, and endothelial cells in vitro are demonstrated. After that, both hydrophobic drugs (F and R) are loaded into drugMAP to generate FR/drugMAP for MI therapy in a rat model. The intramyocardial injection of MAP gel improves left ventricular functions, which are further enhanced by FR/drugMAP treatment with increased angiogenesis and reduced fibrosis and inflammatory response. This drugMAP platform represents a new generation of microgel particles for MI therapy and will have broad applications in regenerative medicine and disease therapy.

Keywords: drug delivery; granular hydrogels; microgels; myocardial infarction; tissue engineering.


Conflict of interest statement

Conflict of Interest Jun Fang, Jaekyung Koh, Dino Di Carlo and Song Li have applied for a patent related to this study. Dino Di Carlo have financial interests in Tempo Therapeutics. The remaining authors declare no competing interests.

Figures

Figure 1.
Figure 1.
Scheme illustrating the microfluidic generation of drug-releasing MAP (drugMAP) scaffolds for MI therapy. A) Microfluidic generation of drugMAP building blocks by encapsulating drug/NPs into μGel beads to generate drug/NPs-μGel beads in a microfluidic device. The hydrogels are formed by crosslinking pregel solutions via thiol-ene reactions to encapsulate NPs in the gel mesh. B) Injection of cardiac drugMAP scaffolds for MI therapy. Via delivery of specific drugs, the cardiac drugMAP scaffolds endow pleiotropic benefits for heart repair.
Figure 2.
Figure 2.
Preparation of drugMAP building blocks. A) Microfluidic channel design for μGel generator. The yellow arrows denote oil inlets. The green arrows denote aqueous inlets. The blue arrow denotes droplet generation region, and the red arrow denotes droplet collection region. B) Photograph of the microfluidic device of μGel generator, channels are highlighted with colored dye solutions. C) PEG-VS pregel solution with dispersed nanoparticles (NPs) flows stably through the inlet filters. Insert image in the lower-left corner is a representative SEM image of PLGA-based NPs. D) Homogeneous droplets containing pregel solution and crosslinker formed at a flow focusing junction of the microfluidic channel. E) NPs-μGel beads with a uniform NP distribution collected at the outlet region. F) Fluorescence images of droplets generated with fluorescent-labeled aqueous solutions, one aqueous channel with coumarin-6 (green) labeled NPs with 4-arm PEG-VS pregel solution and another aqueous channel with AF 546-maleimide (red) with MMP-sensitive crosslinker solution. G) Representative fluorescent images of NPs-μGel beads made under optimized processing conditions, with NPs distributed uniformly in μGel.
Figure 3.
Figure 3.
Characterization of drugMAP building blocks and annealed scaffolds. A) Generation of NPs-μGel beads with highly defined sizes by altering the aqueous flow rate. B) NPs-μGel beads, made with an aqueous flow rate of 8 μL min−1, and swollen in buffer after aqueous extraction from the oil phase. Qv represents the volumetric swelling ratio of a bead. C) Representative images of NPs-μGel beads loaded with increasing amounts of NPs. The numbers in brackets represent the weight percentages of the NPs to dry pregel components. D) Nanoparticle loading efficiency in different NP-μGel beads as a function of wt%. E) Nanoparticle loading concentration in NPs-μGel beads as a function of initial concentration. F) Microporous drugMAP scaffolds generated by annealing NPs-μGel beads using FXIIIa. G) Pore size and void fraction of MAP and drugMAP scaffolds. H) Storage moduli of bulk hydrogels mixed with different amounts of NPs. Data are shown as mean ± SD. *p < 0.05, NS represents no significant difference.
Figure 4.
Figure 4.
In vitro cellular evaluations of drugs and drugMAP gels. A) The summarized drug effects of forskolin (F), Repsox (R), and FR on various cardiac remodeling-associated cells. Sign + represents a positive effect, and sign – represents a negative effect. B) Cumulative drug release profiles from FR/NPs (FR loaded NPs) and FR/drugMAP (F and R loaded drugMAP gel). C) Live and dead staining of neonatal cardiomyocytes cultured in the indicated conditions on day 3, and D) cell viability of neonatal cardiomyocytes. E) Myo-differentiation of neonatal cardiac fibroblasts cultured in the indicated conditions on day 5, and F) mean fluorescent intensity of α-SMA in (E). G) Representative fluorescent images of vascular network formation. Human umbilical vein endothelial cells (HUVECs) are cultured at the indicated conditions for 16 h and stained with Calcein-AM. H) Quantification of junction numbers, tube numbers and mesh numbers. Data are shown as mean ± SD. *p < 0.05 and **p < 0.01 indicate comparisons to blank. ##p < 0.01 indicates comparisons to R condition. NS represents no significant difference.
Figure 5.
Figure 5.
Cardiac functional assessment in the rat acute MI model. A) Representative Masson’s trichrome-stained sections of infarcted rat hearts after 5 weeks treatment with PBS, FR/NPs, MAP gel and FR/drugMAP gel. (Bottom) High-magnification views of the infarcted zones. B) Quantitative analyses of infarcted size (as % of the total LV area). C) Quantitative analyses of infarcted minimum LV wall thickness. D) LVEDV and E) LVESV of infarcted hearts measured by echocardiography at 5 weeks. E) LV ejection fraction (EF) of infarcted hearts at day 2 (baseline) and week 5 after treatment. G) Change in LVEF in comparison to baseline (ΔLVEF). Data are shown as mean ± SD. PBS (n = 9), FR/NPs (n = 6), MAP (n = 9) and FR/drugMAP gel (n = 9). *p < 0.05 and **p < 0.01 indicate significant difference in comparison to the PBS control group. #p < 0.05 and ##p < 0.01 in (F) indicate comparisons of 5 week treated group to the corresponding baseline. NS represents no significant difference.
Figure 6.
Figure 6.
DrugMAP promotes angiogenesis and reduces inflammatory response in MI therapy. A) Representative images of angiogenesis staining with α-SMA (green) and vWF (magenta) in the central infarct LV zone of hearts treated with PBS, FR/NPs, MAP, and FR/drugMAP gel at 5 weeks. Microgel beads were labeled by AF546 dye (red) for material tracking. B) Representative images of macrophage staining with CD68 (green). Quantification of C) capillary density (vWF+ vessels), D) arteriolar density (α-SMA+ vessels) and E) macrophage density in the central infarct LV zone of hearts treated with PBS (n = 9), FR/NPs (n = 6), MAP (n = 9), and FR/drugMAP (n = 9) at 5 weeks. Data are shown as mean ± SD. *p < 0.05 and **p < 0.01 indicate significant difference in comparison to PBS control group.

References

    1. Nowbar AN, Gitto M, Howard JP, Francis DP, Al-Lamee R, Circ. Cardiovasc. Qual. Outcomes 2019, 12, e005375. - PMC - PubMed
    1. Hausenloy DJ, Yellon DM, Nat. Rev. Cardiol 2016, 13, 193. - PubMed
    1. Anderson JL, Morrow DA, Engl N. J. Med 2017, 376, 2053. - PubMed
    1. Rodgers K, Papinska A, Mordwinkin N, Adv. Drug Delivery Rev 2016, 96, 245; - PubMed
    2. Cahill TJ, Choudhury RP, Riley PR, Nat. Rev. Drug Discovery 2017, 16, 699. - PubMed
    1. Hasan A, Khattab A, Islam MA, Abou Hweij K, Zeitouny J, Waters R, Sayegh M, Hossain MM, Paul A, Adv. Sci 2015, 2, 2198; - PMC - PubMed
    2. Seif-Naraghi SB, Singelyn JM, Salvatore MA, Osborn KG, Wang JJ, Sampat U, Kwan OL, Strachan GM, Wong J, Schup-Magoffin PJ, Braden RL, Bartels K, DeQuach JA, Preul M, Kinsey AM, DeMaria AN, Dib N, Christman KL, Sci. Transl. Med 2013, 5, 173ra25; - PMC - PubMed
    3. Carlini AS, Gaetani R, Braden RL, Luo C, Christman KL, Gianneschi NC, Nat. Commun 2019, 10, 1735; - PMC - PubMed
    4. Matsumura Y, Zhu Y, Jiang HB, D’Amore A, Luketich SK, Charwat V, Yoshizumi T, Sato H, Yang B, Uchibori T, Healy KE, Wagner WR, Biomaterials 2019, 217, 119289. - PubMed