

Hemolysis Pathways during Storage of Erythrocytes and Inter-Donor Variability in Erythrocyte Morphology
- PMID: 33708051
- PMCID: PMC7923927
- DOI: 10.1159/000508711
Hemolysis Pathways during Storage of Erythrocytes and Inter-Donor Variability in Erythrocyte Morphology
Abstract
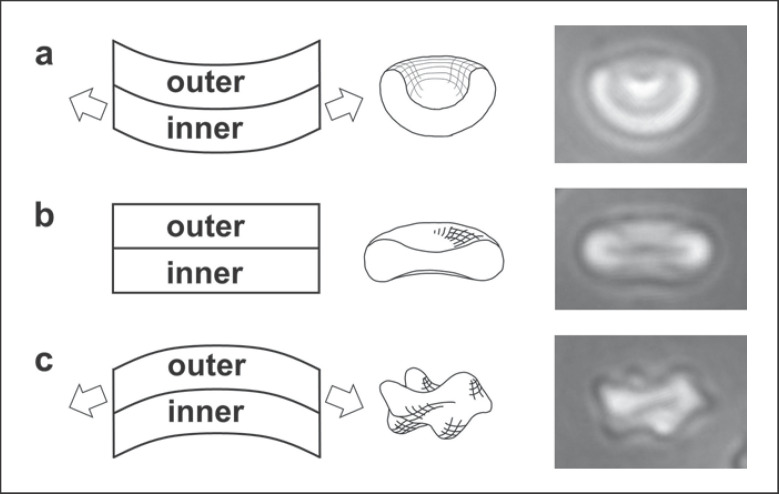
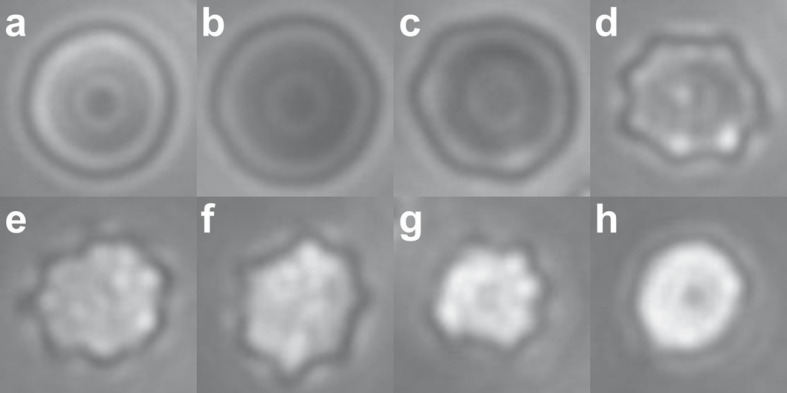
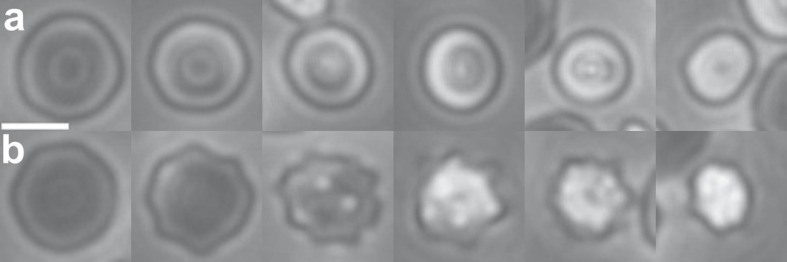
Background: Red blood cells (RBCs) stored for transfusions can lyse over the course of the storage period. The lysis is traditionally assumed to occur via the formation of spiculated echinocyte forms, so that cells that appear smoother are assumed to have better storage quality. We investigate this hypothesis by comparing the morphological distribution to the hemolysis for samples from different donors.
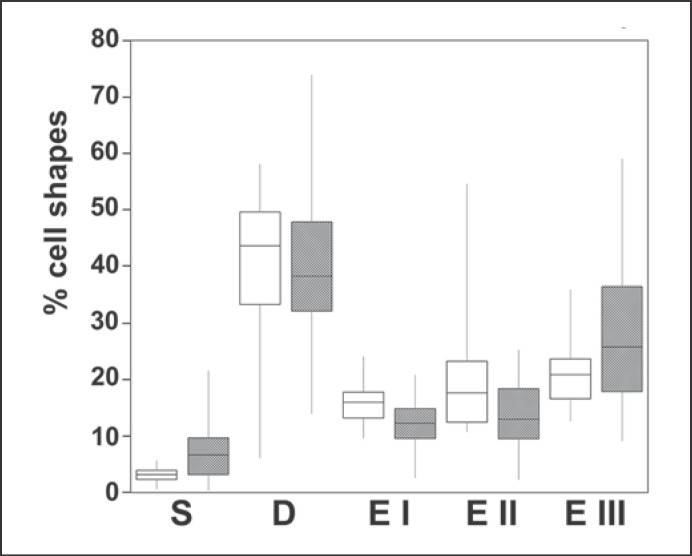
Methods: Red cell concentrates were obtained from a regional blood bank quality control laboratory. Out of 636 units processed by the laboratory, we obtained 26 high hemolysis units and 24 low hemolysis units for assessment of RBC morphology. The association between the morphology and the hemolysis was tested with the Wilcoxon-Mann-Whitney U test.
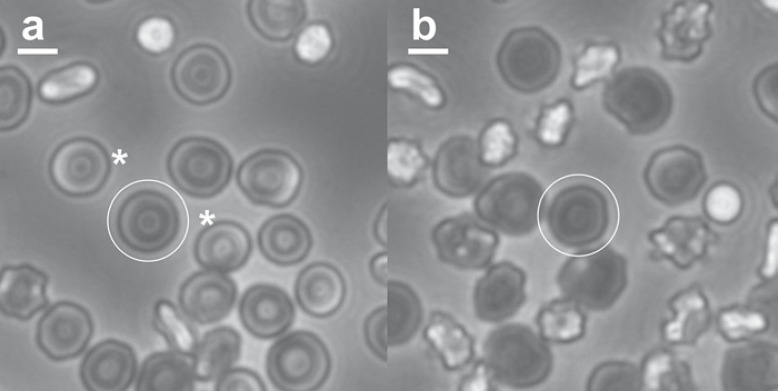
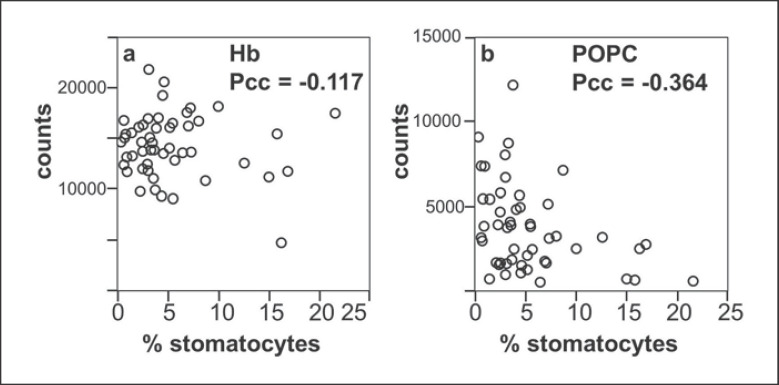
Results: Samples with high stomatocyte counts (p = 0.0012) were associated with increased hemolysis, implying that cells can lyse via the formation of stomatocytes.
Conclusion: RBCs can lyse without significant echinocyte formation. Lower degrees of spiculation are not a good indicator of low hemolysis when RBCs from different donors are compared.
Keywords: Erythrocytes; Hemoglobin; Lipid bilayers; MALDI; Storage.
Copyright © 2020 by S. Karger AG, Basel.
Conflict of interest statement
The authors have no conflicts of interest.
Figures
Similar articles
-
Unbiased Morphometric Assessment of Red Blood Cell Storage Lesion in the Presence of Shear-Induced Stomatocytes.Transfus Med Hemother. 2024 Aug 22;52(3):190-201. doi: 10.1159/000539882. eCollection 2025 Jun. Transfus Med Hemother. 2024. PMID: 40485895 Free PMC article.
-
Hemolysis of red blood cells during processing and storage.Transfusion. 2012 Mar;52(3):489-92. doi: 10.1111/j.1537-2995.2011.03298.x. Epub 2011 Aug 9. Transfusion. 2012. PMID: 21827508
-
Inter-donor variability in deformability of red blood cells in blood units.Transfus Med. 2020 Dec;30(6):492-496. doi: 10.1111/tme.12725. Epub 2020 Oct 4. Transfus Med. 2020. PMID: 33015934
-
The heritability of hemolysis in stored human red blood cells.Transfusion. 2015 Jun;55(6):1178-85. doi: 10.1111/trf.12992. Epub 2015 Feb 2. Transfusion. 2015. PMID: 25644965 Free PMC article.
-
Impact of G6PD status on red cell storage and transfusion outcomes.Blood Transfus. 2019 Jul;17(4):289-295. doi: 10.2450/2019.0092-19. Blood Transfus. 2019. PMID: 31385801 Free PMC article. Review.
Cited by
-
Unbiased Morphometric Assessment of Red Blood Cell Storage Lesion in the Presence of Shear-Induced Stomatocytes.Transfus Med Hemother. 2024 Aug 22;52(3):190-201. doi: 10.1159/000539882. eCollection 2025 Jun. Transfus Med Hemother. 2024. PMID: 40485895 Free PMC article.
-
Molecular modifications to mitigate oxidative stress and improve red blood cell storability.Front Physiol. 2024 Oct 30;15:1499308. doi: 10.3389/fphys.2024.1499308. eCollection 2024. Front Physiol. 2024. PMID: 39539958 Free PMC article. Review.
-
Interplay Between Metabolic Pathways and Increased Oxidative Stress in Human Red Blood Cells.Cells. 2024 Dec 7;13(23):2026. doi: 10.3390/cells13232026. Cells. 2024. PMID: 39682773 Free PMC article. Review.
-
Stability of Erythrocyte-Derived Nanovesicles Assessed by Light Scattering and Electron Microscopy.Int J Mol Sci. 2021 Nov 25;22(23):12772. doi: 10.3390/ijms222312772. Int J Mol Sci. 2021. PMID: 34884574 Free PMC article.
-
Donor age contributes more to the rheological properties of stored red blood cells than donor sex and biological age distribution.Blood Adv. 2025 Feb 25;9(4):673-686. doi: 10.1182/bloodadvances.2024014475. Blood Adv. 2025. PMID: 39504562 Free PMC article.
References
-
- Nakao M, Nakao T, Yamazoe S. Adenosine triphosphate and maintenance of shape of the human red cells. Nature. 1960 Sep;187((4741)):945–6. - PubMed
-
- Wong P. A basis of echinocytosis and stomatocytosis in the disc-sphere transformations of the erythrocyte. J Theor Biol. 1999 Feb;196((3)):343–61. - PubMed
LinkOut - more resources
Full Text Sources
Other Literature Sources
