. 2021 Feb 23:12:638027.
doi: 10.3389/fphys.2021.638027. eCollection 2021.

Impaired Cytoskeletal and Membrane Biophysical Properties of Acanthocytes in Hypobetalipoproteinemia - A Case Study

Affiliations

Impaired Cytoskeletal and Membrane Biophysical Properties of Acanthocytes in Hypobetalipoproteinemia - A Case Study

Anne-Sophie Cloos et al. Front Physiol. .

Erratum in

Abstract

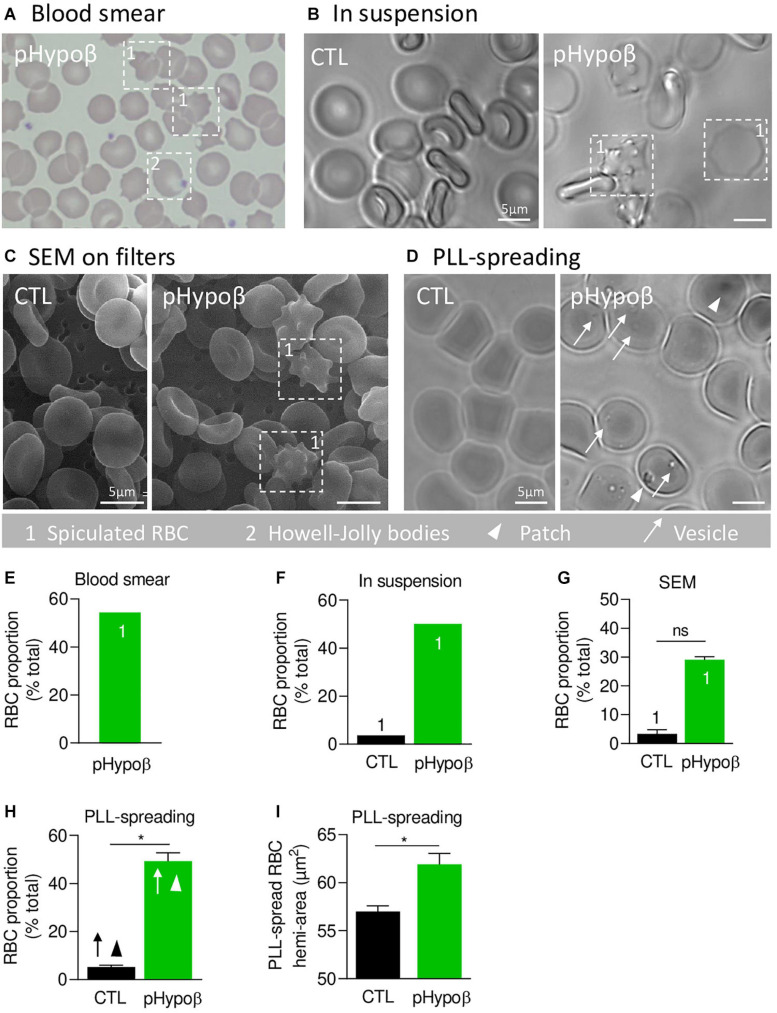
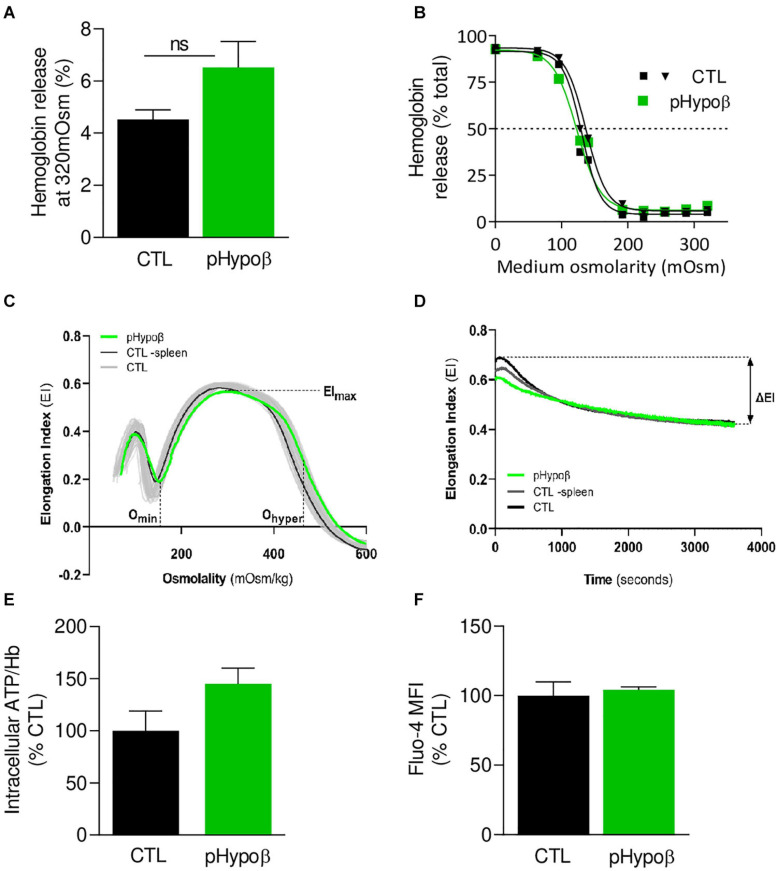
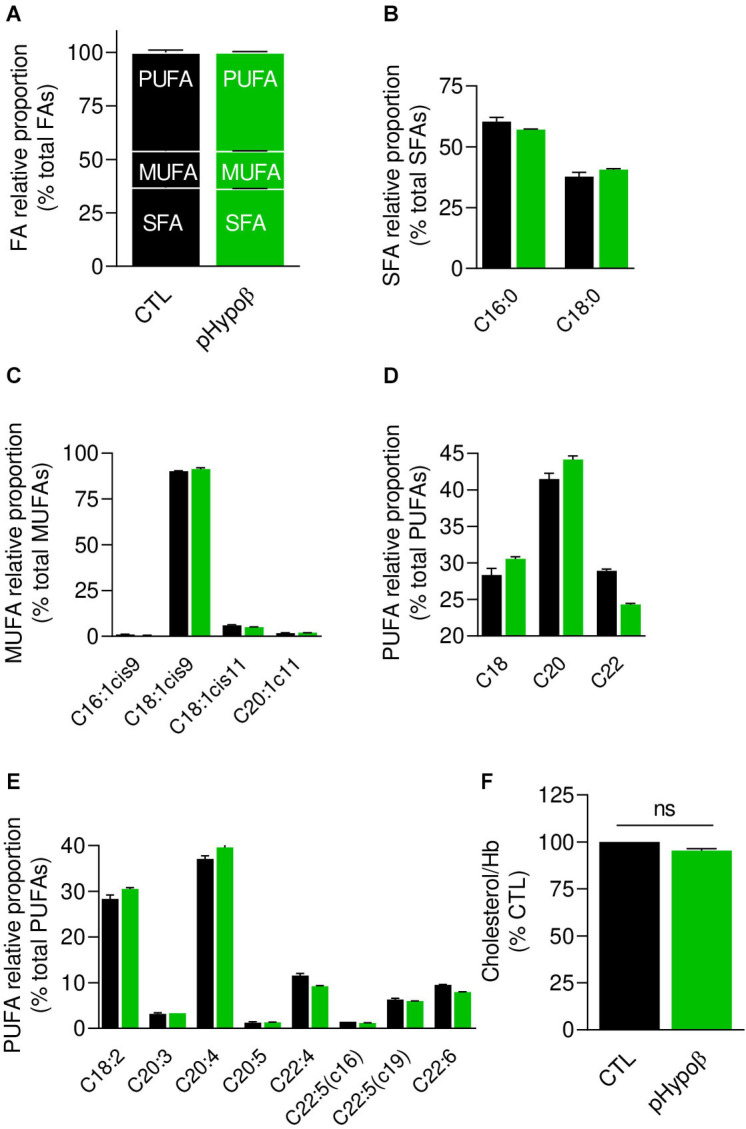
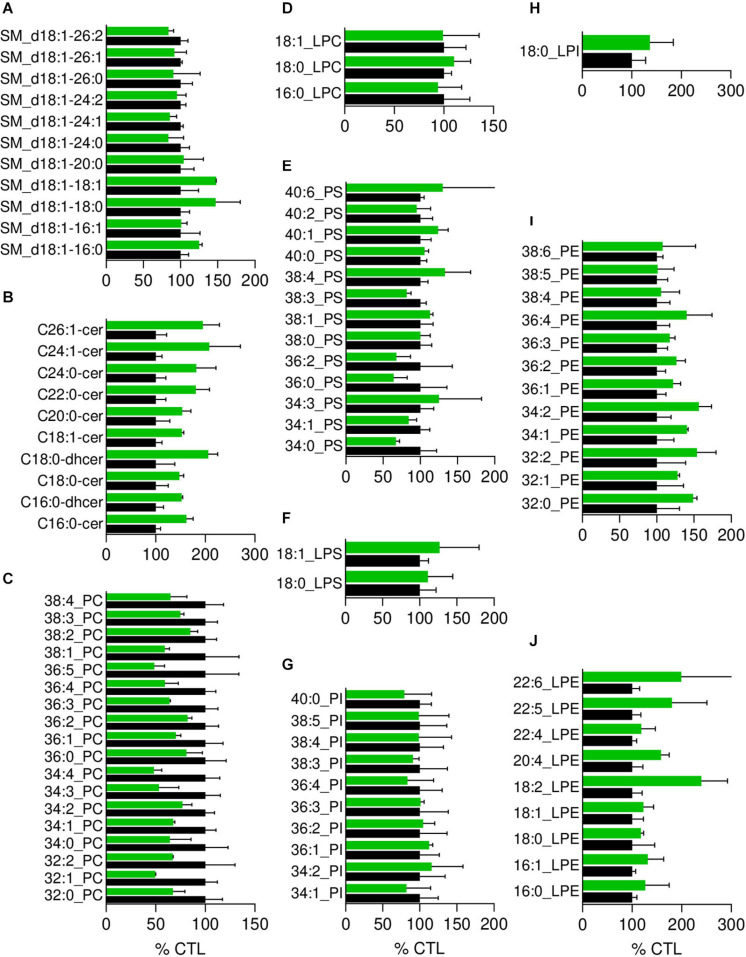
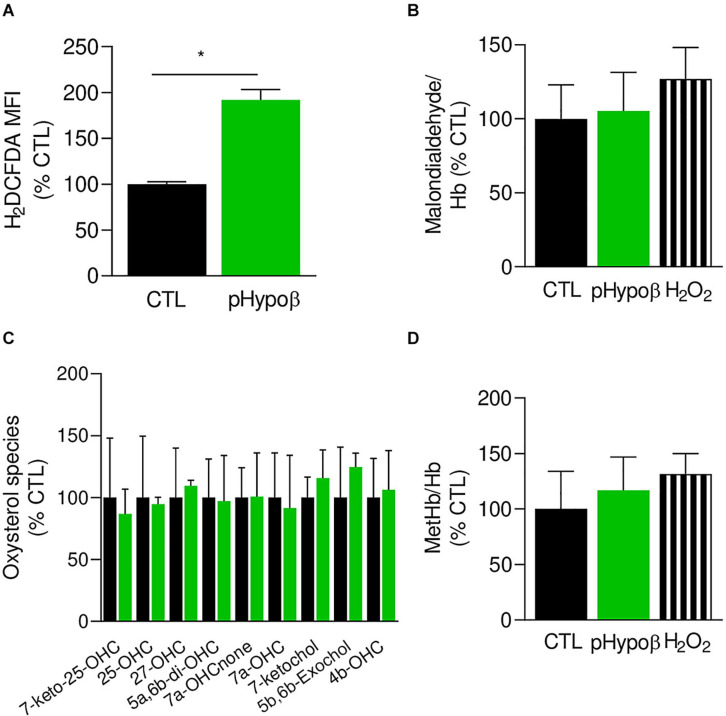
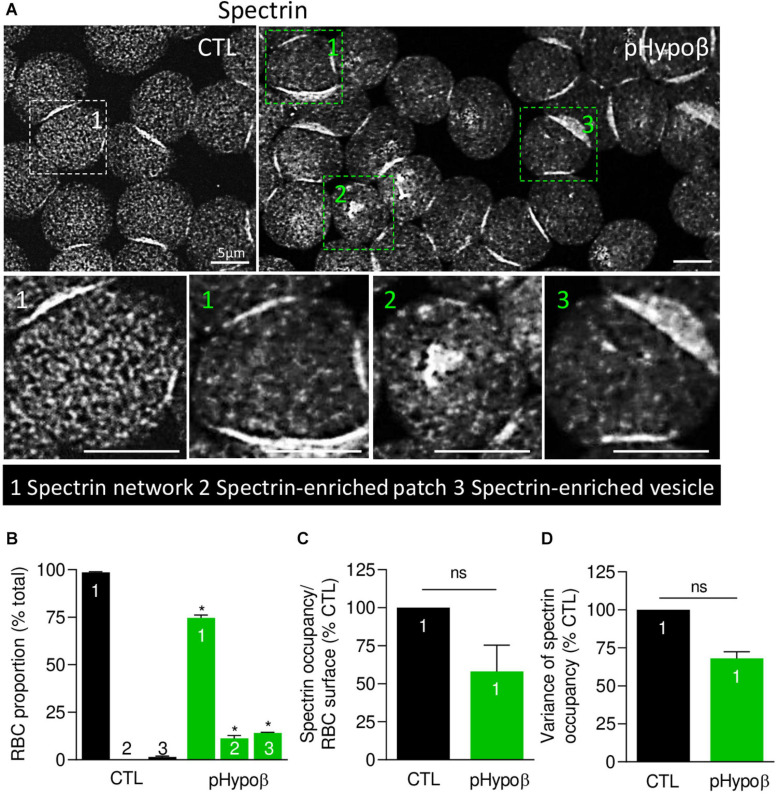
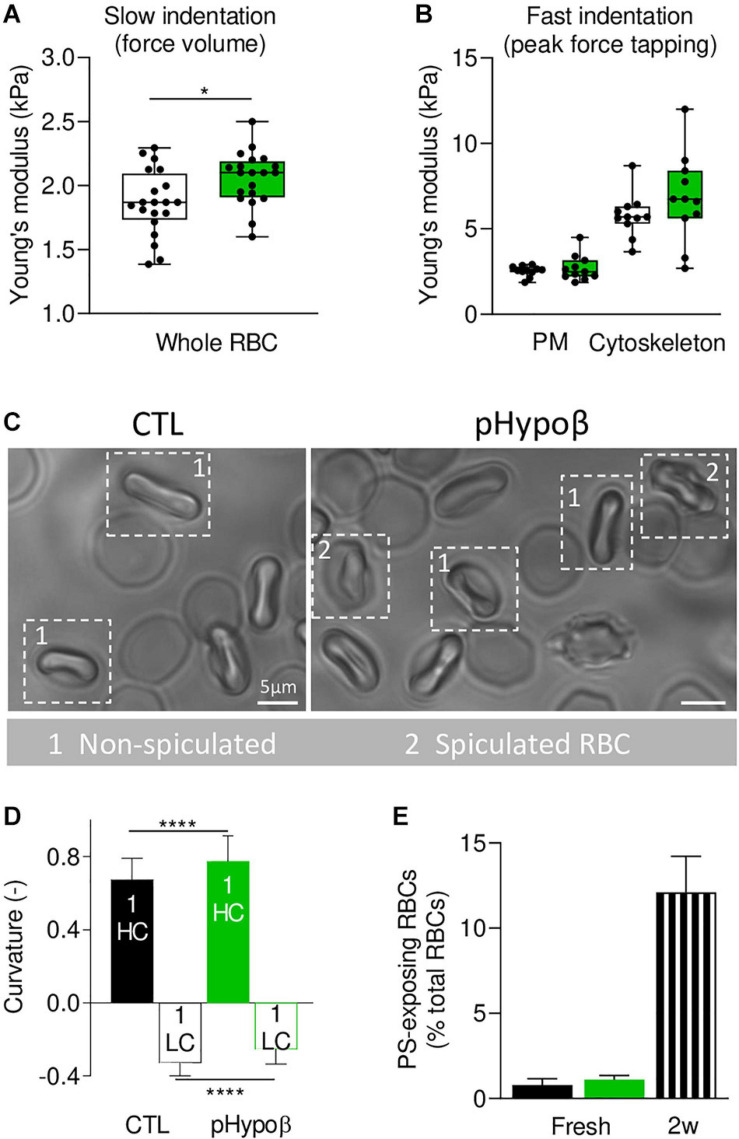
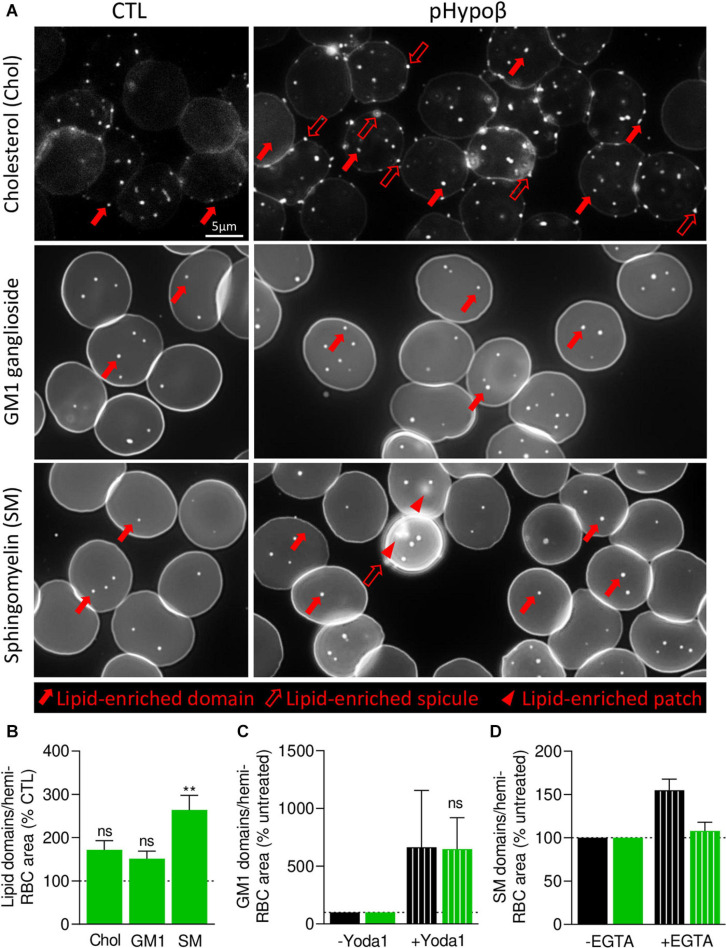
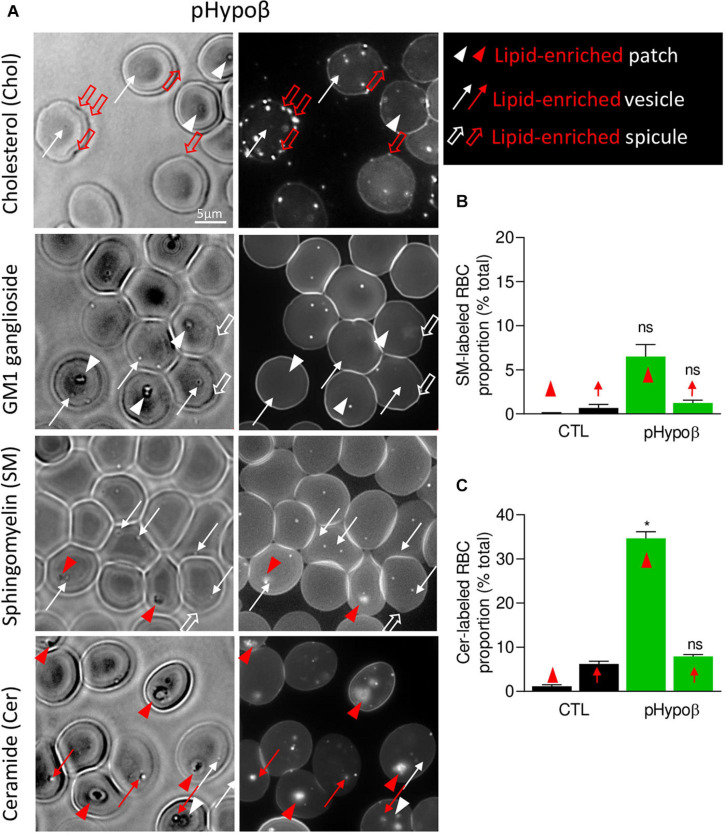
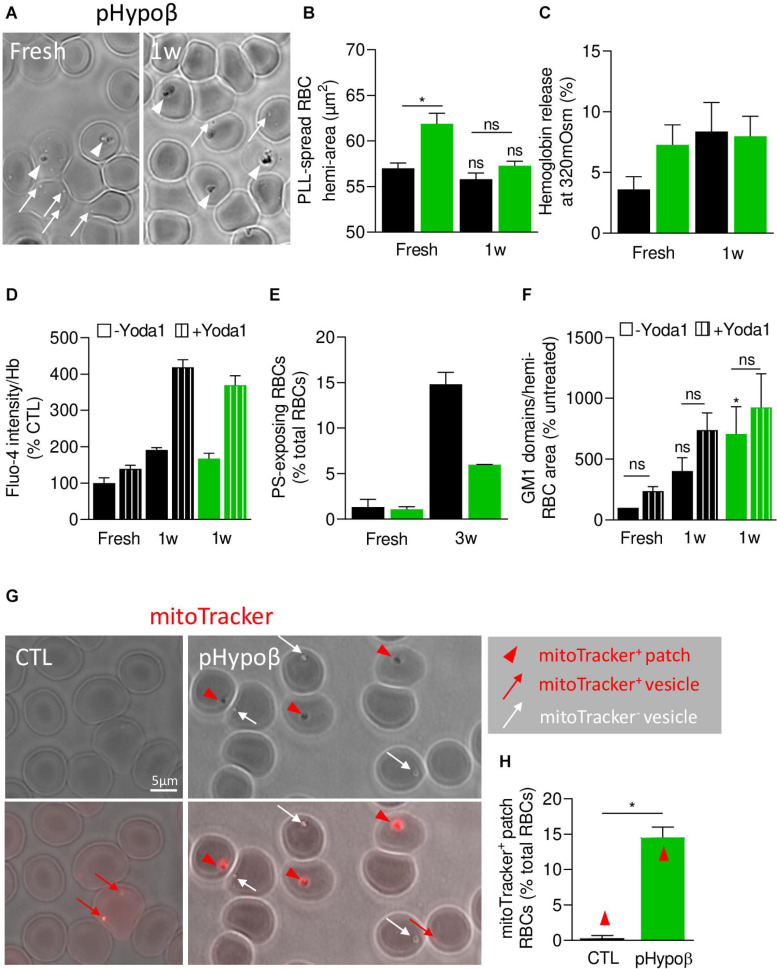
Familial hypobetalipoproteinemia is a metabolic disorder mainly caused by mutations in the apolipoprotein B gene. In its homozygous form it can lead without treatment to severe ophthalmological and neurological manifestations. In contrast, the heterozygous form is generally asymptomatic but associated with a low risk of cardiovascular disease. Acanthocytes or thorny red blood cells (RBCs) are described for both forms of the disease. However, those morphological changes are poorly characterized and their potential consequences for RBC functionality are not understood. Thus, in the present study, we asked whether, to what extent and how acanthocytes from a patient with heterozygous familial hypobetalipoproteinemia could exhibit altered RBC functionality. Acanthocytes represented 50% of the total RBC population and contained mitoTracker-positive surface patches, indicating the presence of mitochondrial fragments. While RBC osmotic fragility, calcium content and ATP homeostasis were preserved, a slight decrease of RBC deformability combined with an increase of intracellular free reactive oxygen species were observed. The spectrin cytoskeleton was altered, showing a lower density and an enrichment in patches. At the membrane level, no obvious modification of the RBC membrane fatty acids nor of the cholesterol content were detected but the ceramide species were all increased. Membrane stiffness and curvature were also increased whereas transversal asymmetry was preserved. In contrast, lateral asymmetry was highly impaired showing: (i) increased abundance and decreased functionality of sphingomyelin-enriched domains; (ii) cholesterol enrichment in spicules; and (iii) ceramide enrichment in patches. We propose that oxidative stress induces cytoskeletal alterations, leading to increased membrane stiffness and curvature and impaired lipid lateral distribution in domains and spicules. In addition, ceramide- and spectrin-enriched patches could result from a RBC maturation defect. Altogether, the data indicate that acanthocytes are associated with cytoskeletal and membrane lipid lateral asymmetry alterations, while deformability is only mildly impaired. In addition, familial hypobetalipoproteinemia might also affect RBC precursors leading to disturbed RBC maturation. This study paves the way for the potential use of membrane biophysics and lipid vital imaging as new methods for diagnosis of RBC disorders.

Keywords: acanthocytosis; ceramide; erythropoiesis; lipid domains; lipidomics; membrane biophysical properties; mitochondria; reactive oxygen species.


Conflict of interest statement

The authors declare that the research was conducted in the absence of any commercial or financial relationships that could be construed as a potential conflict of interest.

Figures

FIGURE 1
FIGURE 1
A high proportion of acanthocytes is visible on pHypoβ blood smears and RBCs in suspension while patches and small vesicles are evidenced upon RBC spreading. The morphology of RBCs of the patient with hypobetalipoproteinemia (pHypoβ; green columns) was compared to those of healthy donors (CTL; black columns), either on blood smear (A), on RBCs in suspension (B,C), or upon spreading on poly-L-lysine (PLL)-coated coverslips (D). Then, the proportion of RBCs with spicules (indicated with 1; E–G), patches (arrowheads, H) and/or vesicles (arrows, H) and the RBC membrane area were determined (I). (A) May–Grünwald Giemsa-stained blood smear. 1, spiculated RBCs; 2, Howell-Jolly bodies. (B) Light microscopy of living RBCs in suspension in IBIDI chambers. Images are representative of 2 independent experiments. (C) Scanning electron microscopy of glutaraldehyde-fixed RBCs on filters. Images are representative of 2 experiments with 3 filters each. (D) Light microscopy of living RBCs spread on PLL-coated coverslips. Images are representative of at least 10 experiments. (E–G) Quantification of the abundance of spiculated RBCs, expressed as % of total RBCs. Data are means from 1 experiment for (E,F) and means ± SEM of 3–4 filters in (G). Mann–Whitney test; ns, not significant. (H) Quantification of the proportion of PLL-spread RBCs presenting patches and/or vesicles. Data are means ± SEM of 3–6 independent experiments. Mann–Whitney test; *p < 0.05. (I) Quantification of the membrane surface area of PLL-spread RBCs. Data are means ± SEM of 6–7 independent experiments. Mann–Whitney test; *p < 0.05.
FIGURE 2
FIGURE 2
The extent of hemoglobin release and the intracellular calcium and ATP levels are preserved in pHypoβ RBCs while deformability upon shear stress is slightly decreased. RBCs from healthy donors (black and gray in panel C) or pHypoβ (green) were evaluated for osmotic fragility (A,B), deformability (C,D), intracellular ATP (E) and calcium content (F). (A,B) RBC osmotic fragility. RBCs were incubated in isotonic (A) or increasingly hypotonic (B) media and then centrifugated. Hemoglobin (Hb) in supernatants and in RBC pellets was assessed spectrophotometrically to determine hemolysis. The horizontal dotted line in (B) indicates the medium osmolarity at which 50% of the RBCs were lysed. Data are means ± SEM of 4 independent experiments for (A) and are representative for 2 independent experiments in (B). Mann–Whitney test; ns, not significant. (C,D) RBC deformability. (C) Osmotic gradient ektacytometry curve and derived EImax, Omin, and Ohyper parameters, which, respectively, reflect membrane surface area, surface area-to-volume ratio and cellular hydration. pHypoβ RBCs (green curve) were compared to healthy controls (gray curves obtained from 25 healthy subjects) and a healthy splenectomized control (black curve). (D) Cell membrane stability test (CMST) curve and the derived ΔEI parameter which depicts the capacity of the RBCs to shed membrane and resist shear stress. Data are representative of 2 experiments in (C) and 1 experiment in (D). (E) Intracellular ATP. ATP levels were determined with a kit based on the activity of the firefly luciferase in presence of ATP and the consequent light emission in presence of luciferin. Intracellular ATP levels were normalized to Hb and expressed as percentage of the CTL RBCs. Data are means ± SD of triplicates from 1 experiment. (F) RBC calcium content. RBCs were labeled with the non-fluorescent Fluo4-AM which is transformed in RBCs into the fluorescent Fluo4 after de-esterification and interaction with calcium ions. Labeled RBCs were analyzed by flow cytometry for median fluorescence intensity (MFI) and then expressed as percentage of CTLs. Data are means ± SD of triplicates from 1 experiment.
FIGURE 3
FIGURE 3
Membrane fatty acid and cholesterol contents are largely preserved in pHypoβ RBCs. RBCs from healthy donors (black columns) or pHypoβ (green columns) were evaluated for membrane fatty acid (FA) content (A–E) and cholesterol level (F). (A–E) RBC FA composition. Lipids were extracted from isolated RBCs and prepared for gas chromatography to analyze FA content. (A) Relative proportion of saturated (SFA), monounsaturated (MUFA) and polyunsaturated (PUFA) FAs expressed as percentage of total FAs. (B) Relative proportion of the two major SFAs (C16:0 and C18:0). (C) Relative proportion of the four major MUFAs (C16 and C18 with one double bond on position 9 and C18 and C20 with one double bound on position 11). (D) Relative proportion of PUFA according to the carbon chain length (chains of 18, 20, or 22C). (E) Relative proportion of the major PUFAs (chains of 18–22C and 2–6 double bonds). All data are means ± SD of triplicates from 1 experiment. (F) Cholesterol content. Lysed RBCs were evaluated for their cholesterol content through a fluorescent assay kit which uses several enzymatic reactions starting with cholesterol and ending with the transformation of Amplex Red into fluorescent resofurin. Cholesterol content was normalized to Hb content and expressed as percentage of the CTL RBCs. Data are means ± SEM of 3 independent experiments. Mann–Whitney test; ns, not significant.
FIGURE 4
FIGURE 4
The most obvious membrane lipid changes in pHypoβ RBCs are an increase of ceramide species and a decrease of phosphatidylcholine species. Lipid species were assessed by HPLC-MS on washed, lysed and lipid-extracted RBCs. Content in sphingomyelin (d18:1 D-erythro-sphingosine backbone, SM; A), ceramide (Cer) and dihydroceramide (dhcer; B), phosphatidylcholine (PC; C), lysophosphatidylcholine (LPC; D), phosphatidylserine (PS; E), lysophosphatidylserine (LPS; F), phosphatidylinositol (PI; G), lysophosphatidylinositol (LPI; H), phosphatidylethanolamnine (PE; I) and lysophosphatidylethanolamine (LPE; J). Results are expressed as percentage of controls (CTL, mean of 4 donors). Data are means ± SD of 2 independent experiments.
FIGURE 5
FIGURE 5
Accumulation of free reactive oxygen species in pHypoβ RBCs is not accompanied by lipid or hemoglobin oxidation. RBCs from healthy donors (black columns) or pHypoβ (green columns) were evaluated for free reactive oxygen species (ROS) accumulation (A), lipid peroxidation (B), oxysterol content (C), and methemoglobin (MetHb) accumulation (D). Hydrogen peroxide was used as positive control in (B,D) (hatched columns). All data are expressed as percentage of healthy untreated RBCs. (A) Intracellular ROS accumulation. RBCs were labeled with the non-fluorescent H2DCFDA which is transformed into fluorescent DCF inside the RBCs after de-esterification and interaction with ROS. Flow cytometry analysis allowed to determine the MFI of the global RBC population. Data are means ± SEM of 3–6 independent experiments. Mann–Whitney test; *p < 0.05. (B) Lipid peroxidation. Malondialdehyde (MDA), one final product of lipid peroxidation, was detected through interaction with thiobarbituric acid forming a fluorescent adduct. MDA levels were normalized to Hb content and data are means ± SD of triplicates from 2 independent experiments. (C) Membrane content in oxysterols. RBCs were washed, lysed, extracted for lipids and determined for 7-Keto-25-hydroxycholesterol (7-keto-25-OHC), 25-hydroxycholesterol (25-OHC), 27-hydroxycholesterol (27-OHC), 5α,6β-dihydroxycholesterol (5α,6β-diOHC), 7α-hydroxycholestenone (7α-OHCnone), 7α-hydroxycholesterol (7α-OHC), 7-ketocholesterol (7-ketochol), 5β,6β-epoxycholesterol (5β,6β-exochol) and 4β-hydroxycholesterol (4β-OHC). Results are expressed as percentage of control RBCs and are means ± SD of 2 independent experiments. (D) MetHb content. MetHb was determined using a sandwich Elisa and reported to the global Hb content. Data are means ± SD of triplicates from 1 experiment.
FIGURE 6
FIGURE 6
The spectrin network is altered in pHypoβ RBCs, showing either a lower density or a patchy or vesiculated pattern. RBCs from healthy donors (CTL, black) or pHypoβ (green) were spread onto PLL-coated coverslips, fixed/permeabilized, immunolabelled for spectrin and visualized by confocal fluorescence microscopy using the same settings for sample illumination. (A) Representative general views and zooms of RBCs with homogenous spectrin network (1), spectrin-enriched patches (2) and spectrin-enriched vesicles (3). (B) Quantification of the relative proportion of RBCs with homogenous spectrin network (1), spectrin-enriched patches (2) or spectrin-enriched vesicles (3). Data are means ± SEM of 3–6 independent experiments. Mann–Whitney tests to compare each RBC population in healthy vs. pHypoβ RBCs. *p < 0.05. (C,D) Quantification of spectrin occupancy normalized to the RBC surface (C) and variance of the spectrin labeling (D) in RBCs with homogenous spectrin network (population 1). Data are expressed as percentage of CTLs and are means ± SEM of 3 independent experiments. Mann–Whitney tests; ns, not significant.
FIGURE 7
FIGURE 7
Membrane stiffness and curvature are increased in pHypoβ RBCs whereas membrane transversal asymmetry is not modified. RBCs from healthy donors (CTL, black) or pHypoβ (green) were evaluated for membrane stiffness (A,B), curvature (C,D) and transversal asymmetry (E). (A,B) Membrane stiffness. (A) Young’s modulus values extracted for CTL and pHypoβ RBCs in Slow indentation experiments, where the whole RBC mechanical behavior was analyzed. (B) Young’s modulus of CTL and pHypoβ RBCs obtained in Fast indentation experiments, where the elastic contribution of the plasma membrane (PM) and cytoskeleton were evaluated separately. Each data point represents the mean Young’s modulus value calculated for one RBC. Box plots depict 25th–75th percentiles, horizontal lines and cantered squares show mean values and error bars indicate SD. 20 RBCs were analyzed in (A) and 11 RBCs in (B). Two-sample t-test. *p < 0.05. (C,D) Membrane curvature. RBCs were diluted, dropped off in IBIDI chambers and immediately observed by microscopy. Spiculated RBCs (indicated by 2) were distinguished from non-spiculated RBCs (indicated by 1) and the latter were then quantified for curvature in high curvature maxima (HC) and low curvature maxima (LC). 110 RBCs were analyzed for healthy donors and 50 RBCs for pHypoβ. Two-sample t-test. ****p < 0.0001. (E) Membrane transversal asymmetry. RBCs were labeled with fluorescent Annexin-V and then analyzed with FlowJo to determine the proportion of phosphatidylserine (PS)-exposing cells by positioning the cursor at the edge of the healthy fresh RBC population. RBCs from blood stored for 2 weeks at 4°C (2w) were used as positive control. Data are means ± SD of triplicates from 1 experiment.
FIGURE 8
FIGURE 8
In contrast to cholesterol- and GM1-enriched domains, those enriched in sphingomyelin are modified in abundance and functionality at the pHypoβ RBC surface. RBCs from healthy donors (CTL, black columns) or pHypoβ (green columns) were either left untreated (not-hatched columns) or incubated with Yoda1 for 30 s (hatched columns in C) or EGTA for 10 min in a calcium-free medium (hatched columns in D). All RBCs were then either labeled with the fluorescent Theta toxin fragment specific to endogenous cholesterol and then immobilized on PLL-coated coverslips (Chol; A,B); or immobilized on PLL-coated coverslips and then labeled with fluorescent BODIPY analogs of GM1 ganglioside (GM1; A–C) or sphingomyelin (SM; A,B,D). All coverslips were then directly observed by vital fluorescence microscopy. (A) Representative images of Chol-, GM1-, and SM-enriched domains, spicules or patches in untreated RBCs. Large filled arrows, lipid-enriched domains; large open arrows, lipid-enriched spicules; arrowheads, lipid-enriched patches. (B–D) Quantification of lipid domain abundance in RBCs either untreated or treated with Yoda1 or EGTA to, respectively, activate PIEZO1 (C) or induce intracellular calcium depletion (D). In (D) the calcium-free medium containing EGTA is maintained all along the experiment. Data are normalized to the hemi-RBC area and are means ± SEM of 4–5 independent experiments (B) or means ± SD/SEM of 2–3 independent experiments (C,D). Kruskal–Wallis test followed by Dunn’s comparison test (B) and Wilcoxon matched-pairs signed rank tests (C). ns, not significant; **p < 0.01.
FIGURE 9
FIGURE 9
The spicules at the pHypoβ surface are mainly enriched in cholesterol whereas the patches and vesicles are mainly enriched in ceramide. RBCs from healthy donors (black columns) or pHypoβ (green columns) were either labeled with the fluorescent Theta toxin fragment specific to endogenous cholesterol and then immobilized on PLL-coated coverslips (Chol; A) or immobilized on PLL-coated coverslips and then labeled with fluorescent BODIPY analogs of GM1 ganglioside (GM1; A), sphingomyelin (SM; A,B); or ceramide (Cer; A,C). All coverslips were then directly observed by vital fluorescence microscopy. (A) Representative images of pHypoβ RBCs. Left, transmission microscopy image; right, fluorescence microscopy image. Lipid-enriched (red) or non-enriched (white) patches (arrowheads), vesicles (arrows), spicules (large open arrows) detected on the RBC surface on transmission images. (B,C) Quantification of the proportion of RBCs presenting SM- (B) or cer- (C) enriched patches or vesicles. Data are expressed as means ± SEM of 3–6 independent experiments. Mann–Whitney tests to compare enriched structures at the surface of healthy vs. pHypoβ RBCs; ns, not significant; *p < 0.05.
FIGURE 10
FIGURE 10
pHypoβ RBCs partly resist to RBC aging upon blood storage in K+/EDTA tubes at 4°C but exhibit a high abundance of residual mitochondrial fragments. RBCs from healthy donors (black columns) or pHypoβ (green columns) were either stored for 1–3 weeks at 4°C (1-3w) and assessed for RBC morphology and surface area (A,B), osmotic fragility (C), calcium content (D), PS surface exposure (E) and GM1-enriched domain abundance (F); or freshly analyzed for the presence of mitochondria remnants (G,H). (A–F) RBC morphology and functionality upon storage at 4°C. (A) Morphology of fresh and 1 week-stored pHypoβ RBCs immobilized on PLL-coated coverslips as in Figure 1D. Images are representative of 3 experiments. (B) RBC surface determined as in Figure 1I. Data are means ± SEM of 3–7 independent experiments. Wilcoxon matched-pairs signed rank tests and Mann–Whitney test; ns, not significant; *p < 0.05. (C) RBC fragility determined as in Figure 2A. Data are means ± SD of triplicates from 1 experiment. (D) RBC calcium content. RBCs were labeled with Fluo4-AM as in Figure 2F, incubated with Yoda1 (hatched columns) and analyzed by fluorimetry. Data are normalized to Hb content and are means ± SD of triplicates from 1 experiment. (E) RBC PS exposure assessed as in Figure 7E. Data are means ± SD of triplicates from 1 experiment. (F) GM1-enriched domain abundance on RBCs at resting state and upon stimulation with Yoda1 (hatched columns), determined as in Figure 8C. Data are means ± SEM of 3 independent experiments. Kruskal–Wallis test followed by Dunn’s comparison test and Wilcoxon matched-pairs signed rank tests for the effect of Yoda1. ns, not significant; *p < 0.05. (G,H) RBC evaluation for the presence of mitochondrial remnants. RBCs were incubated for 30 min with a fluorescent mitoTracker, washed, dropped on PLL-coated coverslips and immediately observed by fluorescence microscopy. (G) Representative images. Upper panels, transmission; lower panels, transmission with fluorescence. Red arrowheads, mitoTracker-positive patches; red arrows, mitoTracker-positive vesicles; white arrows, mitotracker-negative vesicles. (H) Relative proportion of RBCs presenting mitoTracker-labeled patches as percentage of total RBCs. Data are means ± SEM of 3–6 independent experiments. Mann–Whitney test. *p < 0.05.

Similar articles

Cited by

References

    1. Adjobo-Hermans M. J., Cluitmans J. C., Bosman G. J. (2015). Neuroacanthocytosis: Observations, Theories and Perspectives on the Origin and Significance of Acanthocytes. Tremor. Other. Hyperkinet. Mov. 5:328. 10.5334/tohm.271 - DOI - PMC - PubMed
    1. Baines A. J. (2010). The spectrin-ankyrin-4.1-adducin membrane skeleton: adapting eukaryotic cells to the demands of animal life. Protoplasma 244 99–131. 10.1007/s00709-010-0181-1 - DOI - PubMed
    1. Barenholz Y., Yechiel E., Cohen R., Deckelbaum R. J. (1981). Importance of cholesterol-phospholipid interaction in determining dynamics of normal and abetalipoproteinemia red blood cell membrane. Cell Biophys. 3 115–126. 10.1007/bf02788128 - DOI - PubMed
    1. Biemer J. J. (1980). Acanthocytosis–biochemical and physiological considerations. Ann. Clin. Lab. Sci. 10 238–249. - PubMed
    1. Bogdanova A., Makhro A., Wang J., Lipp P., Kaestner L. (2013). Calcium in red blood cells-a perilous balance. Int. J. Mol. Sci. 14 9848–9872. 10.3390/ijms14059848 - DOI - PMC - PubMed

LinkOut - more resources