. 2021 Feb 23:12:616429.
doi: 10.3389/fmicb.2021.616429. eCollection 2021.

Longitudinal Study of the Bulk Tank Milk Microbiota Reveals Major Temporal Shifts in Composition

Affiliations

Longitudinal Study of the Bulk Tank Milk Microbiota Reveals Major Temporal Shifts in Composition

Davide Porcellato et al. Front Microbiol. .

Abstract

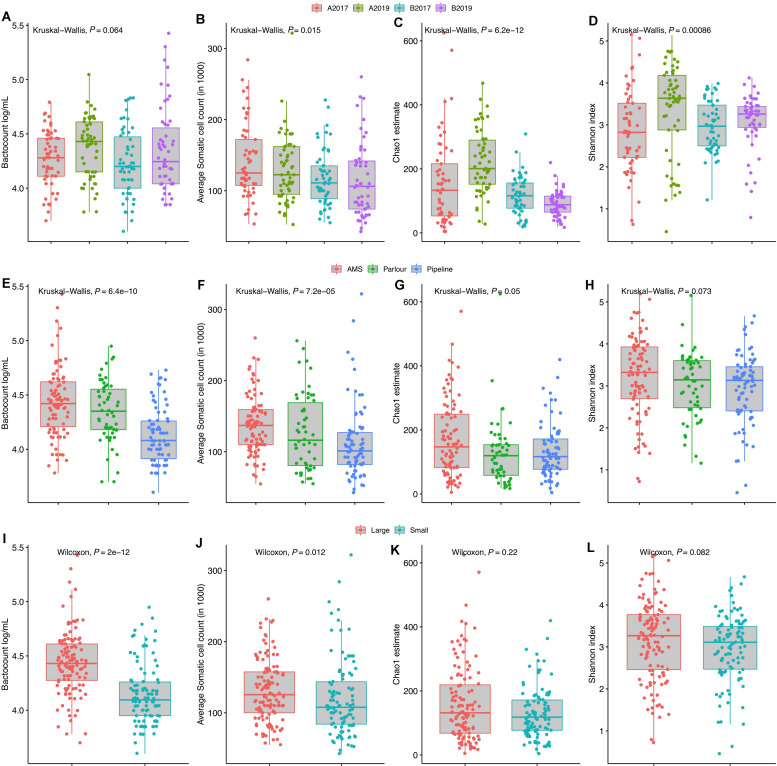
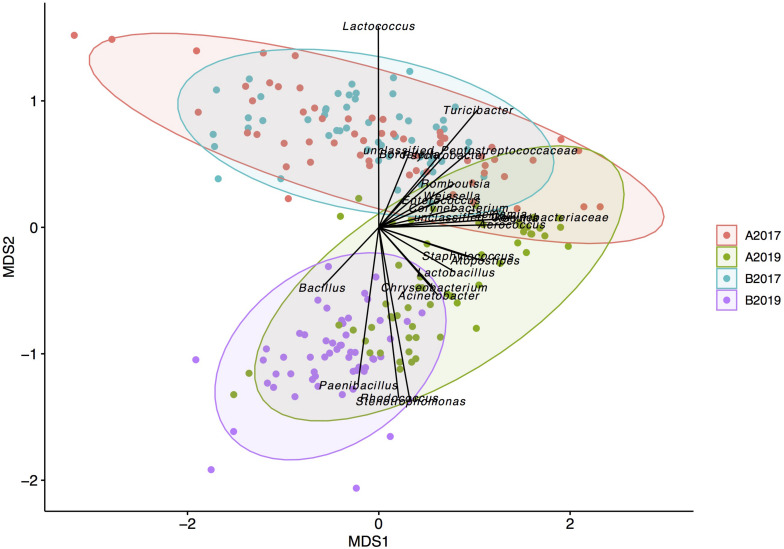
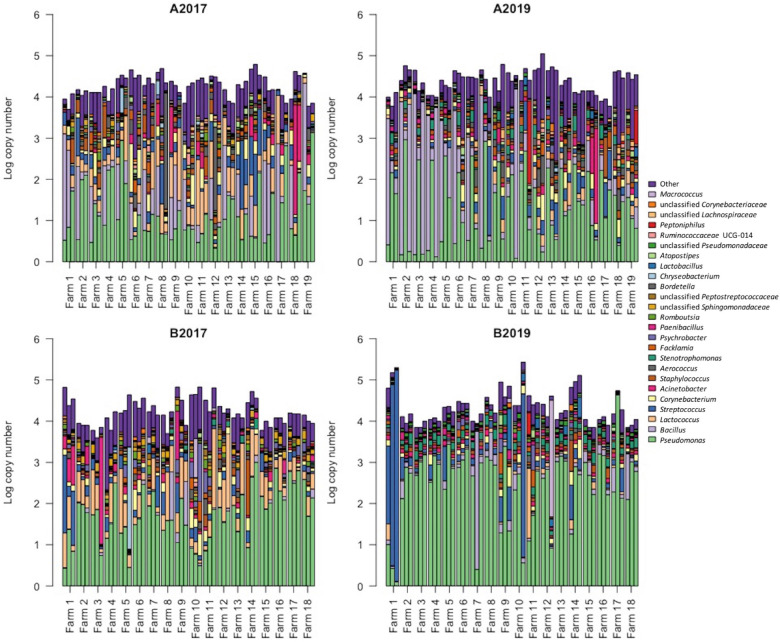
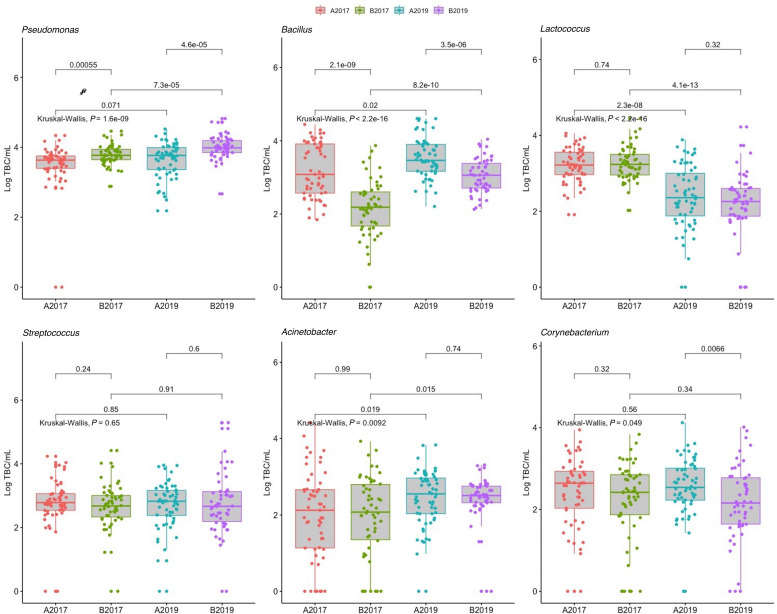
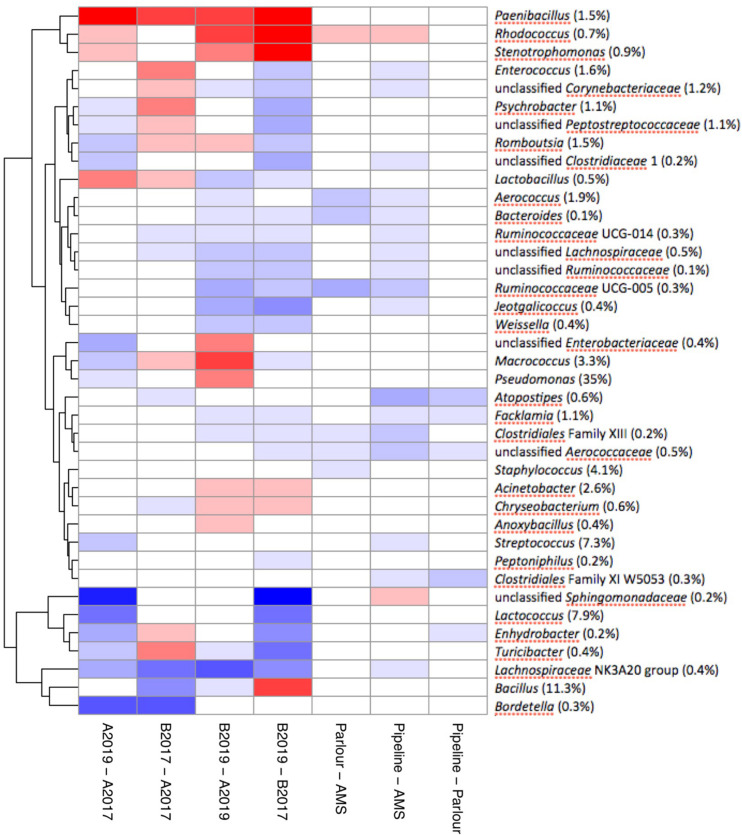
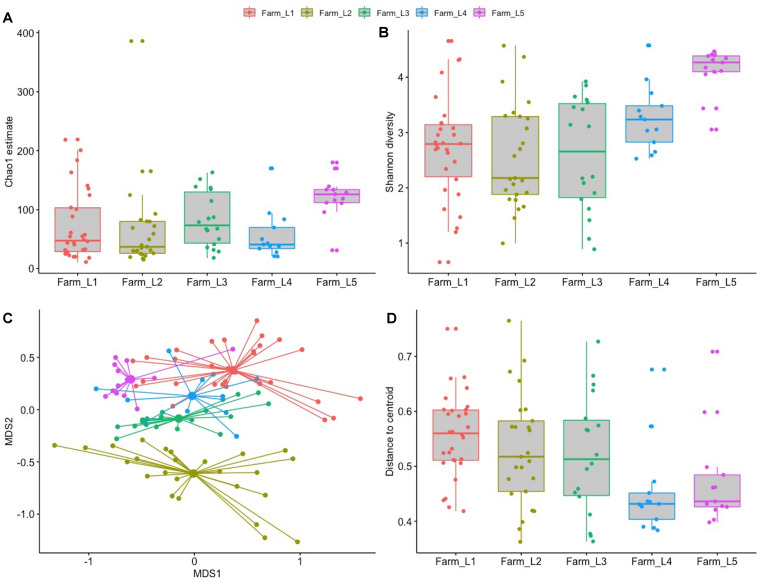
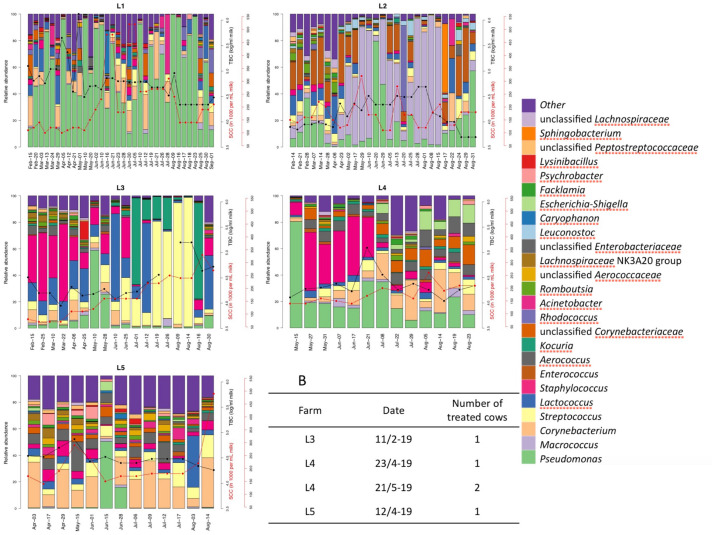
Introduction of microbial contaminations in the dairy value chain starts at the farm level and the initial microbial composition may severely affect the production of high-quality dairy products. Therefore, understanding the farm-to-farm variation and longitudinal shifts in the composition of the bulk tank milk microbiota is fundamental to increase the quality and reduce the spoilage and waste of milk and dairy products. In this study, we performed a double experiment to study long- and short-term longitudinal shifts in microbial composition using 16S rRNA gene amplicon sequencing. We analyzed milk from 37 farms, that had also been investigated two years earlier, to understand the stability and overall microbial changes over a longer time span. In addition, we sampled bulk tank milk from five farms every 1-2 weeks for up to 7 months to observe short-term changes in microbial composition. We demonstrated that a persistent and farm-specific microbiota is found in bulk tank milk and that changes in composition within the same farm are mostly driven by bacterial genera associated with mastitis (e.g., Staphylococcus and Streptococcus). On a long-term, we detected that major shift in milk microbiota were not correlated with farm settings, such as milking system, number of cows and quality of the milk but other factors, such as weather and feeding, may have had a greater impact on the main shifts in composition of the bulk tank milk microbiota. Our results provide new information regarding the ecology of raw milk microbiota at the farm level.

Keywords: bulk tank; longitudinal study; milk quality; raw milk microbiota; sequence variants.


Conflict of interest statement

The authors declare that the research was conducted in the absence of any commercial or financial relationships that could be construed as a potential conflict of interest.

Figures

FIGURE 1
FIGURE 1
Distribution of total bacterial counts, average somatic cell counts, alpha richness and diversity grouped by year and geographical area (A–D), milking system (E–H), and farm size (I–L). The average number of cows in Norway (28) was used to group the farms into “small” and “large” farms. P-value for the non-parametric analysis of variance (Kruskal–Wallis or Wilcoxon test) is reported in each plot.
FIGURE 2
FIGURE 2
Non-metric multidimensional scaling of the milk microbiota grouped by year and geographical area. Only strong significant taxa (envfit function P < 0.001) are reported as predictors onto the ordination.
FIGURE 3
FIGURE 3
Distribution of the 25 most abundant genera detected in raw milk samples. Each bar represents a sample of milk and each farm was sampled three times. The height of each bar indicates the absolute level of bacteria (in log TBC). The color distribution of each bar was obtained by (1) correcting the relative abundance by the average number of ribosomal RNA operons obtained for each genus and (2) normalizing the relative abundances (in %) against the absolute bacterial level. A: Farm 1–19 collected in area A; B: farm 1–18 collected in area B. 2017: samples collected in the year 2017 and 2019: samples collected in 2019. Data from 2017 were previously published in Skeie et al. (2019).
FIGURE 4
FIGURE 4
Distribution of total bacterial counts of the six most represented genera of bacteria detected in 222 samples of raw milk from farm bulk tanks grouped by year of sampling and geographical area. Kruskal–Wallis test was used to test significant differences between groups while, pairwise comparison between group of samples was performed using the Wilcoxon test. Data from 2017 were previously published in Skeie et al. (2019).
FIGURE 5
FIGURE 5
Pairwise differential abundance of the most abundant genera which account for over 95% of the total milk microbiota. Analysis of compositions of microbiomes with bias correction was used to check pairwise association for each genus between the year, geographical area and milking system. Values are reported in log-ratio and colored by differential abundance ratio between the groups.
FIGURE 6
FIGURE 6
Alpha and beta diversity of the bulk tank milk microbiota of five farms sampled over a period of several months. (A) Chao1 richness estimation grouped by farm. (B) Shannon diversity grouped by farm. (C) NMDS plot of the bulk tank microbiota obtained using the Bray–Curtis dissimilarity matrix. (D) Beta dispersion of homogeneity grouped by farm.
FIGURE 7
FIGURE 7
Relative abundance of the bulk tank milk microbiota of five farms (L1–L5) in the period February–August 2019. Somatic cell count (red lines) and total bacterial count (black lines) are reported for the milk delivered from the farms in the same period of the microbiota analysis. B: list of clinical mastitis cases reported by the five farms during the period of sampling and the number of cows treated. Somatic cell count, bacterial count and clinical mastitis reports were obtained from the Norwegian Dairy Herd Recording System.

References

    1. Andersen H. J., Pedersen L. H., Aarestrup F. M., Chriel M. (2003). Evaluation of the surveillance program of Streptococcus agalactiae in Danish dairy herds. J. Dairy Sci. 86 1233–1239. 10.3168/jds.S0022-0302(03)73707-2 - DOI - PubMed
    1. Callahan B. J., McMurdie P. J., Rosen M. J., Han A. W., Johnson A. J. A., Holmes S. P. (2016). DADA2: High-resolution sample inference from Illumina amplicon data. Nat. Methods 13 581–583. 10.1038/NMETH.3869 - DOI - PMC - PubMed
    1. Doyle C. J., Gleeson D., O’Toole P. W., Cotter P. D. (2017). Impacts of seasonal housing and teat preparation on raw milk microbiota: a high-throughput sequencing study. Appl. Environ. Microb. 83:e02694-16. 10.1128/AEM.02694-16 - DOI - PMC - PubMed
    1. Elmoslemany A. M., Keefe G. P., Dohoo I. R., Wichtel J. J., Stryhn H., Dingwell R. T. (2010). The association between bulk tank milk analysis for raw milk quality and on-farm management practices. Prev. Vet. Med. 95 32–40. 10.1016/j.prevetmed.2010.03.007 - DOI - PubMed
    1. Falentin H., Rault L., Nicolas A., Bouchard D. S., Lassalas J., Lamberton P., et al. (2016). Bovine teat microbiome analysis revealed reduced alpha diversity and significant changes in taxonomic profiles in quarters with a history of mastitis. Front. Microbiol 7:480. 10.3389/fmicb.2016.00480 - DOI - PMC - PubMed

LinkOut - more resources