

Novel and Transgressive Salinity Tolerance in Recombinant Inbred Lines of Rice Created by Physiological Coupling-Uncoupling and Network Rewiring Effects
- PMID: 33708229
- PMCID: PMC7940525
- DOI: 10.3389/fpls.2021.615277
Novel and Transgressive Salinity Tolerance in Recombinant Inbred Lines of Rice Created by Physiological Coupling-Uncoupling and Network Rewiring Effects
Abstract
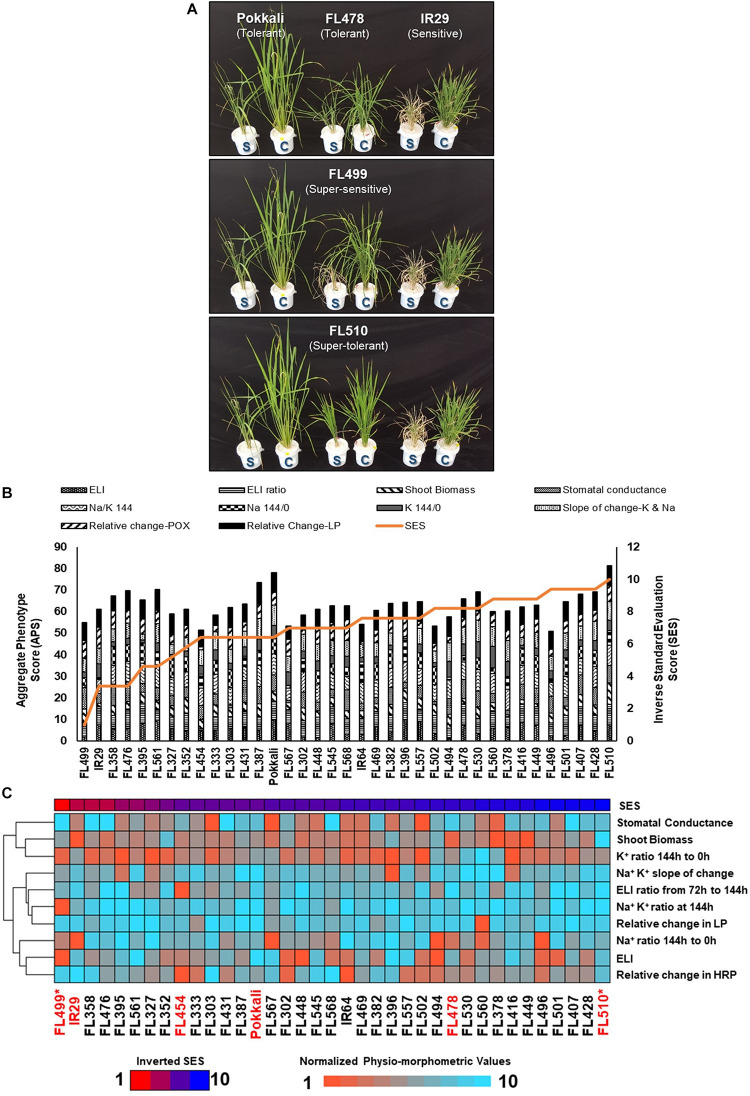
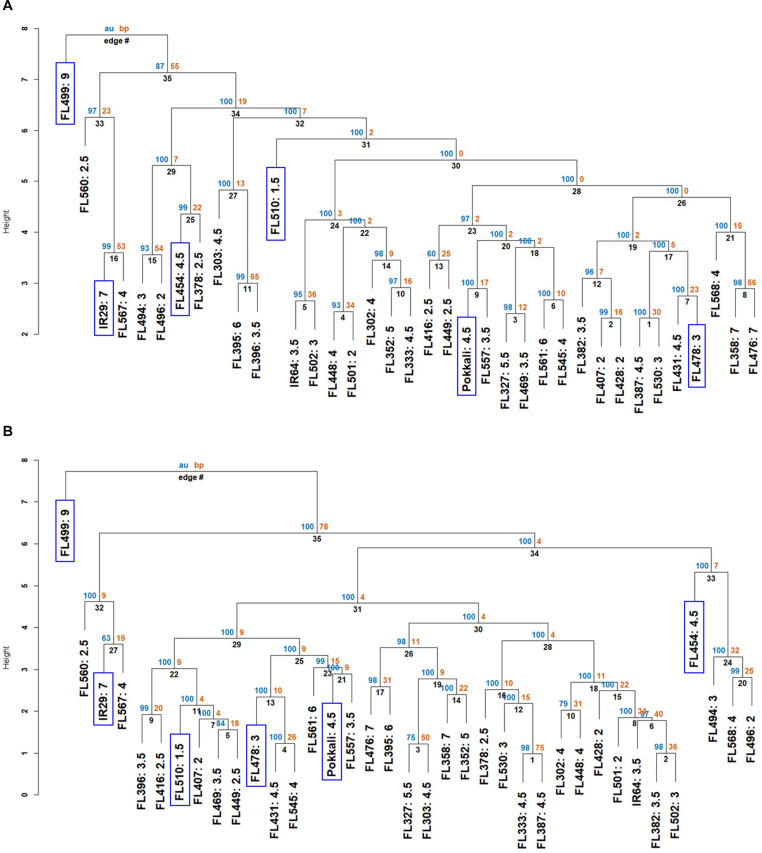
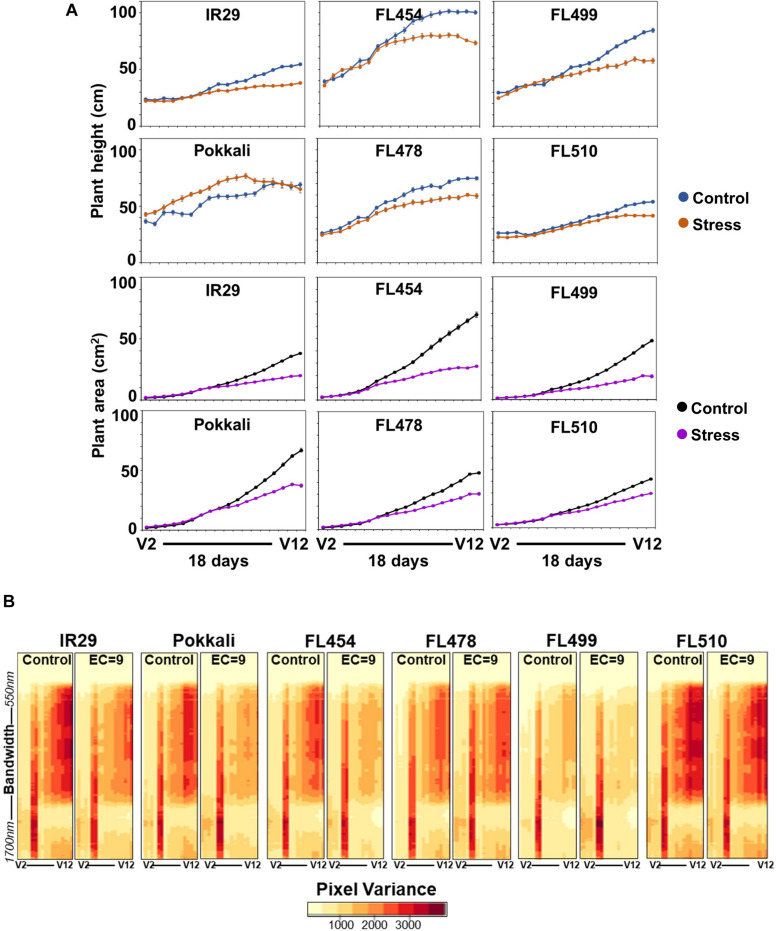
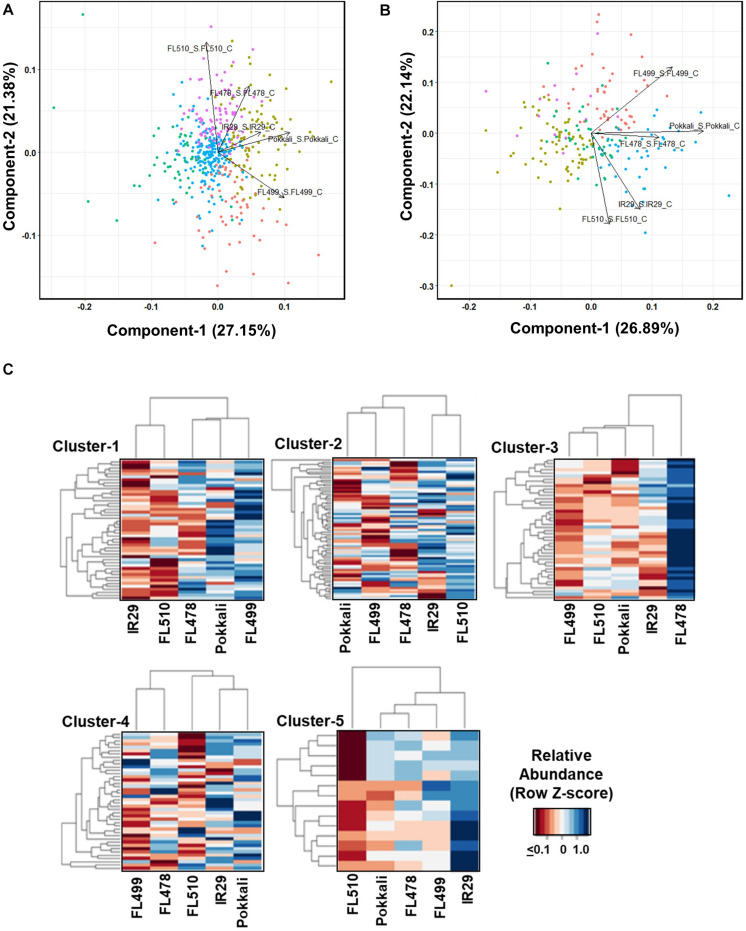
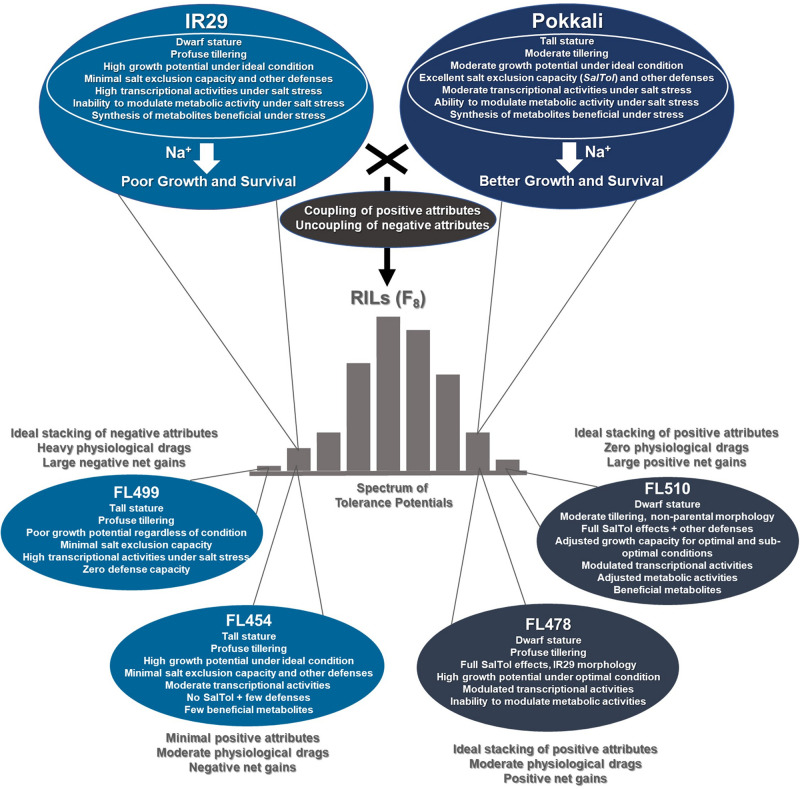
The phenomenon of transgressive segregation, where a small minority of recombinants are outliers relative to the range of parental phenotypes, is commonly observed in plant breeding populations. While this phenomenon has been attributed to complementation and epistatic effects, the physiological and developmental synergism involved have not been fully illuminated by the QTL mapping approach alone, especially for stress-adaptive traits involving highly complex interactions. By systems-level profiling of the IR29 × Pokkali recombinant inbred population of rice, we addressed the hypothesis that novel salinity tolerance phenotypes are created by reconfigured physiological networks due to positive or negative coupling-uncoupling of developmental and physiological attributes of each parent. Real-time growth and hyperspectral profiling distinguished the transgressive individuals in terms of stress penalty to growth. Non-parental network signatures that led to either optimal or non-optimal integration of developmental with stress-related mechanisms were evident at the macro-physiological, biochemical, metabolic, and transcriptomic levels. Large positive net gain in super-tolerant progeny was due to ideal complementation of beneficial traits while shedding antagonistic traits. Super-sensitivity was explained by the stacking of multiple antagonistic traits and loss of major beneficial traits. The synergism uncovered by the phenomics approach in this study supports the modern views of the Omnigenic Theory, emphasizing the synergy or lack thereof between core and peripheral components. This study also supports a breeding paradigm rooted on genomic modeling from multi-dimensional genetic, physiological, and phenotypic profiles to create novel adaptive traits for new crop varieties of the 21st century.
Keywords: Omnigenic Theory; genetic network rewiring; genetic novelty; physiological and biochemical synergy; salinity stress; transgressive segregation.
Copyright © 2021 Pabuayon, Kitazumi, Cushman, Singh, Gregorio, Dhatt, Zabet-Moghaddam, Walia and de los Reyes.
Conflict of interest statement
The authors declare that the research was conducted in the absence of any commercial or financial relationships that could be construed as a potential conflict of interest.
Figures
Similar articles
-
Contributions of Adaptive Plant Architecture to Transgressive Salinity Tolerance in Recombinant Inbred Lines of Rice: Molecular Mechanisms Based on Transcriptional Networks.Front Genet. 2020 Oct 23;11:594569. doi: 10.3389/fgene.2020.594569. eCollection 2020. Front Genet. 2020. PMID: 33193743 Free PMC article.
-
Genomic and epigenomic bases of transgressive segregation - New breeding paradigm for novel plant phenotypes.Plant Sci. 2019 Nov;288:110213. doi: 10.1016/j.plantsci.2019.110213. Epub 2019 Aug 7. Plant Sci. 2019. PMID: 31521221 Review.
-
Mapping QTLs using a novel source of salinity tolerance from Hasawi and their interaction with environments in rice.Rice (N Y). 2017 Nov 2;10(1):47. doi: 10.1186/s12284-017-0186-x. Rice (N Y). 2017. PMID: 29098463 Free PMC article.
-
Functional genomic analysis of K+ related salt-responsive transporters in tolerant and sensitive genotypes of rice.Front Plant Sci. 2023 Jan 19;13:1089109. doi: 10.3389/fpls.2022.1089109. eCollection 2022. Front Plant Sci. 2023. PMID: 36743539 Free PMC article.
-
Impacts of salinity stress on crop plants: improving salt tolerance through genetic and molecular dissection.Front Plant Sci. 2023 Sep 15;14:1241736. doi: 10.3389/fpls.2023.1241736. eCollection 2023. Front Plant Sci. 2023. PMID: 37780527 Free PMC article. Review.
Cited by
-
The Mining of Genetic Loci and the Analysis of Candidate Genes to Identify the Physical and Chemical Markers of Anti-Senescence in Rice.Plants (Basel). 2023 Nov 9;12(22):3812. doi: 10.3390/plants12223812. Plants (Basel). 2023. PMID: 38005709 Free PMC article.
-
Gain-of-function mutations of AtNHX1 suppress sos1 salt sensitivity and improve salt tolerance in Arabidopsis.Stress Biol. 2021 Nov 22;1(1):14. doi: 10.1007/s44154-021-00014-1. Stress Biol. 2021. PMID: 37676545 Free PMC article.
-
Contributions of Adaptive Plant Architecture to Transgressive Salinity Tolerance in Recombinant Inbred Lines of Rice: Molecular Mechanisms Based on Transcriptional Networks.Front Genet. 2020 Oct 23;11:594569. doi: 10.3389/fgene.2020.594569. eCollection 2020. Front Genet. 2020. PMID: 33193743 Free PMC article.
-
Optimized framework for evaluating F3 transgressive segregants in cayenne pepper.BMC Plant Biol. 2025 Feb 6;25(1):156. doi: 10.1186/s12870-025-06182-w. BMC Plant Biol. 2025. PMID: 39910447 Free PMC article.
-
Comparative physiological and transcriptomic analysis reveals salinity tolerance mechanisms in Sorghum bicolor (L.) Moench.Planta. 2021 Oct 16;254(5):98. doi: 10.1007/s00425-021-03750-w. Planta. 2021. PMID: 34657208
References
-
- AOAC (1990). Official Methods of Analysis. Rockville, MD: AOAC.
-
- Ashraf M., Foolad M. R. (2007). Roles of glycine betaine and proline in improving plant abiotic stress resistance. Environ. Exp. Bot. 59 206–216. 10.1016/j.envexpbot.2005.12.006 - DOI
-
- Babu N. N., Krishnan S. G., Vinod K. K., Krishnamurthy S. L., Singh V. K., Singh M. P., et al. (2017). Marker aided incorporation of Saltol, a major QTL associated with seedling stage salt tolerance, into Oryza sativa ‘Pusa basmati 1121’. Front. Plant Sci. 8:41. 10.3389/fpls.2017.00041 - DOI - PMC - PubMed
-
- Ballou S. M., Yun K.-Y., Cheng C., De Los Reyes B. G. (2007). Cold sensitivity gradient in tuber-bearing Solanum based on physiological and transcript profiles. Crop Sci. 47 2027–2035. 10.2135/cropsci2007.01.0039sc - DOI
LinkOut - more resources
Full Text Sources
Other Literature Sources