. 2021 Feb 23:12:608017.
doi: 10.3389/fgene.2021.608017. eCollection 2021.

Identification of Core Genes Related to Progression and Prognosis of Hepatocellular Carcinoma and Small-Molecule Drug Predication

Affiliations

Identification of Core Genes Related to Progression and Prognosis of Hepatocellular Carcinoma and Small-Molecule Drug Predication

Nan Jiang et al. Front Genet. .

Abstract

Background: Hepatocellular carcinoma (HCC) is one of the most leading causes of cancer death with a poor prognosis. However, the underlying molecular mechanisms are largely unclear, and effective treatment for it is limited. Using an integrated bioinformatics method, the present study aimed to identify the key candidate prognostic genes that are involved in HCC development and identify small-molecule drugs with treatment potential.

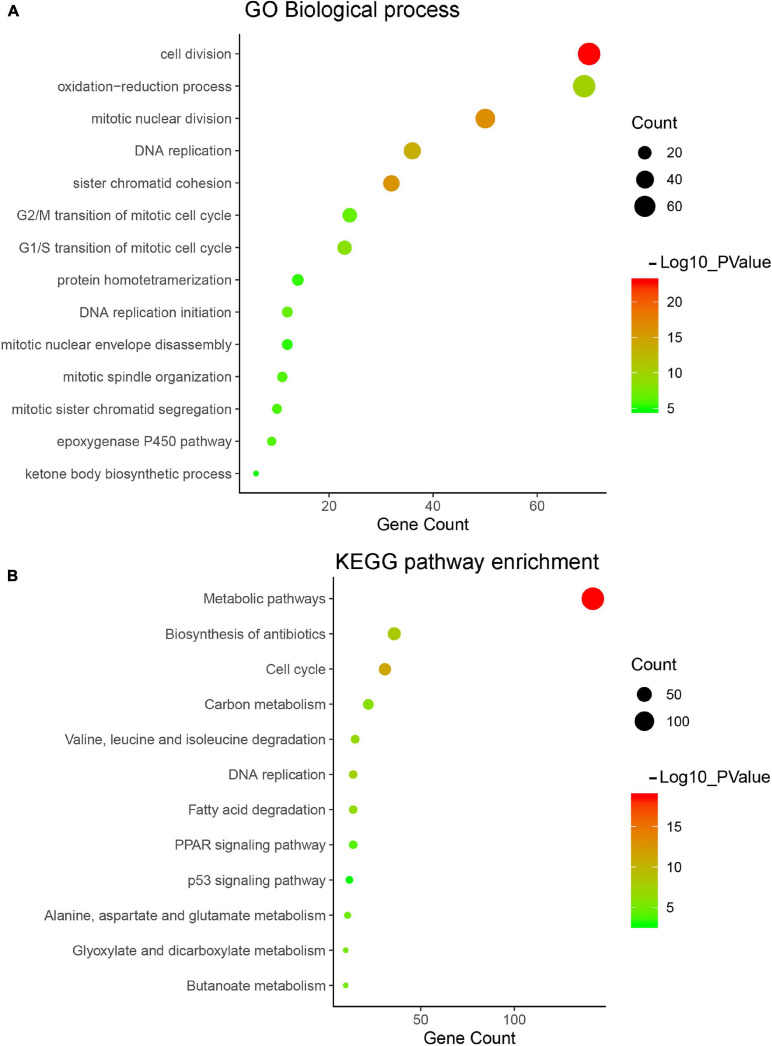
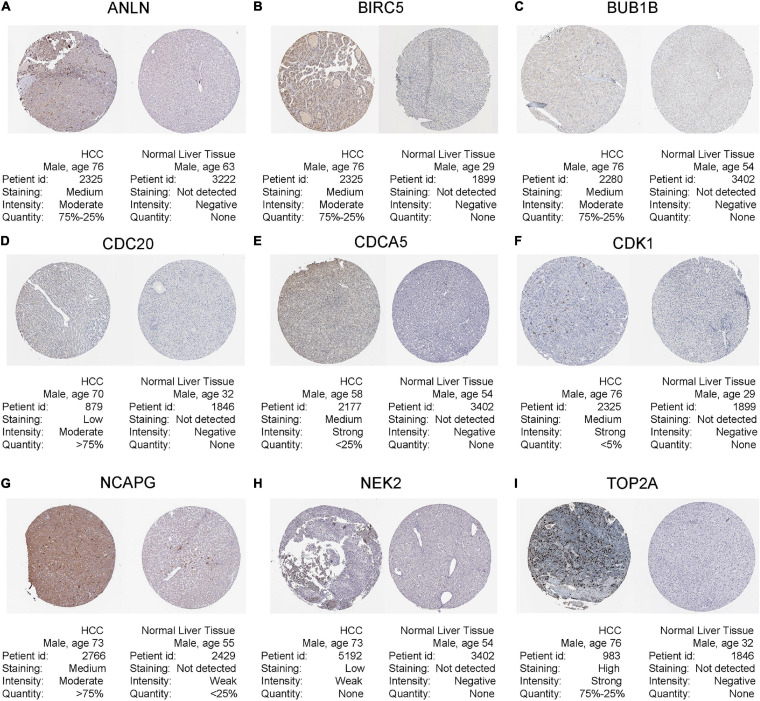
Methods and results: In this study, by using three expression profile datasets from Gene Expression Omnibus database, 1,704 differentially expressed genes were identified, including 671 upregulated and 1,033 downregulated genes. Then, weighted co-expression network analysis revealed nine modules are related with pathological stage; turquoise module was the most associated module. Gene Ontology (GO) and Kyoto Encyclopedia of Genes and Genomes pathway analyses (KEGG) indicated that these genes were enriched in cell division, cell cycle, and metabolic related pathways. Furthermore, by analyzing the turquoise module, 22 genes were identified as hub genes. Based on HCC data from gene expression profiling interactive analysis (GEPIA) database, nine genes associated with progression and prognosis of HCC were screened, including ANLN, BIRC5, BUB1B, CDC20, CDCA5, CDK1, NCAPG, NEK2, and TOP2A. According to the Human Protein Atlas and the Oncomine database, these genes were highly upregulated in HCC tumor samples. Moreover, multivariate Cox regression analysis showed that the risk score based on the gene expression signature of these nine genes was an independent prognostic factor for overall survival and disease-free survival in HCC patients. In addition, the candidate small-molecule drugs for HCC were identified by the CMap database.

Conclusion: In conclusion, the nine key gene signatures related to HCC progression and prognosis were identified and validated. The cell cycle pathway was the core pathway enriched with these key genes. Moreover, several candidate molecule drugs were identified, providing insights into novel therapeutic approaches for HCC.

Keywords: hepatocellular carcinoma; multivariate cox; prognosis; risk score; weighted gene co-expression network analysis.


Conflict of interest statement

The authors declare that the research was conducted in the absence of any commercial or financial relationships that could be construed as a potential conflict of interest.

Figures

FIGURE 1
FIGURE 1
Flowchart of data analysis procedure: data collection, processing, analysis, and validation.
FIGURE 2
FIGURE 2
Identification of the differentially expressed genes (DEGs) between hepatocellular carcinoma (HCC) samples and normal liver samples in three datasets. (A–C) The volcano plots show the DEGs in GSE6764 (A), GSE45267 (B), and GSE45436 (C), respectively. The green data points represent downregulated genes. The red data points represent upregulated genes. (D,E) Venn diagram demonstrates overlapped upregulated genes (D) and downregulated genes (E) in three datasets (| fold change| > 1.5 and adjusted P value < 0.05).
FIGURE 3
FIGURE 3
Construction of co-expression modules via weighted gene co-expression network analysis (WGCNA). (A) The hierarchy cluster dendrogram of module eigengenes. (B) The cluster dendrogram of the overlapped differential expression genes in GSE6764. Each piece of the leaves in the cluster dendrogram stands for a gene, and the colors below represent co-expression modules.
FIGURE 4
FIGURE 4
Weighted co-expression gene network construction and hub module selection. (A) The heatmap describes the topological overlap matrix (TOM) of all genes in weighted gene co-expression network analysis (WGCNA). Light yellow color represents a low overlap, and darker red represents higher overlap. (B) Eigengene dendrogram and eigengene adjacency heatmap depict the co-expression modules generated in the clustering analysis. (C) Heatmap of module-hepatocellular carcinoma (HCC) stage, red color for positive correlation, and blue color for negative correlation. (D) Scatter plot of module eigengenes based on genes in the turquoise module.
FIGURE 5
FIGURE 5
Gene Ontology (GO) and pathway enrichment analysis of turquoise module. (A) GO analysis of turquoise module genes. (B) Kyoto Encyclopedia of Genes and Genomes (KEGG) pathway analysis of turquoise module genes.
FIGURE 6
FIGURE 6
Kaplan–Meier plot of overall survival analysis of the nine key genes [hepatocellular carcinoma (HCC) data in Gene Expression Profiling Interactive Analysis (GEPIA) database, n = 364]. (A–I) Kaplan–Meier curves for overall survival in ANLN, BIRC5, BUB1B, CDC20, CDCA5, CDK1, NCAPG, NEK2, and TOP2A (P < 0.01).
FIGURE 7
FIGURE 7
Kaplan–Meier plot of disease-free survival analysis of the nine key genes [hepatocellular carcinoma (HCC) data in Gene Expression Profiling Interactive Analysis (GEPIA) database, n = 364]. (A–I) Kaplan–Meier curves for disease-free survival in ANLN, BIRC5, BUB1B, CDC20, CDCA5, CDK1, NCAPG, NEK2, and TOP2A (P < 0.01).
FIGURE 8
FIGURE 8
The mRNA expression levels of the nine key genes between normal liver samples and hepatocellular carcinoma (HCC) samples in Gene Expression Profiling Interactive Analysis (GEPIA) HCC database (n = 529). (A–I) ANLN, BIRC5, BUB1B, CDC20, CDCA5, CDK1, NCAPG, NEK2, and TOP2A are significantly increased in HCC samples compared with normal samples (P < 0.01).
FIGURE 9
FIGURE 9
Human Protein Atlas immunohistochemistry of normal sample (N) and tumor sample (T) using (A) anti-ANLN, (B) anti-BIRC5, (C) anti-BUB1B, (D) anti-CDC20, (E) anti-CDCA5, (F) anti-CDK1, (G) anti-NCAPG, (H) anti-NEK2, and (I) anti-TOP2A.
FIGURE 10
FIGURE 10
Verification the diagnostic performance of the nine key genes. Receiver operating characteristic (ROC) curves were generated to verify the capacity to differentiate tumor sample from normal sample, showing excellent specificity and sensitivity in The Cancer Genome Atlas (TCGA) hepatocellular carcinoma (HCC) dataset. (A) ANLN, (B) BIRC5, (C) BUB1B, (D) CDC20, (E) CDCA5, (F) CDK1, (G) NCAPG, (H) NEK2, and (I) TOP2A.
FIGURE 11
FIGURE 11
Survival analysis of the nine-gene risk score in validation datasets [The Cancer Genome Atlas (TCGA)]. (A,B) Kaplan–Meier overall survival (A) and disease-free survival (B) curves for patients in TCGA datasets divided into high- and low-risk groups according to the risk score. Patients with a high-risk score showed poorer overall survival and disease-free survival in TCGA hepatocellular carcinoma (HCC) cohorts. Receiver operating characteristic (ROC) curves exhibited the predictive value of the risk signature for HCC patients in TCGA datasets on overall survival (C) and disease-free survival (D).
FIGURE 12
FIGURE 12
Genetic alterations of the nine key genes in The Cancer Genome Atlas (TCGA)-Hepatocellular Carcinoma (HCC). (A) A detailed genetic alteration chart of the nine key genes showing there were 130 (36.11%) genetic alterations in 360 HCC samples. (B) The total alteration frequency summary of the nine key genes in TCGA-HCC.

Similar articles

Cited by

References

    1. Bai J., Li Y., Zhang G. (2017). Cell cycle regulation and anticancer drug discovery. Cancer Biol. Med. 14 348–362. 10.20892/j.issn.2095-3941.2017.0033 - DOI - PMC - PubMed
    1. Bao C., Lu Y., Chen J., Chen D., Lou W., Ding B., et al. (2019). Exploring specific prognostic biomarkers in triple-negative breast cancer. Cell Death Dis. 10:807. 10.1038/s41419-019-2043-x - DOI - PMC - PubMed
    1. Bray F., Ferlay J., Soerjomataram I., Siegel R. L., Torre L. A., Jemal A. (2018). Global cancer statistics 2018: GLOBOCAN estimates of incidence and mortality worldwide for 36 cancers in 185 countries. CA Cancer J. Clin. 68 394–424. 10.3322/caac.21492 - DOI - PubMed
    1. Cerami E., Gao J., Dogrusoz U., Gross B. E., Sumer S. O., Aksoy B. A., et al. (2012). The cBio cancer genomics portal: an open platform for exploring multidimensional cancer genomics data. Cancer Discov. 2 401–404. 10.1158/2159-8290.Cd-12-0095 - DOI - PMC - PubMed
    1. Chang D. Z., Ma Y., Ji B., Liu Y., Hwu P., Abbruzzese J. L., et al. (2012). Increased CDC20 expression is associated with pancreatic ductal adenocarcinoma differentiation and progression. J. Hematol. Oncol. 5:15. 10.1186/1756-8722-5-15 - DOI - PMC - PubMed

LinkOut - more resources