. 2021 Feb 27;13(2):187-217.
doi: 10.4254/wjh.v13.i2.187.

Adult human liver slice cultures: Modelling of liver fibrosis and evaluation of new anti-fibrotic drugs

Affiliations

Adult human liver slice cultures: Modelling of liver fibrosis and evaluation of new anti-fibrotic drugs

Daria Kartasheva-Ebertz et al. World J Hepatol. .

Abstract

Background: Liver fibrosis can result in end-stage liver failure and death.

Aim: To examine human liver fibrogenesis and anti-fibrotic therapies, we evaluated the three dimensional ex vivo liver slice (LS) model.

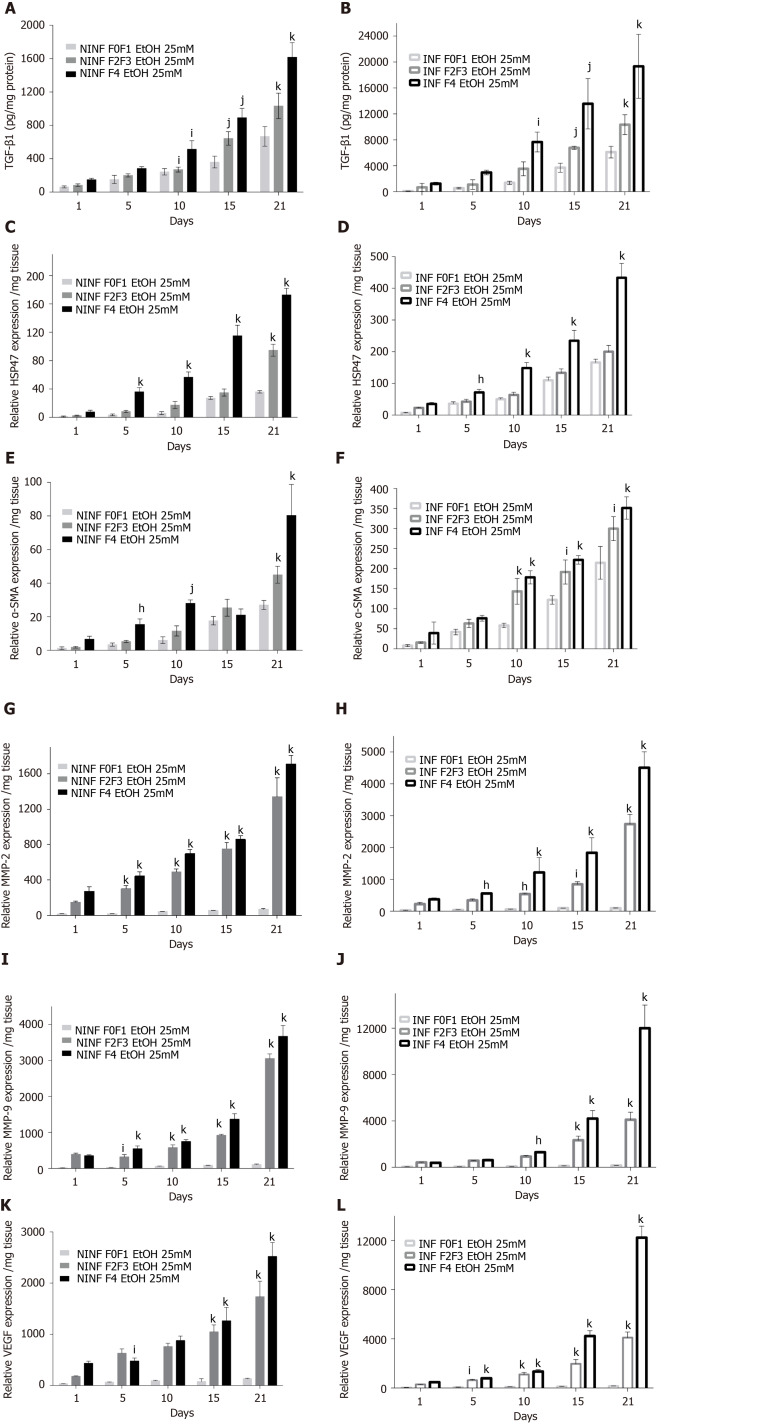
Methods: Fibrotic liver samples (F0 to F4 fibrosis stage according to the METAVIR score) were collected from patients after liver resection. Human liver slices (HLS) were cultivated for up to 21 days. Hepatitis C virus (HCV) infection, alcohol (ethanol stimulation) and steatosis (palmitate stimulation) were examined in fibrotic (F2 to F4) liver slices infected (or not) with HCV. F0-F1 HLS were used as controls. At day 0, either ursodeoxycholic acid (choleretic and hepatoprotective properties) and/or α-tocopherol (antioxidant properties) were added to standard of care on HLS and fibrotic liver slices, infected (or not) with HCV. Expression of the biomarkers of fibrosis and the triglyceride production were checked by quantitative reverse transcription polymerase chain reaction and/or enzyme-linked immunosorbent assay.

Results: The cultures were viable in vitro for 21 days allowing to study fibrosis inducers and to estimate the effect of anti-fibrotic drugs. Expression of the biomarkers of fibrosis and the progression to steatosis (estimated by triglycerides production) was increased with the addition of HCV and /or ethanol or palmitate. From day 15 of the follow-up studies, a significant decrease of both transforming growth factor β-1 and Procol1A1 expression and triglycerides production was observed when a combined anti-fibrotic treatment was applied on HCV infected F2-F4 LS cultures.

Conclusion: These results show that the human three dimensional ex vivo model effectively reflects the in vivo processes in damaged human liver (viral, alcoholic, nonalcoholic steatohepatitis liver diseases) and provides the proof of concept that the LS examined model permits a rapid evaluation of new anti-fibrotic therapies when used alone or in combination.

Keywords: Alcoholic liver disease; Drugs; Ex vivo model; Hepatitis C virus; Human liver fibrosis; Nonalcoholic steatohepatitis.


Conflict of interest statement

Conflict-of-interest statement: No conflict of interest to declare indicated in the manuscript.

Figures

Figure 1
Figure 1
Experimental set up of the different liver slice treatments during the cultures. NINFLS: Non-infected liver slices; EtOH: Ethanol; LS: Liver slices; Toco: Tocopherol; UCDA: Ursodeoxycholic acid; HCV: Hepatitis C virus.
Figure 2
Figure 2
Maintenance of phenotypic characteristics of human non-fibrotic (F0-F1), and fibrotic (F2-F3, F4) liver slices during the culture, demonstrated by histochemistry, real-time reverse transcription-quantitative polymerase chain reaction and biochemical assays. A: Light microscopy of human liver tissue 7 µm-thick section stained with hematoxylin and eosin showing non-fibrotic (F2-F3) liver lobular architecture on day 15, magnification × 20. Scale bars 100 µm; B: Representative human liver tissue 7 µm-thick sections from fibrotic (F2-F3) liver patient showing immunostaining for Ki67, a proliferation marker, on day 15, magnification × 40, Scale bars, 20 µm; C: Representative human liver tissue 7 µm-thick sections from fibrotic (F2-F3) liver patient showing immunostaining with isotype as negative control, on day 15, magnification × 40, Scale bars, 20 µm; D: Hepatocyte-specific gene mRNA expression (relative expression/mg tissue) during the 21 days follow up studies. Maintenance of hepatocyte-specific gene expression patterns in human non-fibrotic (F0-F1) non-infected liver slices during culture. The real-time reverse transcription-quantitative polymerase chain reaction analyses were performed from five independent human non-fibrotic (F0-F1) livers using slices in triplicate from each liver. All liver-specific gene expression values were normalized to 18S RNA as an internal standard and expressed relative to the zero-time point. Values are expressed as mean ± standard errors. The results were compared using the two-paired Student’s t-test: Albumin: aP < 0.0001; CYP2E1: eP < 0.001; CYP3A4: fP < 0.0003; HNF1-β: gP < 0.01; HNF4-α: oP < 0.008; E and F: Biochemical functional assays; E: Albumin production (pg x 100/mg tissue/hour) during the 21 days follow up studies; and F: Urea production (pg/mg tissue/hour) during the 21 days follow up studies. Studies were done in triplicate and repeated twice for each liver sample. Values are expressed as means ± standard errors (n = 5). The results were compared using the two-paired Student’s t-test: albumin production (pP < 0.02), urea production (eP < 0.001).
Figure 3
Figure 3
Maintenance of phenotypic characteristics of human non-fibrotic (F0-F1) hepatitis C virus-infected liver slices during the culture, demonstrated by real-time reverse transcription-quantitative polymerase chain reaction and biochemical assays. A: Hepatocyte-specific gene mRNA expression (relative expression/mg tissue) during the 21 days follow up studies. Maintenance of hepatocyte-specific gene expression patterns in human non-fibrotic (F0-F1) hepatitis C virus (HCV) infected liver slices during the culture. The real-time reverse transcription-quantitative polymerase chain reaction analyses were performed from five independent human non-fibrotic (F0-F1) liver samples, using HCV- infected slices in triplicate from each liver. Liver slices were infected with HCVcc, on day 0, at MOI = 0.1. All liver–specific gene expression values were normalized to 18S RNA as an internal standard and expressed in relation to the zero-time point. Values are expressed as mean ± standard errors. The results were compared using the two-paired Student’s t-test: Albumin, aP < 0.0001; CYP2E1: aP < 0.0001; CYP3A4: aP < 0.0001; HNF1-β: aP < 0.0001; HNF4-α: aP < 0.0001); B and C: Biochemical functional assays: B: Albumin production (pg x 100/mg tissue/ hour) during the 21d- follow up studies (days). C: Urea production (pg/mg tissue/hour during the 21d- follow up studies (days) by human F0-F1 cultured HCV-infected liver slices (n = 5). The assays were performed as previously described[11,12]. Studies were performed in triplicate and repeated twice for each liver sample. Values are expressed as means ± standard errors (n = 5). The results were compared using the two-paired Student’s t-test: Albumin production: eP < 0.001; urea production: aP < 0.0001.
Figure 4
Figure 4
Viability of human non-fibrotic (F0-F1), and fibrotic (F2-F3, F4) non-infected or hepatitis C virus-infected liver slices during the different kinetic studies, with no treatment cytotoxicity as shown by ATP and LDH dosages. A: Percentage of ATP synthesis/total protein in non-infected (NINF) liver slice (LS) with F0-F1 to F4 stage fibrosis during the 21 days-follow up kinetics; B: The percentage of LDH release/control in NINF LS with a F0-F1 to F4 stage fibrosis during the 21d-follow up kinetics (d: days); C and D: The percentage of ATP synthesis /total protein in F0-F1 NINF and hepatitis C virus (HCV)-infected (INF) LS treated with 1 mmol/L, 5 mmol/L and 25 mmol/L of EtOH during the 21d-follow up kinetics; E: The percentage of ATP synthesis / total protein in the presence of 25 mmol/L of EtOH on F0-F1 NINF and INF LS during the 21d-follow up kinetics; F: LDH release (% of control) in F0-F1 non-infected LS cultures treated or non-treated with 25 mmol/L of EtOH compared to F4 non-infected treated or non-treated with 25 mmol/L of EtOH during the 21d-follow up kinetics. Values are expressed as means ± standard errors (SEMs), (n = 5). aP < 0.0001 time factor; bP < 0.01 fibrosis stage; cP < 0.05 fibrosis stage; dP < 0.05 alcohol factor; iP < 0.01 subject vs control (non-treated) (two-way ANOVA test).There is no significant toxic effect of EtOH (25 mmol/L) on F0-F1 NINF and INF LS and F2-F3, F4 NINF LS; G: The percentage of ATP synthesis/total protein during the 21-follow up kinetics showing the viability of F0-F1 NINF or INF LS cultures with or without the presence of palmitate (500 µmol/L); H and I: Absence of drug cytotoxicity (LDH release, (% of control) ) on the viability of human F0-F4 LS NINF or infected (INF) by HCVcc Con1/C3 during the treatment with either UCDA (UA) or Toco or both for 21 days. It is important to note that under 150%, there is no cytotoxic effect of the drugs on LS viability. Values are expressed as means ± SEMs, (n = 5); J and K: The percentage of ATP synthesis / total protein during the 21 days follow up kinetics, in F0-F1 to F4 NINF or infected (INF) LS with combined treatment [Toco + UCDA (UA)]. Values are expressed as means ± SEMs, (n = 5); Levels of significance are as follows between: Subject vs control, kP < 0.0001; jP < 0.001; iP < 0.01; hP < 0.05) (two-way ANOVA test).
Figure 5
Figure 5
Efficient replication of hepatitis C virus RNA, and hepatitis C virus core and NS3 proteins expression in human F0-F1 liver slice culture as shown by real-time reverse transcription-quantitative polymerase chain reaction and western blotting analysis. A: Quantification of intracellular levels of positive- and negative-strand hepatitis C virus (HCV) RNA (log10 copies/µg total RNA/mg tissue) in primary human F0-F1 HCVcc Con1/C3 -infected liver slice (LS) by specific- strand real-time reverse transcription-quantitative polymerase chain reaction on day 5, day 10, day 15 and day 21 post-infection. Values are expressed as mean ± SEMs. All results were compared using the two-paired Student t-test, time factor: Positive strand: gP < 0.01; negative strand: qP < 0.04, (n = 3). Detection of the negative strand of HCV RNA evidences active replication as well as an increase over time of both positive and negative strands of HCV RNA; B: Western blotting analysis of human F0-F1 HCVcc Con-1/C3 -infected LS lysates with mAbs against HCV NS3 or core proteins on day 5, day 10, day 15, and day 21, post-infection (MOI = 0.1) was performed and analyzed (n = 3). Lysates of naïve human F0-F1 LS lysates were run in parallel to serve as a negative controls (NI). β-actin was used as a loading control; C: Normalization of Core and NS3 protein expression compared to b-actin expression (Normalized protein / β-actin) during the 21 days follow-up kinetics using the image quantification standard software, ImageJ2[21]. The position of molecular-weight markers is indicated in kDa. Values are expressed as means ± SEMs (n = 3): Core rP < 0.002; NS3 sP < 0.02 (two-paired Student t-test); D: Production of HCV infectious particles (genotype 1b) in primary adult human F0-F1 LS: Infectivity titers [i.e., infectivity (ffu/mL/mg tissue)] of culture supernatants from human F0-F1 LS infected by the Con1/C3 virus during the 21 days follow up kinetics. The curve represents the average of three independent infections from 3 different donors. Each kinetic study was performed in triplicate. Values are expressed as means ± SEMs. Results were compared using the two-paired Student t-test: sP < 0.02; and E: Infectivity titers [i.e., infectivity (ffu/mL/mg tissue)] of culture supernatants of naive F0-F1 LS infected with supernatants from human F0- F1 HCV-infected LS culture (HCVpc) during the 21 days follow up kinetics. The infection of naive F0-F1 LS with supernatants from human F0-F1 HCV-infected LS culture (HCVpc) clearly indicates the infectivity of extracellular viral particles, which are produced by HVCcc Con1/ C3 (genotype 1b) infection. Values are expressed as means ± SEMs (n = 3). Levels of significance: eP < 0.001 (two-paired Student t-test).
Figure 6
Figure 6
Real-time reverse transcription-quantitative polymerase chain reaction analysis evidencing the significant increase of fibrosis markers expression at the transcriptional level in human F0-F1 non-infected or hepatitis C virus infected liver slice during the kinetics. A: TGF-β1 expression at mRNA level (relative RNA expression / mg tissue) during 21 days follow up kinetics; B: TGF-β1 expression at intracellular protein level (pg/mg protein) during 21 days follow up kinetics; C: TGF-β1 expression at extracellular secretion level (pg/mL) during 21 days follow up kinetics; D-F: mRNA expression (relative RNA expression / mg tissue) of (D) α-SMA, HSP47 (E) and ProCOL1A1 (F) during 21 days follow up kinetics; G and H: MMP-2 and MMP-9 mRNA expression (relative RNA expression / mg tissue) during 21 days follow up kinetics; I: VEGF mRNA expression (relative RNA expression/mg tissue) during 21 days follow up kinetics; J: Triglyceride production (µg/mg protein) raised during the during the 21 days follow up kinetics. All data are presented considering the percentage of viable liver slices in culture. Data are expressed as means ± SD (n = 5), subject vs control, hP < 0.05; iP < 0.01; jP < 0.001; kP < 0.0001, (two-way ANOVA test).
Figure 7
Figure 7
Real-time reverse transcription-quantitative polymerase chain reaction analyses of RNA expression of liver fibrosis markers (TGF-β1, Procol1A1, α-SMA, HSP47, MMP-2, MMP-9, VEGF), and triglyceride production in non-infected or hepatitis C virus infected liver slice cultures from fibrotic liver (F2-F3, F4) showing a significant increase during the kinetics. A: TGF-β1 mRNA Expression (relative RNA expression/mg tissue) during 21 days follow up kinetics; B: Triglyceride production (µg/mg protein); C–E: Procol1A1, α-SMA, HSP47 mRNA expression (relative RNA expression / mg tissue) during 21 days follow up kinetics; F- H: MMP-2, MMP-9 and VEGF mRNA expression (relative RNA expression/mg tissue) during 21 days follow up kinetics. Data are expressed as mean± SD (F2-F3 liver samples, n = 2, F4 liver samples, n = 2). bP < 0.01 fibrosis stage factor; mP < 0.001 Infection factor; lP < 0.0001 infection factor; (two-way ANOVA test); I: TGF-β1, HSP-47, Collagen I alpha 1, MMP-9, MMP-2, a-SMA, VEGF proteins expression in F2-F3 liver slice performed in western blotting and normalized. Positions of molecular-weight markers are indicated in kDa; J: Normalization of the proteins expression compared to β-actin expression (Normalized protein/b-actin) during the 21 days follow-up kinetics using the image quantification standard software, ImageJ2; and K: Representative human liver tissue 7 µm-thick sections from F2-F3 liver patient showing immunohistochemistry staining for fibrosis markers, TGF-β1 (a), α-SMA (b), MMP-9 (c) on day 10, magnification 20×, Scale bars, 100 µm; 40×, Scale bars 50 µm; 10×, Scale bars 100 µm, respectively. (d-f) isotypes controls staining, magnification 10×, Scale bars, 100 µm; 40×, Scale bars 20 µm; 10×, Scale bars 200 µm, respectively.
Figure 8
Figure 8
Significant increased expression of TGF-β1 and Procol1A1 mRNA with ethanol (1 mmol/L, 5 mmol/L, 25 mmol/L) treatment of non-infected or hepatitis C virus INF liver slice cultures from non-fibrotic (F0-F1) and ethanol (25 mmol/L) treatment of non-infected or hepatitis C virus infected liver slice cultures from fibrotic (F2-F3, F4) liver samples as shown by real-time reverse transcription-quantitative polymerase chain reaction and ELISA and histochemistry. A and B: TGF-β1 mRNA expression (relative RNA expression / mg tissue) during 21 days follow up kinetics with ethanol (EtOH) (1 mmol/L, 5 mmol/L, 25 mmol/L) treatment in non-infected (NINF) or hepatitis C virus (HCV) INF liver slice (LS) cultures from non-fibrotic (F0-F1); C and D: Extracellular TGF-β1 protein expression (pg/mL) during 21 days follow up kinetics, with EtOH (1 mmol/L, 5 mmol/L, 25 mmol/L) treatment of NINF or HCV INF LS cultures from non-fibrotic (F0-F1); E and F: Procol1A1 mRNA expression (relative RNA expression/mg tissue) during 21 days follow up kinetic, with EtOH (1 mmol/L, 5 mmol/L, 25 mmol/L) treatment of NINF or HCV INF LS cultures from non-fibrotic (F0-F1); G and H: TGF-β1 mRNA expression (relative RNA expression/mg tissue) during 21 days follow up kinetics, in fibrotic (F2-F3, F4) NINF and HCV INF LS treated with 25 mmol/L of EtOH compared to F0F1 NINF or HCV INF LS cultures in presence of the 25 mmol/L EtOH; I and J: Extracellular TGF-β1 protein expression (pg/mL) during 21 days follow up kinetics, in fibrotic (F2-F3, F4) NINF and HCV INF LS after treatment with 25 mmol/L of EtOH compared to F0F1 NINF or HCV INF LS cultures in presence of 25 mmol/L EtOH; K and L: Relative Procol1A1 mRNA expression (relative RNA expression/mg tissue) during 21 days follow up kinetics, in fibrotic (F2-F3, F4) NINF and HCV INF LS treated with 25 mmol/L of EtOH compared to F0F1 NINF or HCV INF LS cultures in presence of 25 mmol/L EtOH. Data are expressed as means ± SEM (F0-F1, n = 5; F2-F3, n = 2; F4, n = 2). kP < 0.0001 subject vs control (non-treated); jP < 0.001 subject vs control (non-treated); iP < 0.01 subject vs control (non-treated), hP < 0.05 subject vs control (non-treated) (two-way ANOVA test); M: Significant increase of collagen deposition (% of collagen deposition) in F0-F1 HCV INF LS treated with 5 mmol/L of EtOH (E5) on day 6 (D6) compared to day 1 (D1); N: No significant change of collagen deposition (% of collagen deposition) in F0-F1 non-infected (NINF) LS treated with 5 mmol/L of EtOH (E5) on day 6 (D6) compared to day 1 (D1). Data are expressed as means ± SEM (n = 8). iP < 0.01 subject vs control (non-treated), (unpaired two-tailed Student’s t-test). Magnification 20X, Scale bars 100 µm.
Figure 9
Figure 9
Significantly increase in TGF-β1 protein and RNA expression of α-SMA, and HSP47 in non-infected or hepatitis C virus-infected non-fibrotic (F0-F1) liver slice cultures treated with 1 mmol/L, 5 mmol/L and 25 mmol/L of ethanol was shown by enzyme-linked immunosorbent assay and real-time reverse transcription-quantitative polymerase chain reaction analyses. A and B: TGF-β1 intracellular protein expression (pg/mg protein) during 21 days follow up kinetics, in non-infected (A) and hepatitis C virus (HCV)-infected (B) F0-F1 liver slice (LS) cultures, treated with 1 mmol/L, 5 mmol/L, 25 mmol/L of ethanol (EtOH); C and D: Relative α-SMA RNA expression level (relative RNA expression/mg tissue) during 21 days follow up kinetics, in non-infected (C) and HCV-infected (D) F0-F1 LS cultures treated with 1 mmol/L, 5 mmol/L, 25 mmol/L of EtOH; E and F: Relative HSP47 RNA expression level expression (relative RNA expression / mg tissue) during 21 days follow up kinetics, in non-infected (E) and HCV-infected (F) F0-F1 LS cultures treated with 1 mmol/L, 5 mmol/L, 25 mmol/L of EtOH. All presented data take into account the viability of the liver slice cultures. Values are expressed as means ± SEMs (n = 5); Levels of significance: kP < 0.0001 subject vs control (non-treated); jP < 0.001 subject vs control (non-treated); iP < 0.01 subject vs control (non-treated), hP < 0.05 subject vs control (non-treated) (two-way ANOVA test).
Figure 10
Figure 10
By real-time reverse transcription-quantitative polymerase chain reaction and enzyme-linked immunosorbent assay, significantly increase of TGF-β1 protein and RNA expression of fibrosis biomarkers HSP47, α-SMA, MMP- 2, MMP-9, VEGF increased in non-infected or hepatitis C virus-infected liver slice cultures from stages F0-F1 to stage F4 treated with 25 mmol/L of ethanol. A and B: TGF-β1 intracellular protein expression (pg/mg protein) during the 21 days follow up kinetics, in F0-F1 to F4 non-infected (A) and hepatitis C virus (HCV)-infected (B) liver slice (LS), treated with 25 mmol/L of ethanol (EtOH); C and D: Relative HSP47 RNA expression (relative RNA expression/mg tissue) during the 21 days follow up kinetics, in F0-F1 to F4 non-infected (C) and HCV infected (D) LS treated with 25 mmol/L of EtOH; E and F: Relative α-SMA RNA expression (relative RNA expression / mg tissue) during the 21 days follow up kinetics, in F0-F1 to F4 non-infected (E) and HCV-infected (F) LS treated with 25 mmol/L of EtOH; G and H: Relative MMP-2 RNA expression (relative RNA expression / mg tissue) during the 21 days follow up kinetics, in F0-F1 to F4 non-infected (G) and HCV-infected (H) LS cultures treated with 25 mmol/L of EtOH; I and J: Relative MMP-9 RNA expression (relative RNA expression / mg tissue) during the 21 days follow up kinetics, in F0-F1 to F4 non-infected (I) and HCV-infected (J) LS treated with 25 mmol/L of EtOH; K and L: Relative VEGF RNA expression (relative RNA expression/mg tissue) during the 21 days follow up kinetics, in F0-F1 to F4 non-infected (K) and HCV-infected (L) LS cultures treated with 25 mmol/L of EtOH. Values are expressed as mean ± SEMs (F0-F1: n = 5; F2-F3, n = 2; F4, n = 2). kP < 0.0001 subject vs control (F0-F1); jP < 0.001 subject vs control (F0-F1); iP < 0.01 subject vs control (F0-F1), hP < 0.05 subject vs control (F0-F1) (two-way ANOVA test).
Figure 11
Figure 11
Significant increase of intracellular triglyceride production and RNA expression of fibrosis liver markers in non-fibrotic (F0-F1) hepatitis C virus INF liver slice cultures treated with palmitate (500 µmol/L) compared to non-infected and non-treated liver slice showed by enzyme-linked immunosorbent assay and real-time reverse transcription-quantitative polymerase chain reaction analyses, respectively. A: Triglyceride production (µg/mg protein) during the 21 days follow up kinetics: Non-significant production in hepatitis C virus (HCV) INF liver slice (LS) compared to non-infected (NINF) LS: (ns NINF vs INF); significant increase in HCV INF LS treated with palmitate compared to NINF; B: Significant increase of TGF-β1 mRNA expression (Relative RNA expression /mg tissue) during the 21 days follow up kinetics, in HCV INF LS compared to NINF LS and in HCV INF LS treated with palmitate compared to NINF; C and D: (C) Intracellular (pg/mg protein) and (D) extracellular (pg/mL) TGF-β1 protein production during the 21 days follow up kinetics, measured by enzyme-linked immunosorbent assay assays, in F0-F1 NINF and HCV INFLS cultures treated or non-treated with palmitate; Significant increase in HCV INF LS compared to NINF LS; Significant increase in HCV INF LS treated with palmitate compared to NINF; E-G: Intracellular mRNA expression (Relative RNA expression /mg tissue) of the Procol1A1 (E), α-SMA (F), HSP47 (G) during the 21 days follow up kinetics: Significant increase in HCV INF LS compared to NINF LS; Significant increase in HCV INF LS treated with palmitate compared to NINF LS. Data are expressed as mean± SEM (F0-F1, n = 5); lP < 0.0001 infection factor; mP < 0.001 infection factor; nP < 0.0001 palmitate factor (two-way ANOVA test).
Figure 12
Figure 12
Significant increase of matrix metalloproteinases -2, -9, and vascular endothelial growth factor RNA expression after treatment of F0-F1 non-infected and infected liver slice cultures with palmitate (500 µmol/L). Biomarker expression estimated by real-time reverse transcription-quantitative polymerase chain reaction. A: Matrix metalloproteinases (MMP)- 2, MMP-9 and vascular endothelial growth factor mRNA expression (relative expression /mg tissue) during the 21 days follow up kinetics, in F0-F1 non-infected liver slice (LS) cultures treated without or with palmitate (500 µmol/L); B: MMP- 2, MMP-9 and vascular endothelial growth factor mRNA expression (relative expression /mg tissue) during the 21 days follow up kinetics, in F0-F1 infected LS cultures treated without or with palmitate (500 µmol/L). Real-time reverse transcription-quantitative polymerase chain reaction experiments were performed with five independent human F0-F1 liver samples (n = 5). LS were obtained in triplicate for each liver sample, at each time point in the kinetic studies. Values are expressed as means ± standard errors (n = 5). Levels of significance were as follows: jP < 0.001 subject vs control (non-treated palmitate), (two-way ANOVA test).
Figure 13
Figure 13
During treatment with alpha-Tocopherol and ursodeoxycholic acid in combination, significant inhibition of the TGF-β1 mRNA expression of fibrotic (F2-F3, F4) hepatitis C virus INF liver slice cultures from day 5 and significant reduction of Procol1A1 mRNA expression and the triglyceride production in F0 to F4 non-infected and hepatitis C virus INF liver slice cultures during the follow-up kinetics, as evidenced the real-time reverse transcription-quantitative polymerase chain reaction analysis and enzyme-linked immunosorbent assays, respectively. A and B: TGF-β1 mRNA expression (relative TGF-β1 expression /mg tissue) during the 21 days follow up kinetics, in α-Tocopherol (Toco) treated liver slice (LS); C and D: TGF-β1 mRNA expression (relative TGF-β1 expression /mg tissue) during the 21 days follow up kinetics, in ursodeoxycholic acid (UCDA) treated LS; E and F: TGF-β1 mRNA expression (relative TGF-β1 expression /mg tissue) during the 21 days follow up kinetics, in LS during the combined treatment, Toco + UCDA. Data are expressed as means ± SEM (F2-F3 liver samples, n = 2; F4 liver samples, n = 2). kP < 0.0001 subject vs control (non-treated); jP < 0.001 subject vs control (non-treated); iP < 0.01 subject vs control (non-treated), hP < 0.05 subject vs control (non- treated) (two-way ANOVA test); G and H: Procol1A1 mRNA expression (relative Procol1A1 expression /mg tissue) during the 21 days follow up kinetics, in LS during the combined treatment, Toco + UCDA. Data are expressed as means ± SEM (F0-F1 liver samples, n = 10; F2-F3 liver samples, n = 2; F4 liver samples, n = 2). kP < 0.0001 subject vs control (non-treated); jP < 0.001 subject vs control (non-treated); iP < 0.01 subject vs control (non-treated), hP < 0.05 subject vs control (non-treated); (two-way ANOVA test); I and J: Triglyceride production (µg/mg protein) during the 21 days follow-up kinetics, in NINF and hepatitis C virus INF LS from F0-F1 to F4 LS cultures significantly reduced by the combined treatment [Toco + UCDA (UA)], more particularly from day 15 in F4 hepatitis C virus infected LS cultures. Data are expressed as means ± SEM (F0-F1, n = 5, F2-F3 liver samples, n = 2; F4 liver samples, n = 2). kP < 0.0001 subject vs control (non- treated); jP < 0.001 subject vs control (non-treated); iP < 0.01 subject vs control (non-treated), hP < 0.05 subject vs control (non-treated) (two-way ANOVA test).

References

    1. Mehal WZ, Iredale J, Friedman SL. Scraping fibrosis: expressway to the core of fibrosis. Nat Med. 2011;17:552–553. - PMC - PubMed
    1. Blachier M, Leleu H, Peck-Radosavljevic M, Valla DC, Roudot-Thoraval F. The burden of liver disease in Europe: a review of available epidemiological data. J Hepatol. 2013;58:593–608. - PubMed
    1. Karsdal MA, Manon-Jensen T, Genovese F, Kristensen JH, Nielsen MJ, Sand JM, Hansen NU, Bay-Jensen AC, Bager CL, Krag A, Blanchard A, Krarup H, Leeming DJ, Schuppan D. Novel insights into the function and dynamics of extracellular matrix in liver fibrosis. Am J Physiol Gastrointest Liver Physiol. 2015;308:G807–G830. - PMC - PubMed
    1. Fabregat I, Moreno-Càceres J, Sánchez A, Dooley S, Dewidar B, Giannelli G, Ten Dijke P IT-LIVER Consortium. TGF-β signalling and liver disease. FEBS J. 2016;283:2219–2232. - PubMed
    1. van Agthoven M, Metselaar HJ, Tilanus HW, de Man RA, IJzermans JN, Martin van Ineveld BM. A comparison of the costs and effects of liver transplantation for acute and for chronic liver failure. Transpl Int. 2001;14:87–94. - PubMed