. 2020 Nov;10(1):e12023.
doi: 10.1002/jev2.12023. Epub 2021 Jan 9.

An implanted device enables in vivo monitoring of extracellular vesicle-mediated spread of pro-inflammatory mast cell response in mice

Affiliations

An implanted device enables in vivo monitoring of extracellular vesicle-mediated spread of pro-inflammatory mast cell response in mice

Krisztina V Vukman et al. J Extracell Vesicles. 2020 Nov.

Abstract

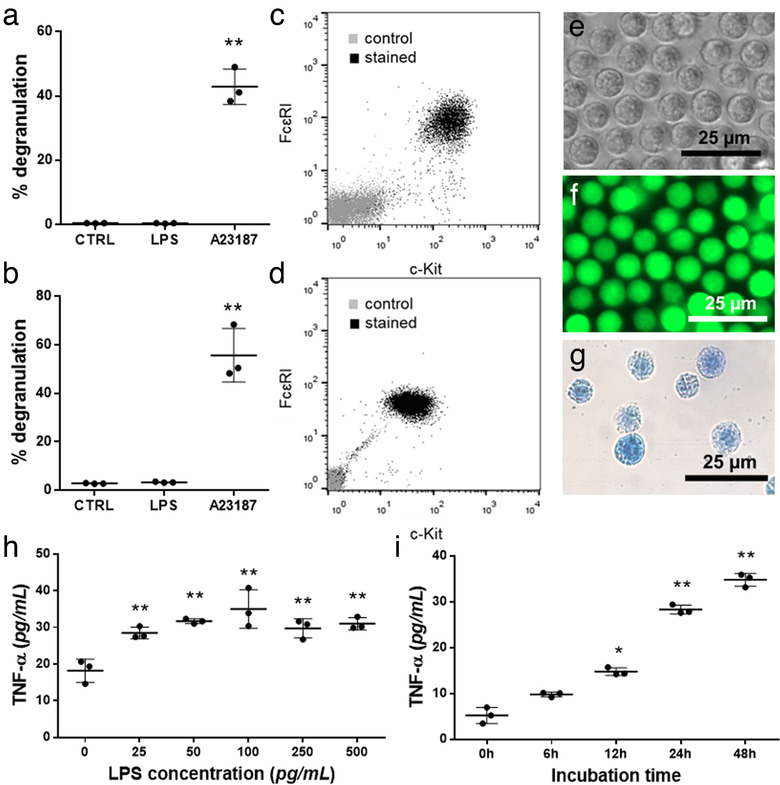
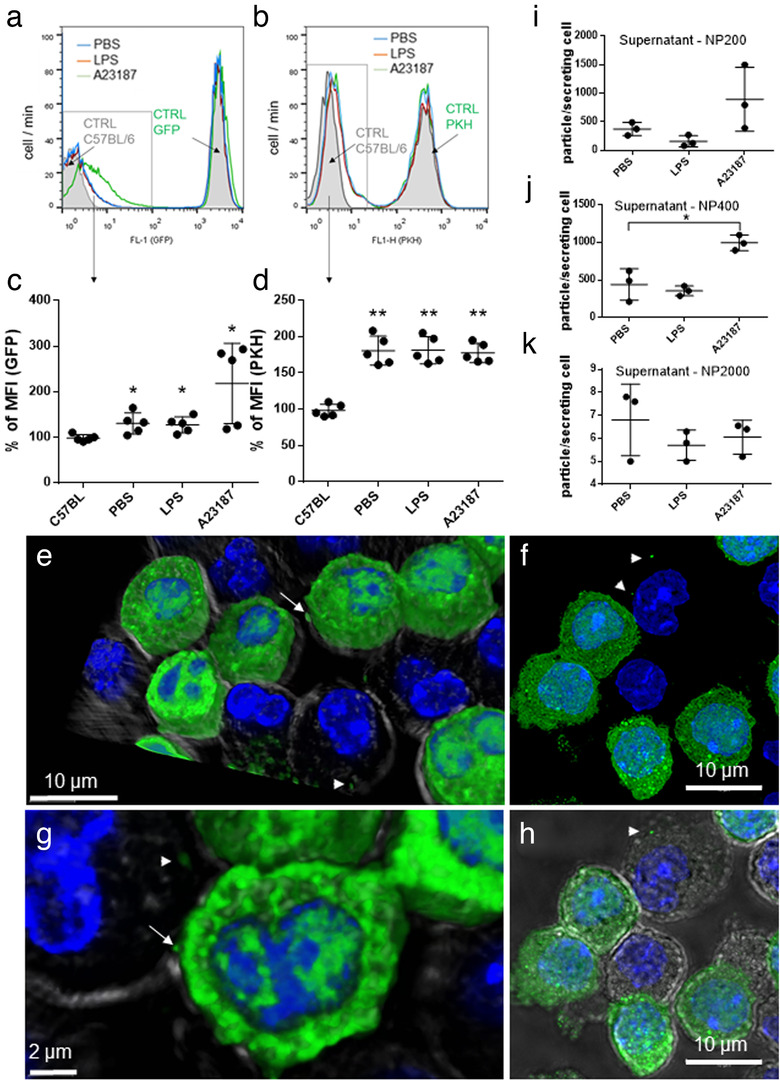
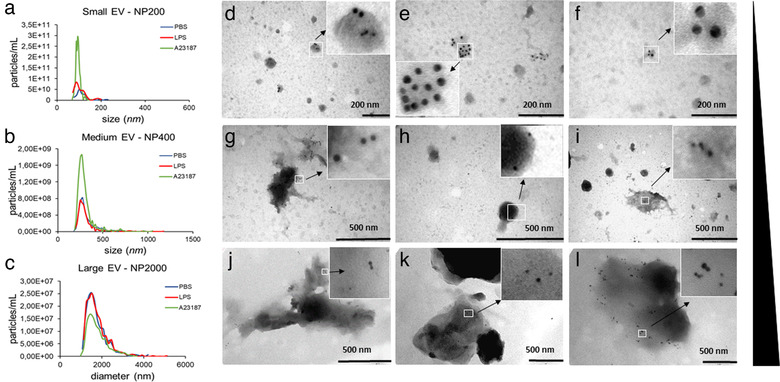
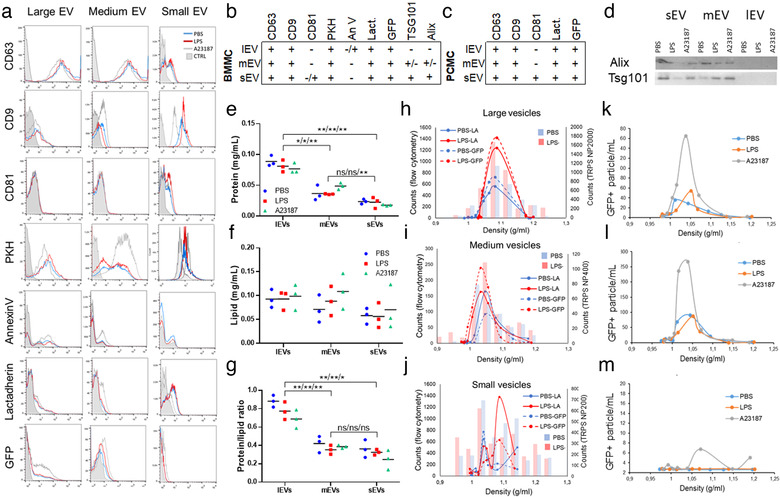
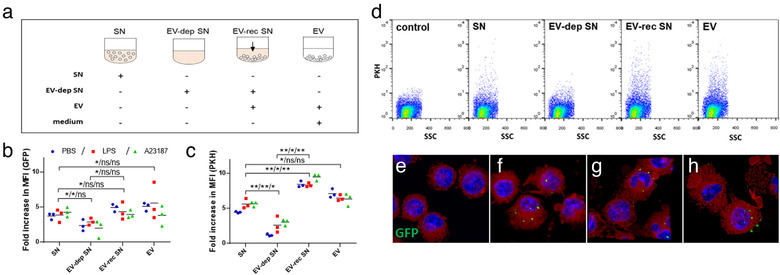
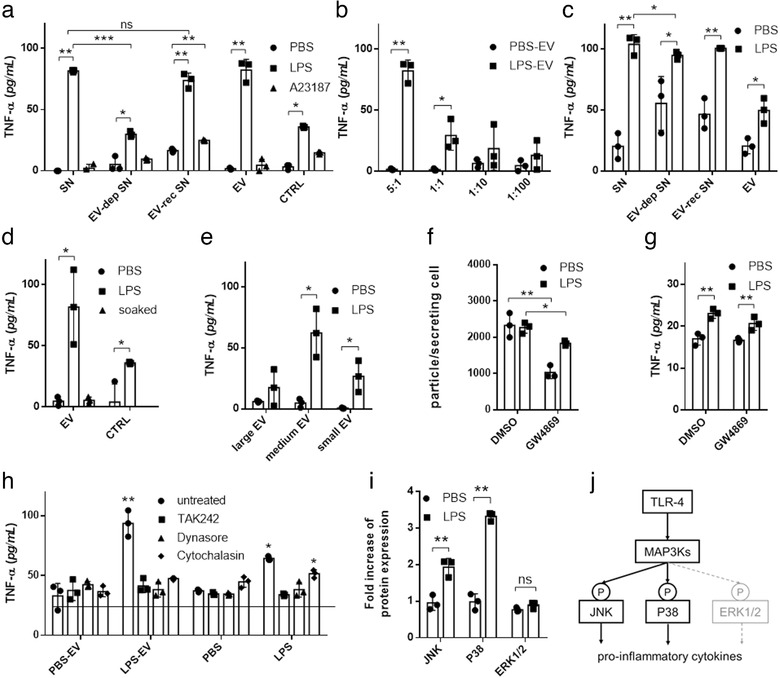
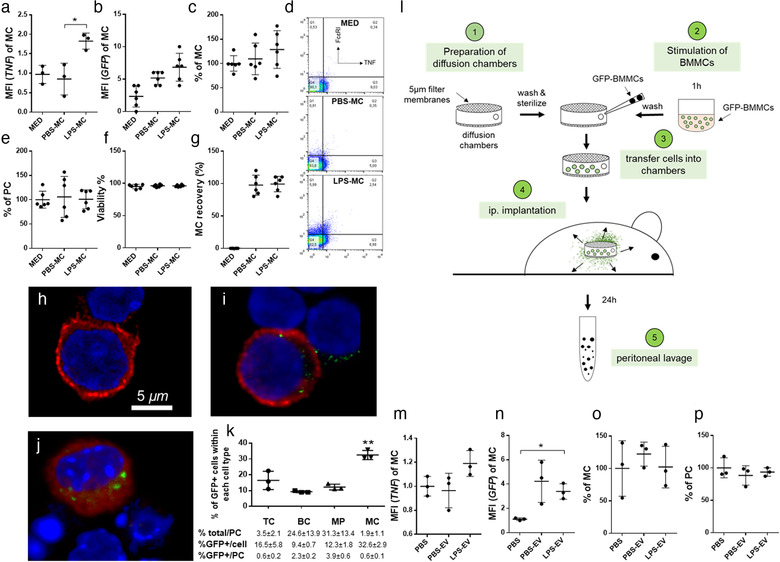
Mast cells have been shown to release extracellular vesicles (EVs) in vitro. However, EV-mediated mast cell communication in vivo remains unexplored. Primary mast cells from GFP-transgenic and wild type mice, were grown in the presence or absence of lipopolysaccharide (LPS), and the secreted EVs were separated from the conditioned media. Mast cell-derived EVs were next cultured with LPS-naïve mast cells, and the induction of TNF-α expression was monitored. In addition, primary mast cells were seeded in diffusion chambers that were implanted into the peritoneal cavities of mice. Diffusion chambers enabled the release of GFP+ mast cell-derived EVs in vivo into the peritoneal cavity. Peritoneal lavage cells were assessed for the uptake of GFP+ EVs and for TNF-α production. In vitro, LPS-stimulated mast cell-derived EVs were efficiently taken up by non-stimulated mast cells, and induced TNF-α expression in a TLR4, JNK and P38 MAPK dependent manner. In vivo, using implanted diffusion chambers, we confirmed the release and transmission of mast cell-derived EVs to other mast cells with subsequent induction of TNF-α expression. These data show an EV-mediated spreading of pro-inflammatory response between mast cells, and provide the first in vivo evidence for the biological role of mast cell-derived EVs.

Keywords: LPS; TNF‐α; extracellular vesicles; in vitro; in vivo; mast cell.


Conflict of interest statement

The authors do not have financial interest to declare.

Figures

FIGURE 1
FIGURE 1
Identification of BMMCs and PCMCs. Mast cell nature was confirmed by showing the degranulation capacity of BMMCs (a) and PCMCs (b) with β‐hexosaminidase assay in the presence of LPS (100 ng/ml ) and A23187 (0.5 μM). Cell purity was assessed by flow cytometry on the 4th week of mast cell differentiation (BMMC, c) or on 10th day of culture (PCMC, d) by flow cytometry, based on FcɛRI and c‐Kit positivity. BMMCs from C57BL/6 mice were studied by phase contrast microscopy (e), while GFP‐BMMCs from C57BL‐GFP mice were analysed by fluorescent microscopy (f). Cellular purity was also checked by Kimura staining (g). The optimal concentration of LPS (h) and incubation time (i) were chosen based on TNF‐α secretion measured by ELISA. Graphs show the mean and SD of three biological replicates, where one point indicates the average of three technical replicates (n = 3, *P ≤ 0.05, **P ≤ 0.01 t test)
FIGURE 2
FIGURE 2
Uptake of MC‐derived EVs by MCs. Non‐fluorescent BMMCs from C57BL/6 mice were co‐cultured with GFP‐BMMCs with cytoplasmic fluorescence, derived from C57BL‐GFP mice (a, c) or PKH‐stained BMMC with fluorescent plasma membrane (b, d) in the presence of PBS or 100 ng/ml LPS. A23187 (0.5 μM) was used as positive control. For negative control, unstained C57BL/6‐derived BMMCs were used (a and b, grey histograms). Scatter plots show the mean and SD of five biological replicates (n = 5), normalized to unstained control. Cell‐free conditioned medium of BMMCs (cultured upon addition of PBS, 100 ng/ml LPS and 0.5 μM A23187) was tested by TRPS with three different pore size membranes (i: NP200 for small EVs, j: NP400 for mEVs and k: NP2000 for lEVs). Graphs show the mean and SD of three independent experiments (n = 3), where one point indicates the average of two technical replicates. e‐h: GFP‐BMMC and wild type BMMCs were co‐cultured for 24 h. Cells were fixed with 2% PFA, nucleus was stained with DAPI and EV‐transfer from GFP‐BMMCs was tested with confocal microscopy (Leica SP8). Cell shapes were visualized by transmitted light. 3D images were generated using LAS X software. Arrows: Releasing EVs, Arrow heads: EVs
FIGURE 3
FIGURE 3
Immune electron microscopic and TRPS analyses of MC‐derived EVs. Particle sizes, size distributions and concentrations of separated large‐, medium size‐ and small‐EVs from the conditioned medium of BMMCs were measured by TRPS using membranes with three different pore sizes (a: NP200 for sEVs, b: NP400 for mEVs and c: NP2000 for lEVs. BMMCs were cultured in the presence of PBS (negative control, blue), LPS (100 ng/ml, red) or A23187 (positive control, green) for 24 h prior to EV separation. Graphs are means of 3 biological replicates with 2‐2 technical replicates (n = 6). EV markers of BMMC‐derived small (d‐f), medium (g‐i) and large (j‐l) EVs were detected by immunoelectron microscopy using nanogold labelling. PBS (unstimulated): 1st column, LPS‐stimulated: 2nd column, and A23187‐stimulated: 3rd column. Gold particles with 10 nm diameter represent CD63 while 5 nm diameter particles indicate c‐Kit
FIGURE 4
FIGURE 4
Characterization of mast cell‐derived EV populations. Large, medium and small EVs derived from 100 ng/ml LPS‐stimulated (LPS) or unstimulated (PBS) BMMCs and PCMCs were tested by flow cytometry. A23187 (0.5 μM) was used as positive control. EVs were stained for CD63, CD9 and CD81 or labelled with fluorochrome‐conjugated PKH67, annexin V and lactadherin. GFP expression of EVs derived from C57BL‐GFP mice were also measured. Small EVs were bound onto the surface of aldehyde/sulphate beads (4 μm). Histograms of flow cytometry measurements show single demonstrates of at least three independent experiments with BMMCs (a, n>3). Tables summarize the results on BMMC (b)‐and PCMC (c)‐derived EVs. Exosome markers Alix and TSG101 were detected by Western blot on the 3 × 3 EV populations (d). Protein (e) and lipid (f) content of separated EVs were measured by microBCA protein and SPV lipid assays, respectively. Protein/lipid ratio was also calculated (g). Graphs demonstrate three independent biological replicates (n = 3, *P ≤ 0.05, **P ≤ 0.01, t test). An Optiprep gradient was used to further characterize EVs. Separated small, medium and lEVs from the conditioned medium of BMMCs (from C57BL‐GFP) were ultracentrifuged (<16h, 100,000g, 4°C) bottom up (h‐j), while cell‐free conditioned medium of PCMCs (from C57BL‐GFP) were layered on the top of an Optiprep gradient (k‐m). Particle number was determined by TRPS and their lactadherin binding and positivity for GFP were determined by flow cytometry. Graphs show means of 3 independent experiments (n = 3)
FIGURE 5
FIGURE 5
LPS‐stimulated mast cell derived extracellular vesicles are taken up by other mast cells. GFP‐BMMCs (b) and PKH‐stained BMMCs (c, d) were cultured in EV‐free medium in the presence or absence of LPS (100 ng/ml ) for an hour. A23187 (0.5 μM) and PBS were used as positive as negative controls, respectively. EVs were separated from the conditioned medium after 24 h . Unstained BMMCs derived from C57BL/6 mice were cultured in EV‐free medium (control), conditioned medium (SN), EV‐depleted conditioned medium (EV‐dep SN), EV‐reconstructed medium (EV‐rec SN) or separated EVs in fresh medium (a). EV‐uptake was also monitored by confocal microscopy (e‐h: GFP (green) merged with DAPI (blue) and lactadherin (red), e: control BMMCs; f: BMMCs cultured with EVs derived from PBS‐stimulated, g: LPS‐stimulated and h: A23187‐stimulated MCs. The mean of flow cytometric fold increase in MFI values (b, c) normalized to unstained control of three biological replicates (n = 3, *P ≤ 0.05, **P ≤ 0.01 t test) are shown. Flow cytometric plots (d) show single demonstrates of three independent experiments
FIGURE 6
FIGURE 6
EVs from LPS‐stimulated MCs induce TNF‐α secretion in recipient MCs. BMMCs or PCMCs were cultured in EV‐free medium in the presence or absence of LPS (100 ng/ml ) for an hour. A23187 (0.5 μM) and PBS were used as positive and negative controls, respectively. EVs were separated from the conditioned medium after 24 h. Naïve BMMCs (a) or PCMCs (c) were cultured in EV‐free medium (control) conditioned medium (SN), EV‐depleted conditioned medium (EV‐dep SN), EV‐reconstructed medium (EV‐rec SN) or separated EV containing non‐conditioned medium. For concentration measurements, different ratios of EV donor and acceptor cells were tested (b). Naïve BMMCs were also cultured in the presence of EVs from unstimulated BMMCs incubated in 100 ng/ml LPS for 2 h prior to experiments (d) or large‐, medium size‐ or small‐EVs of stimulated and unstimulated MCs (e). We used GW4869 (10 μM), a neutral sphingomyelinase inhibitor to block small EV generation, 30 min before LPS stimulation of donor cells. As GW4869 was diluted in DMSO, we used DMSO as control. Separated small particles were measured by NTA (f) and were added to naïve cells (same amount as producing cells) after washing for 24 h (g). In inhibition experiments, BMMCs were treated with TAK242 (0.2 μM), dynasore (80 μM) cytochalasin D (10μg/ml ) prior to culture in the presence of separated EVs from conditioned medium of unstimulated (PBS‐EV) or LPS‐stimulated (LPS‐EV) MCs (h). TNF‐α concentration was measured after 24 h with ELISA. Column bars are means of at least three independent experiments (biological replicates, n>3) as the mean and SD of three replicates (n = three, *P ≤ 0.05, **P ≤ 0.01, t test and ANOVA), where one dot indicates the average of three technical replicates. BMMCs were cultured for 24 h in EV‐free complete medium in the presence of isolated EVs derived from LPS‐stimulated (100 ng/ml ) and unstimulated BMMCs. Cells were washed two times lysed and investigated for phosphorylation of ERK1/2, JNK and P38 by RayBio Cell‐based phosphorylation ELISA kits (i). Biological replicates, n≥3, *P ≤ 0.05, **P ≤ 0.01, t test. Schematic picture shows the possible mechanism of MAPK signalling activation (j)
FIGURE 7
FIGURE 7
LPS‐stimulated MCs release EVs which spread TNF‐α induction in MCs in vivo in the peritoneal cavity of mice. GFP‐BMMCs were incubated for 1h in the presence or absence of LPS (100 ng/ml ). EMD Millipore's Diffusion Chamber Kits were used with 5 μm pore size membrane filters. Empty (mock‐operated) and MC‐containing (100 ng/ml LPS‐stimulated or unstimulated) chambers were then implanted to the peritoneal cavities of C57BL/6 mice (a‐l). In additional experiments, EVs separated from the conditioned medium of LPS‐stimulated and unstimulated BMMCs were injected i.p. twice in 24 h (n‐p). After 24 h, mice were sacrificed and peritoneal cells were collected by peritoneal lavage. MC numbers (c, o) were determined using Kimura staining by light microscopy and by flow cytometry using the two pan‐MC markers CD117 (c‐Kit) and FcɛRI. Uptake of EVs by MCs was assessed by flow cytometry based on the GFP signal (b, n). Peritoneal cells (PC) were counted (e, p) and their viability (f) was assessed by trypan blue staining. Intracellular TNF‐α (a, m) was also measured by flow cytometry after Brefeldin A treatment (3 μg/ml for 1h). Representative plots of intracellular TNF staining in MCs are shown (d). Cells were examined under a confocal microscope upon staining for FcɛRI expression to identify MC and GFP signal to confirm EV uptake (h: med, i: PBS‐MC, j: LPS‐MC). Cells retrieved from the removed diffusion chambers were subjected to enumeration and viability tests using trypan blue staining (live cell recovery is shown in g). EV‐uptake by different cell types including T cells (TC), B cells (BC), macrophages (MP) and mast cells (MC) was determined as the % of GFP+ cells of each cell type (k). Frequency of different cell types among peritoneal cells (1st row), % of GFP+ cells of each cell type (2nd row) and % of GFP+ cells of a given cell type among all PCs (3rd row) are summarised in the table below figure k. Graphs show the mean and SD of at least 3 independent experiments (biological replicates, n ≥ 3, *P ≤ 0.05, **P ≤ 0.01, t test). Med: medium, MFI: mean fluorescence intensity

References

    1. Aidoo, D. B. , Obiri, D. D. , Osafo, N. , Antwi, A. O. , Essel, L. B. , Duduyemi, B. M. , & Ekor, M. (2019). Allergic airway‐induced hypersensitivity is attenuated by bergapten in murine models of inflammation. Advances in Pharmacological Sciences, 2019, 1. - PMC - PubMed
    1. Al‐Nedawi, K. , Szemraj, J. , & Cierniewski, C. S. (2005). Mast cell‐derived exosomes activate endothelial cells to secrete plasminogen activator inhibitor type 1, Arteriosclerosis, Thrombosis, and Vascular Biology, 25, 1744–1749. - PubMed
    1. Amanda Carroll‐Portillo, A. , Z., Surviladze , Cambi, A. , Lidke, D. S. , & Wilson, B. S. (2012). Mast cell synapses and exosomes: Membrane contacts for information exchange, Frontiers in Immunology, 15(3), 46. - PMC - PubMed
    1. Avila, M. , & Gonzalez‐Espinosa, C. (2011). Signaling through Toll‐like receptor 4 and mast cell‐dependent innate immunity responses, Iubmb Life, 63(10), 873–880. - PubMed
    1. Bobrie, A. , Colombo, M. , Krumeich, S. , Raposo, G. , & Théry, C. (2012). Diverse subpopulations of vesicles secreted by different intracellular mechanisms are present in exosome preparations obtained by differential ultracentrifugation, Journal of Extracellular Vesicles, 1, 18397. - PMC - PubMed

Publication types

MeSH terms

Substances