. 2021 Feb 18;10(2):e1254.
doi: 10.1002/cti2.1254. eCollection 2021.

Circular RNA TRAPPC6B inhibits intracellular Mycobacterium tuberculosis growth while inducing autophagy in macrophages by targeting microRNA-874-3p

Affiliations

Circular RNA TRAPPC6B inhibits intracellular Mycobacterium tuberculosis growth while inducing autophagy in macrophages by targeting microRNA-874-3p

Hou-Long Luo et al. Clin Transl Immunology. .

Abstract

Objectives: Genetic and epigenetic mechanisms regulate antimicrobial immunity against Mycobacterium tuberculosis (Mtb) infection.

Methods: The present study assessed circular RNA TRAPPC6B (circTRAPPC6B) for antimicrobial immune functions and defined mechanisms wherein circTRAPPC6B regulates Mtb growth, autophagy and microRNA in macrophages.

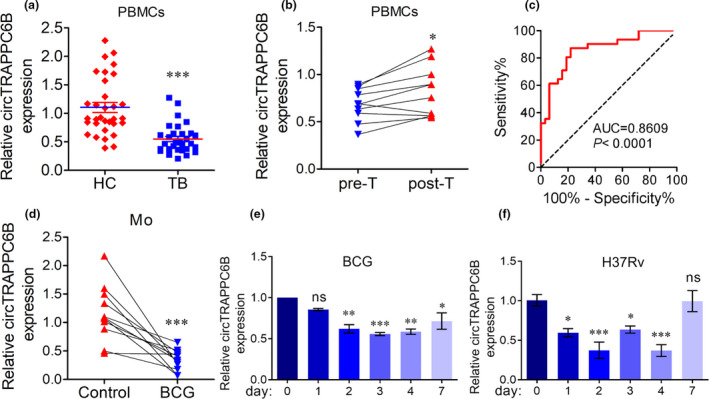
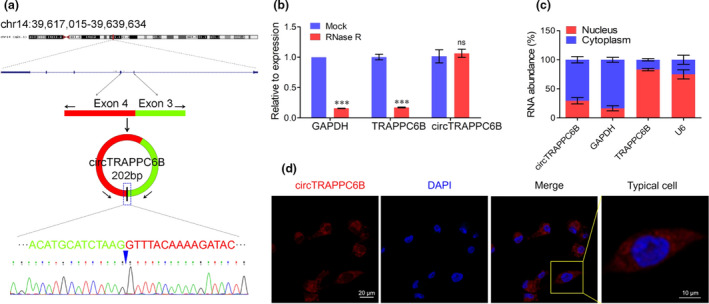
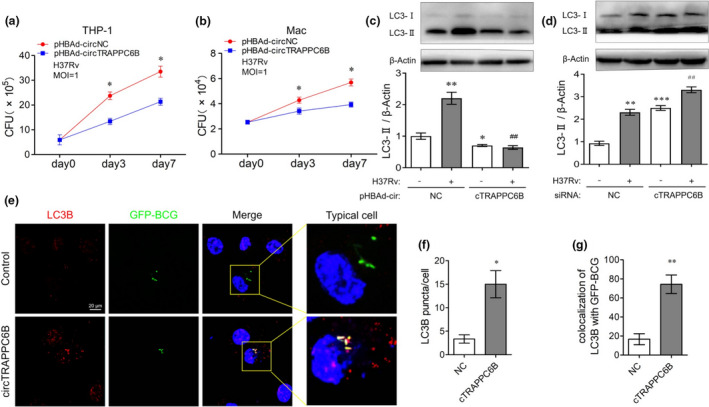
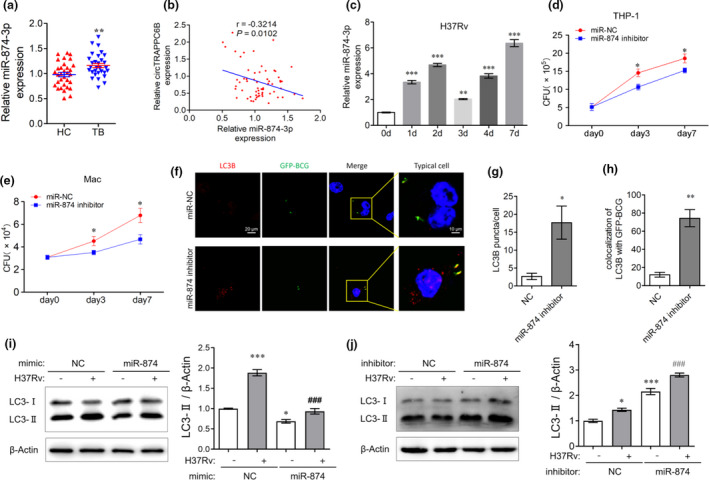
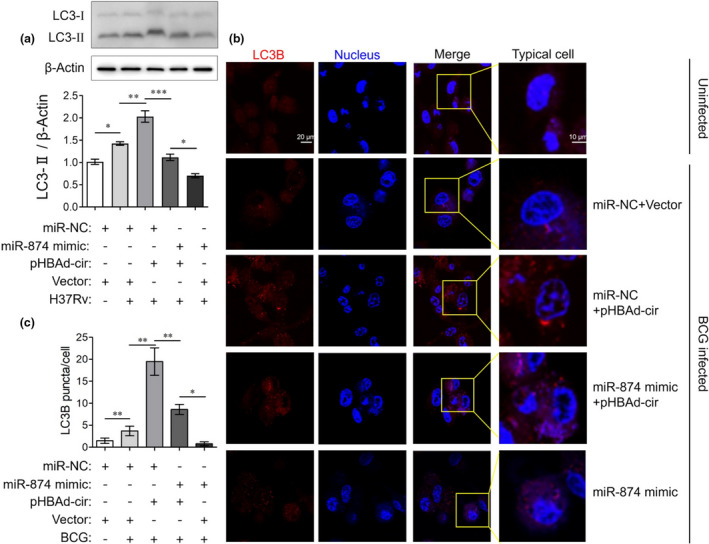
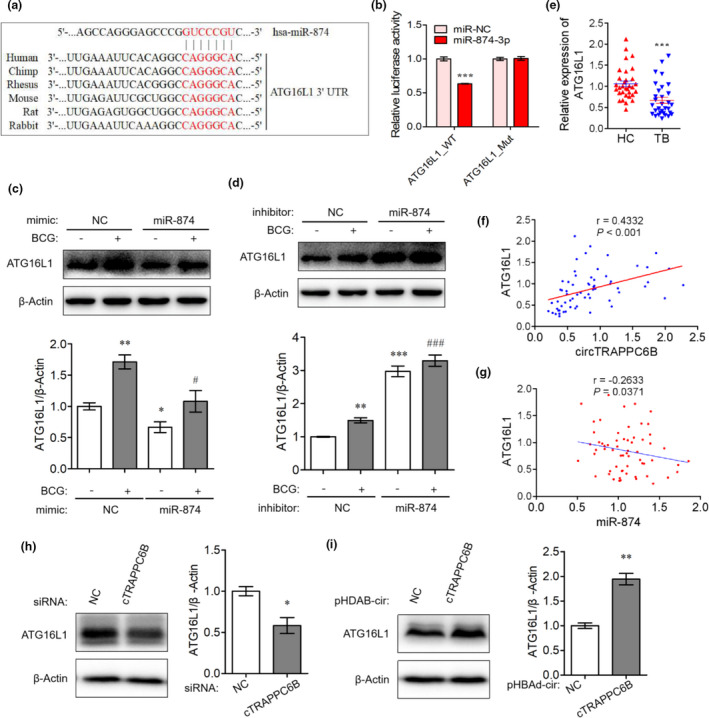
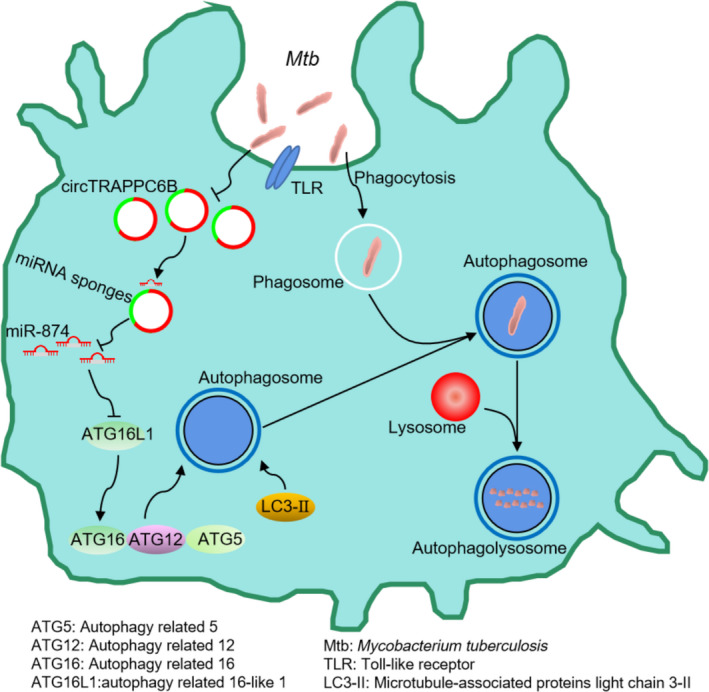
Results: The Mtb infection of monocytes/macrophages resulted in a significantly decreased level of circTRAPPC6B that inhibited intracellular Mtb growth in macrophages. Conversely, circTRAPPC6B expression enhanced autophagy or autophagy-associated protein LC3-II production in Mtb-infected macrophages. circTRAPPC6B-enhanced autophagy aggregation or sequestration was also observed in fluorescence in situ hybridisation (FISH) analysis and confocal imaging. Mechanistically, circTRAPPC6B targets an inhibiting element miR-874-3p, as shown by bioinformatics, dual-luciferase reporter gene analysis and pull-down assay, respectively. Notably, miR-874-3p prohibited autophagy via suppressing autophagy protein ATG16L1 by binding to its 3'-untranslated region (UTR) in Mtb-infected macrophages and thus promoting intracellular Mtb growth. Concurrently, circTRAPPC6B enhanced autophagy in Mtb-infected macrophages by blocking the ability of miR-874-3p to inhibit ATG16L1. Thus, circTRAPPC6B antagonises the ability of miR-874-3p to suppress ATG16L1 expression and activate and enhance autophagy sequestration to restrict Mtb growth in macrophages.

Conclusion: The current findings suggested that both circTRAPPC6B and miR-874-3p mechanisms can be explored as potential therapeutics against Mtb infection.

Keywords: Mycobacterium tuberculosis; autophagy; circTRAPPC6B; macrophage; miR‐874‐3p.


Conflict of interest statement

The authors declare no conflict of interest.

Figures

Figure 1
Figure 1
circTRAPPC6B was significantly downregulated in PBMCs from patients with active TB and Mtb‐infected monocytes and macrophages. (a) After PBMCs were freshly isolated from blood by standard Ficoll density gradient centrifugation, circTRAPPC6B expression was analysed in human PBMCs from patients with 32 active TB and 31 HC by qRT‐PCR. GAPDH was used as a housekeeping gene for normalising changes in circRNA gene expression. Data are expressed as mean ± SEM. ***P < 0.001 vs HC. (b) After 10 patients with active TB received individualised anti‐TB treatments, including isoniazid, rifampicin, pyrazinamide and ethambutol, circTRAPPC6B expression was analysed in PBMCs from 10 patients with active TB before (pre‐T) and after (post‐T) 1 month of anti‐TB therapy. Data are expressed as mean ± SEM. *P < 0.05 vs Pre‐T. (c) To evaluate the diagnostic value in active TB, circTRAPPC6B expression was analysed by the ROC curve. (d) After human peripheral monocytes were sorted from PBMCs by immunomagnetic positive selection, circTRAPPC6B expression was analysed in human peripheral monocytes with or without TB vaccine BCG infection at MOI = 10 for 24 h. Data are expressed as mean ± SEM. ***P < 0.001 vs uninfected control. (e, f) After THP‐1 macrophages were infected with BCG (e) at MOI = 10 and H37Rv (f) at MOI = 1 at different time points (0, 1, 2, 3, 4 and 7 days), circTRAPPC6B expression was analysed by qRT‐PCR. The data were obtained from three independent experiments. *P < 0.05, **P < 0.01, ***P < 0.001 vs day 0. BCG, Bacillus Calmette‐Guérin; HC, health control; MOI, multiplicity of infection; ns, no significance; PBMCs, peripheral blood mononuclear cells; qRT‐PCR, quantitative real‐time polymerase chain reaction; ROC, reactive operating characteristic curve; TB, tuberculosis.
Figure 2
Figure 2
Identification of the circular structure and cellular distribution of circTRAPPC6B. (a) Schematic illustration displays that circTRAPPC6B is located at chromosome 14q21.1. The precise genomic location is 39,617,015–39,639,634. circTRAPPC6B is cyclised from exons 3 and 4 of TRAPPC6B. The PCR products of circTRAPPC6B were evaluated by Sanger sequencing. (b) After treatment with or without (Mock) RNase R according to the protocol of manufacturer, the relative expression of circTRAPPC6B and linear mRNAs of GAPDH and TRAPPC6B was analysed in THP‐1 cells by qRT‐PCR. The data were obtained from three independent experiments. Data are expressed as mean ± SEM. ***P < 0.001 vs Mock. (c) After treatment with Nuclear and Cytoplasmic Extraction Reagents according to the protocol of manufacturer, circTRAPPC6B expression was analysed in the subcellular distribution of THP‐1 cells infected with BCG for 24 h by qRT‐PCR. The data were obtained from three independent experiments. (d) After infection with BCG at MOI = 10 for 24 h, THP‐1 macrophages were collected and incubated with biotin‐conjugated circTRAPPC6B probe overnight at 37°C. Representative immunofluorescence confocal image showing the subcellular distribution of circTRAPPC6B. Scale bar, 20 μm. Scale bar of typical cell, 10 μm. PCR, polymerase chain reaction; qRT‐PCR, quantitative real‐time polymerase chain reaction; BCG, Bacillus Calmette‐Guérin; MOI, multiplicity of infection; FISH, fluorescence in situ hybridisation.
Figure 3
Figure 3
Overexpression of circTRAPPC6B inhibited intracellular Mtb growth while activating autophagy in Mtb‐infected macrophages. (a, b) After transfection with circTRAPPC6B overexpressing plasmids or control plasmids for 24 h, THP‐1 macrophages (a) and macaque spleen macrophage (b) were infected with Mycobacterium H37Rv at MOI = 1 for 3 or 7 days. The growth of the bacilli was evaluated by CFU count. The data were obtained from six independent experiments. Data are expressed as mean ± SEM. *P < 0.05 vs day 0 (n = 6). (c, d) After transfection with siRNA against circTRAPPC6B (c) or plasmids overexpressing circTRAPPC6B (d) for 24 h, THP‐1 macrophages were infected with Mycobacterium H37Rv at MOI = 1 for 24 h. Representative Western blot showing the change of the LC3‐I and LC3‐II protein expression in THP‐1 macrophages. The data were obtained from three independent experiments. Data are expressed as mean ± SEM. *P < 0.05, **P < 0.01, ***P < 0.001 vs uninfected and untransfected control. ## P < 0.01 vs H37Rv‐infected but untransfected control. (e) After transfection with circTRAPPC6B overexpressing vectors or control vectors (NC) for 24 h, THP‐1 macrophages were infected with GFP‐BCG at MOI = 10 for 24 h. THP‐1 macrophages were incubated with anti‐LC3 for 2h at room temperature and then fluorescently labelled secondary Ab for 1 h at room temperature. Representative immunofluorescence confocal image of THP‐1 macrophages showing the change of LC3B puncta and GFP‐BCG colocalisation. Scale bar, 20 μm. (f, g) Quantification assay of e. 100 cells were count in every independent experiment. The data were obtained from the mean number of LC3B puncta or colocalisation of LC3B with GFP‐BCG of three independent experiments. Data are expressed as mean ± SEM. *P < 0.05, **P < 0.01 vs NC (n = 3). MOI, multiplicity of infection; CFU, colony‐forming unit; GFP, green fluorescence protein; BCG, Bacillus Calmette‐Guérin.
Figure 4
Figure 4
miR‐874‐3p was identified as the target of circTRAPPC6B. (a) The intersection of CircInteractome, miRDB and RegRNA 2.0 databases was analysed to predict potential miRNA targets of circTRAPPC6B. (b) A schematic diagram showing the predicted binding site between 3’UTR of circTRAPPC6B and miR‐874‐3p. Wide‐ and mutant‐type circTRAPPC6B 3’UTR luciferase reporter vectors were constructed and cotransfected with miR‐874‐3p mimic in HEK293T cells. (c) After infection with BCG at MOI = 10 for 24 h, THP‐1 macrophages were collected and incubated with biotin‐conjugated circTRAPPC6B and digoxin‐conjugated miR‐874 probes overnight at 37°C. Representative immunofluorescence confocal image showing partly colocalisation of circTRAPPC6B with miR‐874‐3p in the cytoplasm of THP‐1 macrophages. Scale bar, 20 μm. Scale bar of typical cell, 10 μm. (d) The relative luciferase activity was determined at 48 h after cotransfection with circTRAPPC6B harbouring wild‐type or mutant miR‐874‐3p binding site and miR‐874‐3p mimics or negative control (NC) in HEK293T cells. The data were obtained from three independent experiments. Data are expressed as mean ± SEM. **P < 0.01 vs NC. (e) CircRNA pull‐down assay was performed in THP‐1 macrophages using biotin‐conjugated circTRAPPC6B to assess the interaction between circTRAPPC6B and miR‐874‐3p, followed by qRT‐PCR to detect circTRAPPC6B and miR‐874‐3p enrichment. The data were obtained from three independent experiments. Data are expressed as mean ± SEM. ***P < 0.001 vs control probe. (f) miRNA pull‐down assay was performed in THP‐1 macrophages using digoxin‐conjugated miR‐874 probes, followed by qRT‐PCR to detect miR‐874‐3p and circTRAPPC6B enrichment. The data were obtained from three independent experiments. Data are expressed as mean ± SEM. **P < 0.01, ***P < 0.001 vs control probe. FISH, fluorescence in situ hybridisation.
Figure 5
Figure 5
miR‐874‐3p regulated intracellular Mtb growth and autophagy in Mtb‐infected macrophages. (a) After PBMCs were freshly isolated from blood by standard Ficoll density gradient centrifugation, miR‐874‐3p expression was analysed in human PBMCs from patients with 32 active TB and 31 HC by qRT‐PCR. U6 was used as a housekeeping gene for normalising changes in miRNA gene expression. Data are expressed as mean ± SEM. **P < 0.01 vs HC. (b) Spearman’s correlation analysis between miR‐874‐3p and circTRAPPC6B expression in PBMCs of 32 TB patients. (c) After THP‐1 macrophages were infected with H37Rv at MOI = 1 at different time points (0, 1, 2, 3, 4, and 7 days), miR‐874‐3p expression was analysed by qRT‐PCR. The data were obtained from three independent experiments. Data are expressed as mean ± SEM. **P < 0.01, ***P < 0.001 vs 0 d. (d, e) After transfection with miR‐874‐3p inhibitor or negative control (miR‐NC) for 24 h, THP‐1 macrophages (d) and macaque spleen macrophage (e) were infected with Mycobacterium H37Rv at MOI = 1 for 3 or 7 days. The growth of the bacilli was evaluated by CFU count. The data were obtained from six independent experiments. Data are expressed as mean ± SEM. *P < 0.05 vs day 0 (n = 6). (f) After transfection with miR‐874‐3p inhibitor or negative control (miR‐NC) for 24 h, THP‐1 macrophages were infected with GFP‐BCG at MOI = 10 for 24 h. Then, THP‐1 macrophages were incubated with anti‐LC3B for 2h at room temperature and then fluorescently labelled secondary Ab for 1h at room temperature. Representative immunofluorescence confocal image of THP‐1 macrophages showing the change of LC3B puncta and GFP‐BCG colocalisation. Scale bar, 20 μm. (g, h) Quantification assay of f. 100 cells were count in every independent experiment. The data were obtained from the mean number of LC3B puncta or colocalisation of LC3B with GFP‐BCG of three independent experiments. Data are expressed as mean ± SEM. *P < 0.05, **P < 0.01 vs miR‐NC. (i, j) After transfection with miR‐874‐3p mimics (i) or inhibitor (j) for 24 h, THP‐1 macrophages were infected with Mycobacterium H37Rv at MOI = 1 for 24 h. Representative Western blot showing the change of the LC3‐I and LC3‐II protein expression in THP‐1 macrophages. The data were obtained from three independent experiments. Data are expressed as mean ± SEM. *P < 0.05, ***P < 0.001 vs uninfected and untransfected control; ### P < 0.001 vs H37Rv‐infected but untransfected cells. qRT‐PCR, quantitative real‐time polymerase chain reaction; PBMCs, peripheral blood mononuclear cells; TB, tuberculosis; HC, health control; MOI, multiplicity of infection; CFU, colony forming unit; GFP, green fluorescence protein; BCG, Bacillus Calmette‐Guérin.
Figure 6
Figure 6
circTRAPPC6B regulated autophagy in Mtb‐infected macrophages via miR‐874‐3p. After transfection with circTRAPPC6B‐overexpressing vectors (pHBAd‐cir), miR‐874‐3p mimics, or corresponding negative controls as indicated for 24 h, THP‐1 macrophages were infected with BCG at MOI = 10 or Mycobacterium H37Rv at MOI = 1 for 24 h. (a) Representative Western blot showing the change of the LC3‐I and LC3‐II protein expression in H37Rv‐infected THP‐1 macrophages. The data were obtained from three independent experiments. Data are expressed as mean ± SEM. *P < 0.05, **P < 0.01 and ***P < 0.001. (b) THP‐1 macrophages were incubated with anti‐LC3B for 2h at room temperature and then fluorescently labelled secondary Ab for 1h at room temperature. Representative immunofluorescence confocal image of BCG‐infected THP‐1 macrophages showing the change of LC3B puncta. (c) Quantification of b. 100 cells were count in every independent experiment. The data were obtained from the mean number of LC3B puncta of three independent experiments. Data are expressed as mean ± SEM. *P < 0.05, **P < 0.01. BCG, Bacillus Calmette‐Guérin; MOI, multiplicity of infection.
Figure 7
Figure 7
CircTRAPPC6B regulated autophagy in Mtb‐infected macrophage via miR‐874‐3p/ATG16L1. (a) A schematic diagram showing the predicted binding site between 3′UTR of ATG16L1 and miR‐874‐3p. Wide‐ and mutant‐type circTRAPPC6B 3’UTR luciferase reporter vectors were constructed. (b) After cotransfection with wild‐type or mutant ATG16L1 3′‐UTR expressing vectors and miR‐874‐3p mimics in HEK293T cells for 48h, dual‐luciferase reporter assay was performed to evaluate the binding between miR‐874‐3p and ATG16L1. The data were obtained from three independent experiments. Data are expressed as mean ± SEM. ***P < 0.001 vs miR‐NC. (c, d) After transfection with miR‐874‐3p mimics (c) or inhibitor (d) for 24 h, THP‐1 macrophages were infected with BCG at MOI = 10 for 24 h. Representative Western blot showing the change of the ATG16L1 protein expression in THP‐1 macrophages. The data were obtained from three independent experiments. Data are expressed as mean ± SEM. *P < 0.05, **P < 0.01, ***P < 0.001 vs uninfected and untransfected cells; # P < 0.05, ### P < 0.001 vs BCG‐infected but untransfected cells. (e) After PBMCs were freshly isolated from blood by standard Ficoll density gradient centrifugation, ATG16L1 mRNA expression was analysed in human PBMCs from patients with 32 active TB and 31 HC by qRT‐PCR. GAPDH was used as a housekeeping gene for normalising changes in mRNA gene expression. Data are expressed as mean ± SEM. ***P < 0.001 vs HC. (f) Spearman’s correlation analysis between ATG16L1 and circTRAPPC6B expression in PBMCs of 32 TB patients. (g) Spearman’s correlation analysis between miR‐874‐3p and ATG16L1 expression in PBMCs of 32 TB patients. (h‐i) After transfection with siRNA against circTRAPPC6B (h) or plasmids overexpressing circTRAPPC6B (i) for 24 h, THP‐1 macrophages were infected with BCG at MOI = 10 for 24 h. Representative Western blot showing the change of the ATG16L1 protein expression in THP‐1 macrophages. The data were obtained from three independent experiments. Data are expressed as mean ± SEM. *P < 0.05 and **P < 0.01, vs uninfected or untransfected control. ATG16L1, Autophagy Related Protein 16 Like Protein 1; BCG, Bacillus Calmette‐Guérin; HC, health control; MOI, multiplicity of infection; PBMCs, peripheral blood mononuclear cells; TB, tuberculosis; UTR, untranslated regions.
Figure 8
Figure 8
Schematic diagram of the circTRAPPC6B/miR‐874‐3p/ATG16L1 axis.

Similar articles

Cited by

References

    1. Shelby PW, Lia MP, Israel A. Collaborative public‐private initiatives targeting multidrug‐resistant tuberculosis (MDR‐TB) supported by the Lilly MDR‐TB Partnership: experiences in 2012–2016. J Healthc Leadersh 2017; 9: 47–57. - PMC - PubMed
    1. Urdahl KB. Understanding and overcoming the barriers to T cell‐mediated immunity against tuberculosis. Semin Immunol 2014; 26: 578–587. - PMC - PubMed
    1. Tobin DM. Host‐directed therapies for tuberculosis. Cold Spring Harb Perspect Med 2015; 5: a021196. - PMC - PubMed
    1. Kolloli A, Subbian S. Host‐directed therapeutic strategies for tuberculosis. Front Med (Lausanne) 2017; 4: 171. - PMC - PubMed
    1. Liu CH, Liu H, Ge B. Innate immunity in tuberculosis: host defense vs pathogen evasion. Cell Mol Immunol 2017; 14: 963–975. - PMC - PubMed

LinkOut - more resources