Nitro-sonium nitrate (NO+NO3 -) structure solution using in situ single-crystal X-ray diffraction in a diamond anvil cell
- PMID: 33708398
- PMCID: PMC7924226
- DOI: 10.1107/S2052252521000075
Nitro-sonium nitrate (NO+NO3 -) structure solution using in situ single-crystal X-ray diffraction in a diamond anvil cell
Abstract
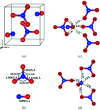
At high pressures, autoionization - along with polymerization and metallization - is one of the responses of simple molecular systems to a rise in electron density. Nitro-sonium nitrate (NO+NO3 -), known for this property, has attracted a large interest in recent decades and was reported to be synthesized at high pressure and high temperature from a variety of nitro-gen-oxygen precursors, such as N2O4, N2O and N2-O2 mixtures. However, its structure has not been determined unambiguously. Here, we present the first structure solution and refinement for nitro-sonium nitrate on the basis of single-crystal X-ray diffraction at 7.0 and 37.0 GPa. The structure model (P21/m space group) contains the triple-bonded NO+ cation and the NO3 - sp 2-trigonal planar anion. Remarkably, crystal-chemical considerations and accompanying density-functional-theory calculations show that the oxygen atom of the NO+ unit is positively charged - a rare occurrence when in the presence of a less-electronegative element.
Keywords: high-pressure single-crystal X-ray diffraction; nitrosonium nitrate; positively charged oxygen atoms; structure refinement.
© Laniel et al. 2021.
Figures


References
-
- Addison, C. C. & Thompson, R. (1948). Nature, 162, 369–370.
-
- Agnew, S. F., Swanson, B. I., Jones, L. H. & Mills, R. L. (1985). J. Phys. Chem. 89, 1678–1682.
-
- Agnew, S. F., Swanson, B. I., Jones, L. H., Mills, R. L. & Schiferl, D. (1983). J. Phys. Chem. 87, 5065–5068.
-
- Akahama, Y., Kawamura, H., Häusermann, D., Hanfland, M. & Shimomura, O. (1995). Phys. Rev. Lett. 74, 4690–4693. - PubMed
-
- Andreev, R. V., Borodkin, G. I. & Shubin, V. G. (2011). Russ. J. Org. Chem. 47, 1703–1709.
LinkOut - more resources
Full Text Sources
Other Literature Sources

