. 2021 Feb 23:9:641410.
doi: 10.3389/fcell.2021.641410. eCollection 2021.

TBL1XR1 Ensures Balanced Neural Development Through NCOR Complex-Mediated Regulation of the MAPK Pathway

Affiliations

TBL1XR1 Ensures Balanced Neural Development Through NCOR Complex-Mediated Regulation of the MAPK Pathway

Giuseppina Mastrototaro et al. Front Cell Dev Biol. .

Abstract

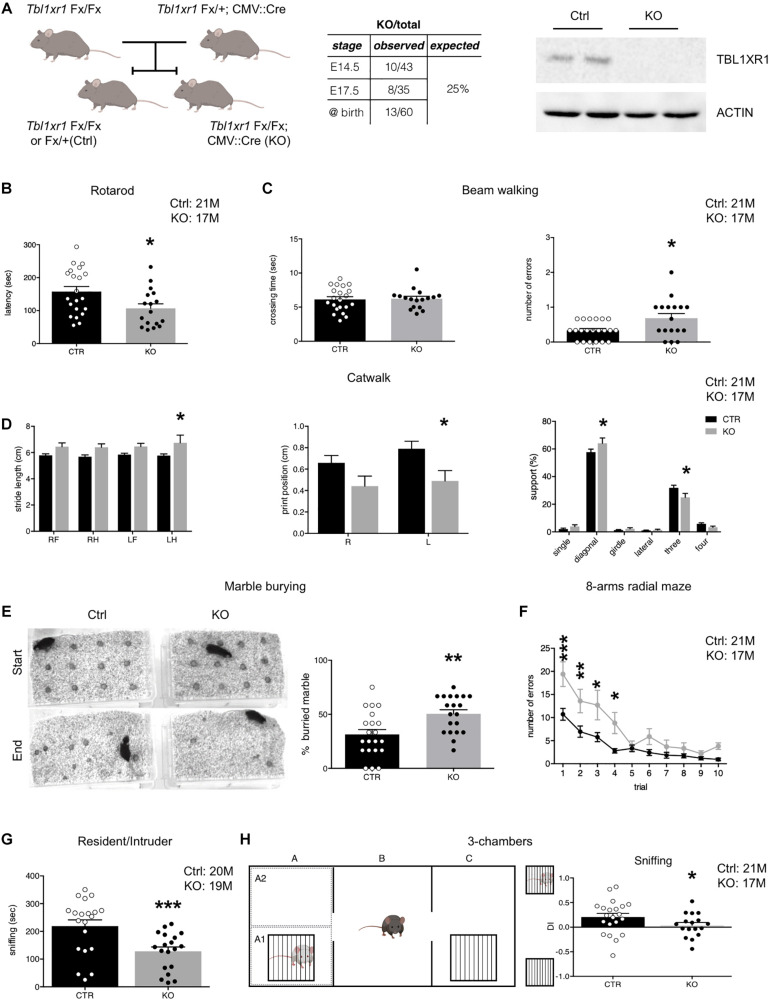
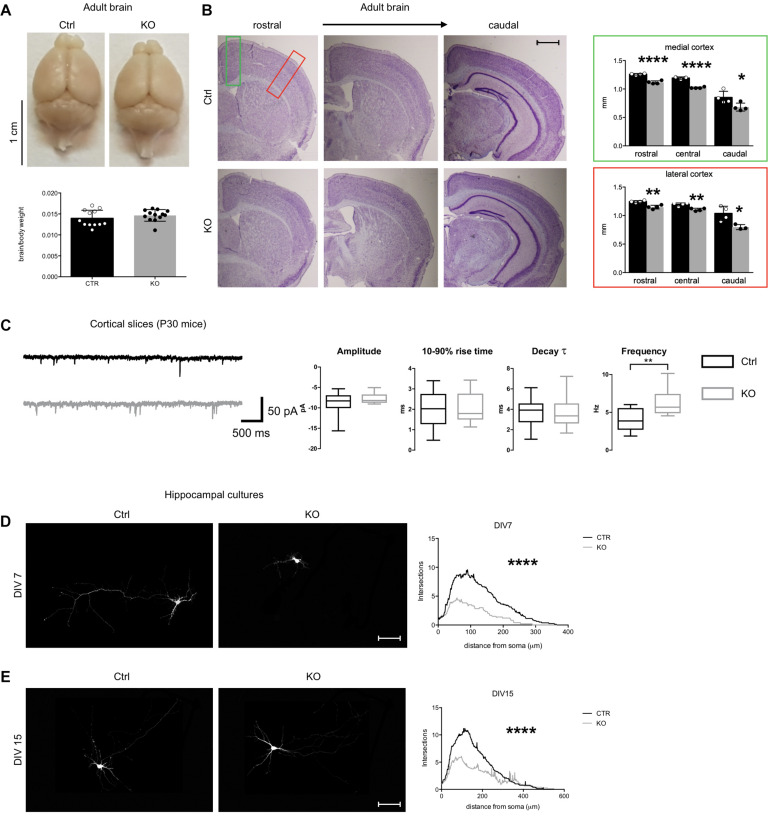
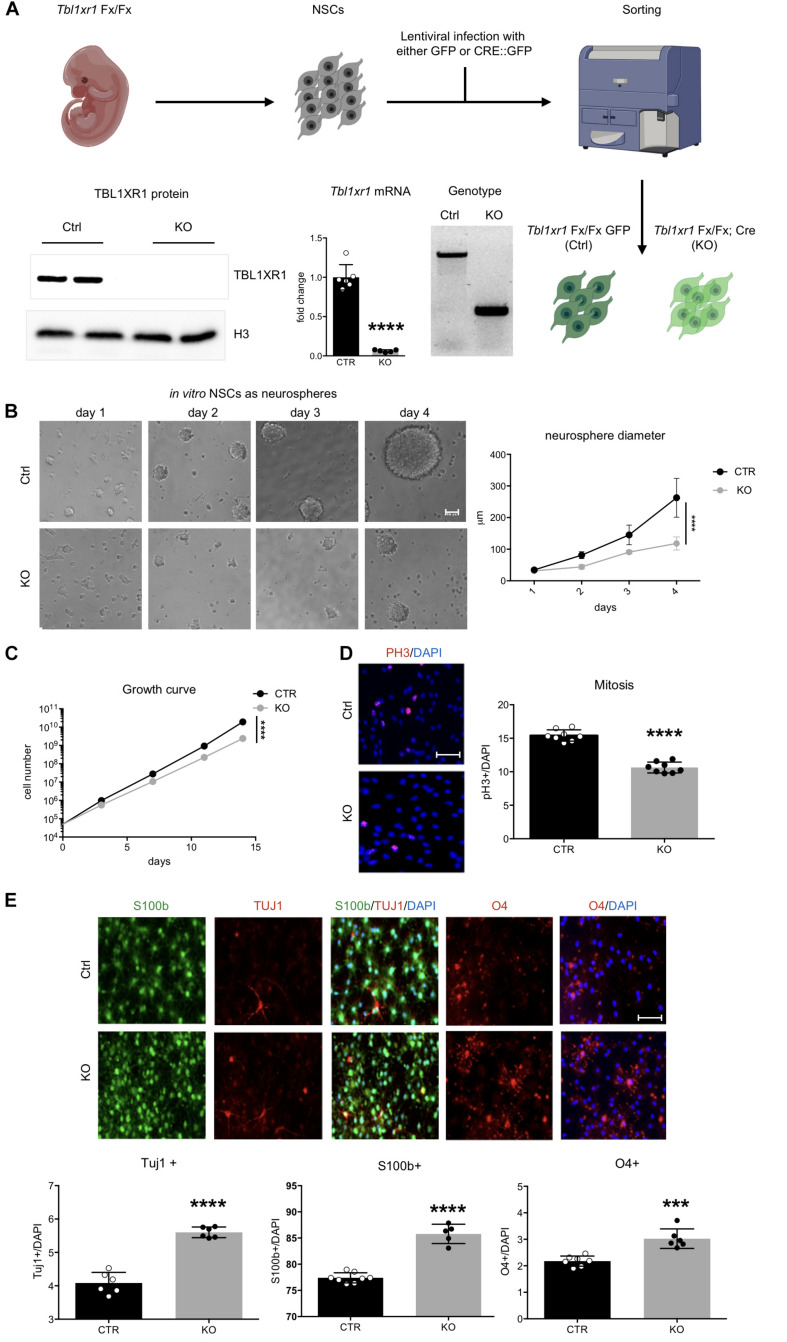
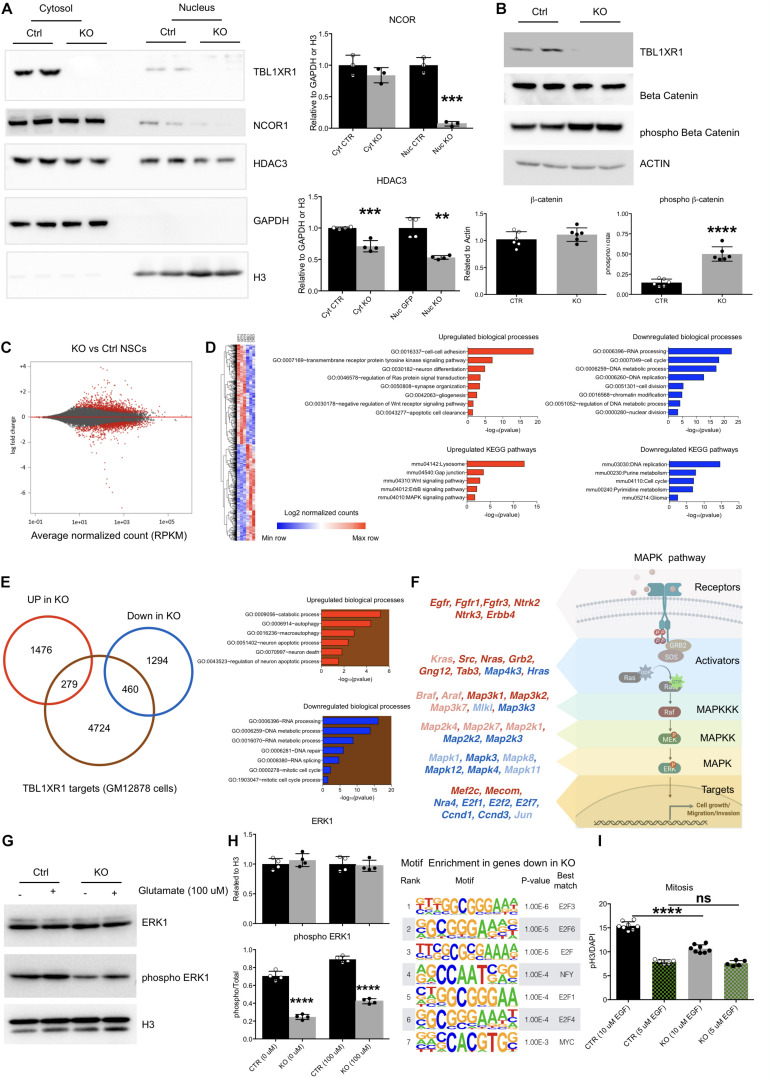
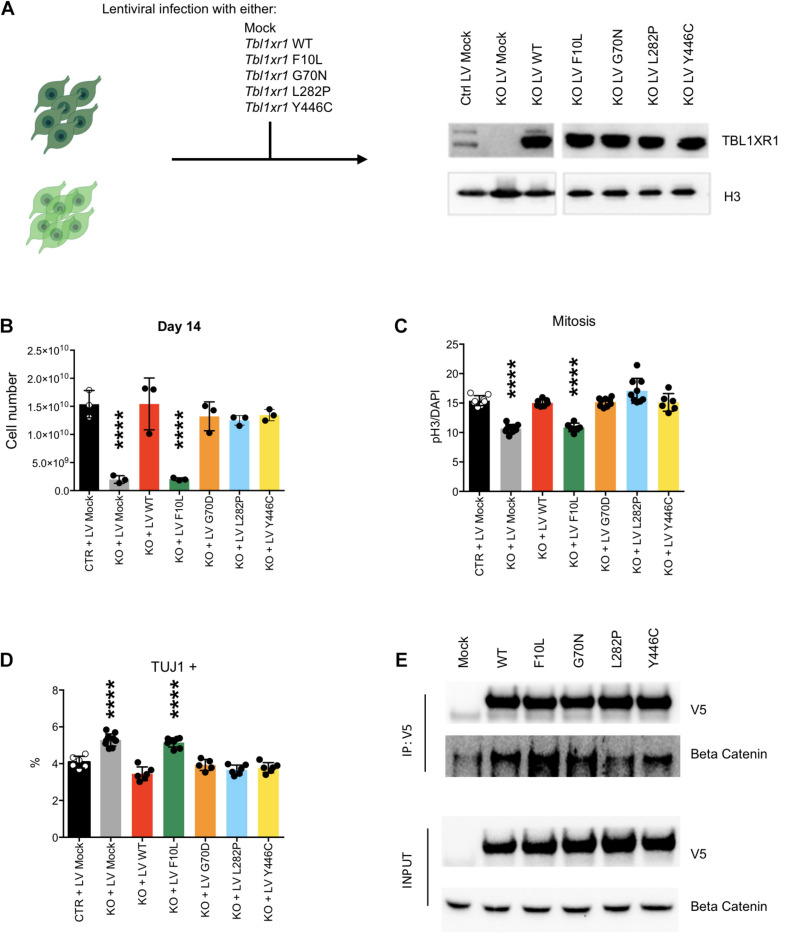
TBL1XR1 gene is associated with multiple developmental disorders presenting several neurological aspects. The relative protein is involved in the modulation of important cellular pathways and master regulators of transcriptional output, including nuclear receptor repressors, Wnt signaling, and MECP2 protein. However, TBL1XR1 mutations (including complete loss of its functions) have not been experimentally studied in a neurological context, leaving a knowledge gap in the mechanisms at the basis of the diseases. Here, we show that Tbl1xr1 knock-out mice exhibit behavioral and neuronal abnormalities. Either the absence of TBL1XR1 or its point mutations interfering with stability/regulation of NCOR complex induced decreased proliferation and increased differentiation in neural progenitors. We suggest that this developmental unbalance is due to a failure in the regulation of the MAPK cascade. Taken together, our results broaden the molecular and functional aftermath of TBL1XR1 deficiency associated with human disorders.

Keywords: MAPK; NCOR; TBL1XR1; brain development; neurodevelopmental disorders.


Conflict of interest statement

The authors declare that the research was conducted in the absence of any commercial or financial relationships that could be construed as a potential conflict of interest.

Figures

FIGURE 1
FIGURE 1
Behavioral deficit of Tbl1xr1 mutant mouse. (A) Breeding strategy for obtaining both Tbl1xr1 mutant and control (left), table summarizing mutant animals found at the indicated developmental stages (center) and Western blot for TBL1XR1 protein in control and mutant brain tissue (right). (B) Rotarod motor test (shown as mean + s.e.m. with dots representing individual samples): n (adult male mice): Ctrl = 21, KO = 17, *p = 0.02, statistically compared using unpaired t-test. (C) Beam walking assay in which time of crossing and number of errors (paw falls) have been quantified (shown as mean + s.e.m. with dots representing individual samples): crossing time (top): n (adult male mice): Ctrl = 21, KO = 17, p = 0.9933, statistically compared using Mann-Whitney; errors (bottom): n (adult male mice): Ctrl = 21, KO = 17, *p = 0.0126, statistically compared using unpaired t-test. (D) Through catwalk assay we measured stride length, position of the paw during walking (print position) and support that the animal has during walking (shown as mean + s.e.m.), n (adult male mice): Ctrl = 21, KO = 17: *p < 0.05. Statistically compared using 2-way ANOVA. (E) Marble burying test in which the percentage of buried marble spheres has been quantified (shown as mean + s.e.m. with dots representing individual samples), n (adult male mice): Ctrl = 21, KO = 20: **p = 0.0028, statistically compared using unpaired t-test. (F) Eight-arm radial maze test quantified in which the percentage of errors (entries in arms already visited) on total visits has been quantified (shown as means ± SEMs in each experimental day, 1 trial/day), n (adult male mice): Ctrl = 21, KO = 17: Multiple comparisons: day 1: ***p = 0.0001; day 2: **p = 0.007; day 3: **p = 0.0039: day 4: *p = 0.021; day 5: p > 0.9999; day 6: p = 0.7603; day 7: p > 0.9999; day 8: p > 0.9999; day 9: p > 0.9999; day 10: p > 0.9999; statistically compared using 2-way ANOVA and Bonferroni’s post hoc test. (G) Sociability of adult animals measured as the time spent to interact with a novel mouse in the resident/intruder test (shown at right as means ± SEMs, with dots representing individual samples), n (adult male mice): Ctrl = 20, KO = 19: ***p = 0.0009; statistically compared using unpaired t-test. (H) Three-chamber test (scheme at left) quantified as percentage of the time spent sniffing the mouse enclosed in the little cage vs. the empty cage shown as discrimination index (DI) (shown as means ± SEMs, with dots representing individual samples), n (adult male mice): Ctrl = 21, KO = 17: sniffing: *p = 0.0287, statistically compared using unpaired t-test. See also Supplementary Figure S1.
FIGURE 2
FIGURE 2
Defects of Tbl1xr1 mutant neurons. (A) Adult brains from both control and Tbl1xr1 mutant mice showed similar brain to body ratio (shown as means ± SEMs, with dots representing individual samples), n: Ctrl = 12, KO = 13: p > 0.05, unpaired t-test. (B) Left, cresyl violet staining of coronal section of both control and mutant forebrains (cerebral corte, striatum, and hippocampus from adult mice of >than 2 months of age). right quantification of the cortical thickness in medial (green square) and lateral (red) position (shown as means ± SEMs, with dots representing individual samples), n: Ctrl = 4, KO = 4: rostral: ****p < 0.0001; central: ****p < 0.0001; rostral: *p < 0.0415. (C) Left, representative traces showing sEPSCs recorded in cortical pyramidal neurons in slices from control (black) and Tbl1xr1 mutant (gray) mice (animals of both sexes, 30 days of age) (bars: 50 pA, 500 ms). Right, summary boxplots for EPSC parameters (shown as box for interquartile range, median line and whiskers for highest and lowest values): mean amplitude, wt -8.6 ± 0.6 pA, KO -7.8 ± 0.3 pA, n = 19, p = 0.27, unpaired t-test; mean 10–90% rise time, wt 1.9 ± 0.2 ms, KO 2.0 ± 0.2 ms, n = 19, p = 0.78, unpaired t-test; mean decay time constant, wt 3.7 ± 0.3 ms, KO 3.6 ± 0.4 pA, n = 19, p = 0.87, unpaired t-test; mean frequency, wt 4.0 ± 0.3 Hz, KO 6.3 ± 0.4 Hz, n = 19, p < 0.001, unpaired t-test. (D) Hippocampal cultures from control and mutant E17.5 embryos at 7 days in vitro (DIV) infected with low titer GFP lentivirus (at DIV0) and Sholl analysis for the quantification of the intersection of neurites accordingly with the distance to the soma, ****p < 0.0001, 2-way ANOVA. (E) Hippocampal cultures from control and mutant E17.5 embryos at 14 days in vitro (DIV) infected with low titer GFP lentivirus (at DIV0) and Sholl analysis for the quantification of the intersection of neurites accordingly with the distance to the soma, ****p < 0.0001, 2-way ANOVA. Scale bars: (B) 400 μm; (D,E) 50 μm. See also Supplementary Figure S2.
FIGURE 3
FIGURE 3
Loss of Tbl1xr1 affects neural stem cells dynamics. (A) Scheme of NSC derivation with examples of: genotyping (by PCR), expression of Tb1xr1 (mRNA abundance by RT-qPCR, ****p < 0.0001, unpaired t-test), and TBL1XR1 protein level (by Western blot). (B) NSCs both Ctrl and KO cultured as neurospheres, on the right quantification of spheres’ diameter: difference due to genotype, F(1,40) = 63.19, ****p < 0.0001, 2-way ANOVA. (C) Growth curve of adherent in vitro NSCs: difference due to genotype, F(1,4) = 535.6, ****p < 0.0001, 2-way ANOVA. (D) Immunocytochemistry of both Ctrl and Tbl1xr1 KO proliferating NSCs for phosphor histone 3 (PH3) counterstained with DAPI. On the right, quantification of PH3+ cells on total DAPI nuclei, ****p < 0.0001, unpaired t-test. (E) Up, immunocytochemistry of both Ctrl and Tbl1xr1 KO differentiating NSCs for S100b (astrocytes), TUJ1 (neurons) and O4 (oligodendrocytes) counterstained with DAPI. Bottom, quantification: TUJ1: ****p < 0.0001, unpaired t-test; S100b: ****p < 0.0001, unpaired t-test; O4: ***p = 0.0002, unpaired t-test. Scale bars: (B) 40 μm; (D,E) 50 μm.
FIGURE 4
FIGURE 4
Molecular defects of Tbl1xr1 KO neural stem cells. (A) Western blot analysis of both cytosolic (enriched in GAPDH, used as normalizer) and nuclear (enriched in H3, used as normalizer) protein fractions from control and Tbl1xr1 KO in vitro NSCs for the following proteins: TBL1XR1, NCOR1, and HDAC3. On the right, the quantification of the blots for NCOR1 and HDAC3 (shown as mean + s.e.m. with dots representing individual samples): cytoplasmic NCOR1: n (biological replicates): Ctrl = 3, KO = 3: p = 0.2407; nuclear NCOR1: n (biological replicates): Ctrl = 3, KO = 3: ***p = 0.0002; cytoplasmic HDAC3: n (biological replicates): Ctrl = 4, KO = 4: ***p = 0.0007; nuclear HDAC3: n (biological replicates): Ctrl = 4, KO = 4: **p = 0.0013. Statistically compared using t-test. (B) Western blot analysis of whole protein lysates from control and Tbl1xr1 KO in vitro NSCs for the following proteins: TBL1XR1, βCATENIN and its phosphorylated form (Ser33/37/Thr41). On the right, the quantification of the blots for βCATENIN and pβCATENIN: n (biological replicates): Ctrl = 6, KO = 6: βCATENIN p = 0.2878; pβCATENIN ****p < 0.0001. Statistically compared using unpaired t-test. (C) MA plot showing log2 fold changes as function of average normalized gene expression (RPKM) for control against KO in vitro NSCs (RNAseq data). Differentially expressed genes are highlighted in red. (D) Left, heat-map showing the differentially expressed genes between control and KO NSCs. Right, Gene Ontology analysis for terms indicating both the biological processes (up) and KEGG pathways (bottom), for upregulated (red, left) and downregulated (blue, right) genes in Tbl1xr1 KO NSCs compared to control. (E) Left, Venn diagram showing the overlap between TBL1XR1 gene targets (brown, publicly available ChIP-seq data obtained from GM12878 cells) and genes up (red) and down-regulated (blue) in Tbl1xr1 KO NSCs. Right, Gene Ontology analysis for terms indicating the biological processes for TBL1XR1 targets that are also upregulated (the red/brown intersection) and downregulated (the blue/brown intersection) genes in Tbl1xr1 KO NSCs compared to control. (F) MAPK pathways found altered between control and Tbl1xr1 KO NSCs ordinated accordingly their role within the pathway (scheme on the right). Red = upregulated in mutant; blue = downregulated in mutant; dark color = statistically significant; light color = trend. (G) Western blot analysis of whole protein lysates from control and Tbl1xr1 KO NSCs treated or not with 100 μM of glutamate for the following proteins: ERK1 and its phosphorylated form (Thr202/Tyr204). On the right, the quantification: n: Ctrl = 4, KO = 4, 0 mM of glutamate: ERK1 p = 0.3898; pERK1 ****p < 0.0001; 100 μM of glutamate: ERK1 p = 0.7170; pERK1 ****p < 0.0001; Statistically compared using unpaired t-test. (H) Motif enrichment analysis using Homer on promoters (–1,000 + 100 from TSS) og genese downregulated in Tbl1xr1 KO NSCs (n = 1,754). (I) Quantification of the immunocytochemistry for PH3 in both Ctrl and Tbl1xr1 KO proliferating NSCs in a medium with either normal (10 μM) or low levels (5 μM) of EGF, counterstained with DAPI. 10 μM: n: Ctrl = 8, KO = 8, ****p < 0.0001; n: Ctrl = 5, KO = 5, p = 0.9055; one-way ANOVA. See also Supplementary Tables S2, S5.
FIGURE 5
FIGURE 5
Complementation of Tbl1xr1 KO neural stem cells. (A) Experimental design and Western blot analysis of whole protein lysates from the indicated NSCs for TBL1XR1 (H3 was used for normalization). (B) Final point (day 14) of growth curves of the indicated NSCs (see also Supplementary Figure S5A) (shown as mean + s.e.m. with dots representing individual samples): Ctrl + LV Mock vs.: KO + LV Mock ****p < 0.0001; KO + LV WT p > 0.9999; KO + LV F10L ****p < 0.0001; KO + LV G70D p = 0.7111; KO + LV L282P p = 0.4644; KO + LV Y446C p = 0.7894; one-way ANOVA with Dunnett’s multiple comparisons test. (C) Quantification of the immunocytochemistry for PH3 in the indicated NSCs (see also Supplementary Figure S5C) (shown as mean + s.e.m. with dots representing individual samples): Ctrl + LV Mock vs.: KO + LV Mock ****p < 0.0001; KO + LV WT p = 0.9710; KO + LV F10L ****p < 0.0001; KO + LV G70D p = 0.9960; KO + LV L282P p = 0.0556; KO + LV Y446C p = 0.9924; one-way ANOVA with Dunnett’s multiple comparisons test. (D) Quantification of the immunocytochemistry for TUJ1 in the indicated NSCs (shown as mean + s.e.m. with dots representing individual samples): Ctrl + LV Mock vs.: KO + LV Mock ****p < 0.0001; KO + LV WT p = 0.1075; KO + LV F10L ****p < 0.0001; KO + LV G70D p = 0.8997; KO + LV L282P p = 0.0789; KO + LV Y446C p = 0.3241; one-way ANOVA with Dunnett’s multiple comparisons test. (E) Western blot analysis of precipitated fraction and input of immune-precipitation experiment using the antibody against V5 tag that is fused to each Tbl1xr1 isoforms, for V5 and βCATENIN.

Similar articles

Cited by

References

    1. Azari H., Rahman M., Sharififar S., Reynolds B. A. (2010). Isolation and expansion of the adult mouse neural stem cells using the neurosphere assay. J. Vis. Exp. 45:2393. 10.3791/2393 - DOI - PMC - PubMed
    1. Bem J., Brożko N., Chakraborty C., Lipiec M. A., Koziński K., Nagalski A., et al. (2019). Wnt/β-catenin signaling in brain development and mental disorders: keeping TCF7L2 in mind. FEBS Lett. 593 1654–1674. 10.1002/1873-3468.13502 - DOI - PMC - PubMed
    1. Borrell V. (2019). Recent advances in understanding neocortical development. F1000Res 8:F1000FacultyRev–1791. 10.12688/f1000research.20332.1 - DOI - PMC - PubMed
    1. Castelo-Branco G., Lilja T., Wallenborg K., Falcao A. M., Marques S. C., Gracias A., et al. (2014). Neural stem cell differentiation is dictated by distinct actions of nuclear receptor corepressors and histone deacetylases. Stem Cell Reports 3 502–515. 10.1016/j.stemcr.2014.07.008 - DOI - PMC - PubMed
    1. Chenn A., Walsh C. A. (2002). Regulation of cerebral cortical size by control of cell cycle exit in neural precursors. Science 297 365–369. 10.1126/science.1074192 - DOI - PubMed