

Gut Microbial Profile Is Associated With Residential Settings and Not Nutritional Status in Adults in Karnataka, India
- PMID: 33708787
- PMCID: PMC7940358
- DOI: 10.3389/fnut.2021.595756
Gut Microbial Profile Is Associated With Residential Settings and Not Nutritional Status in Adults in Karnataka, India
Abstract
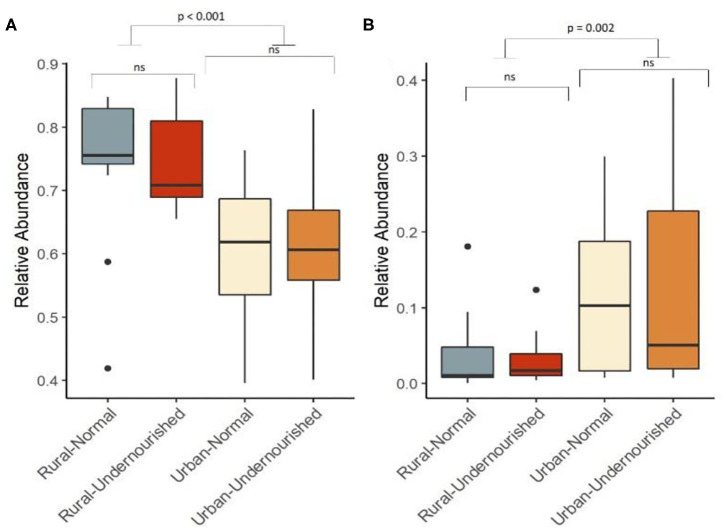
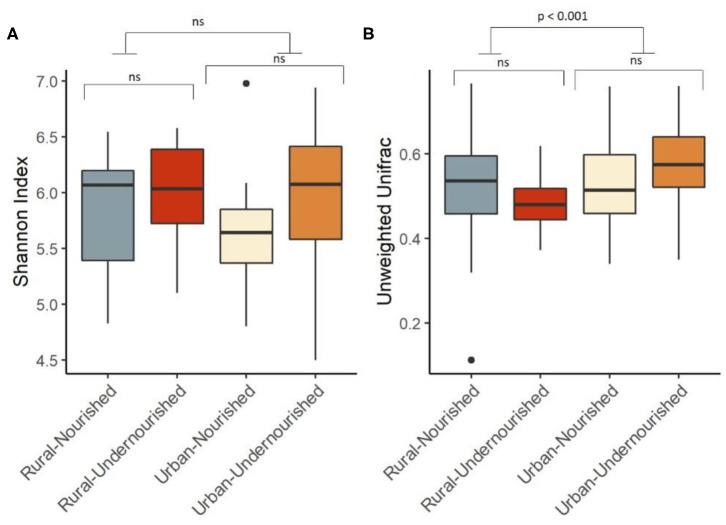
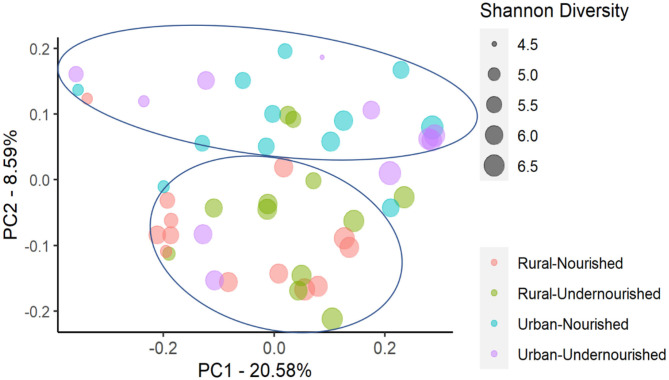
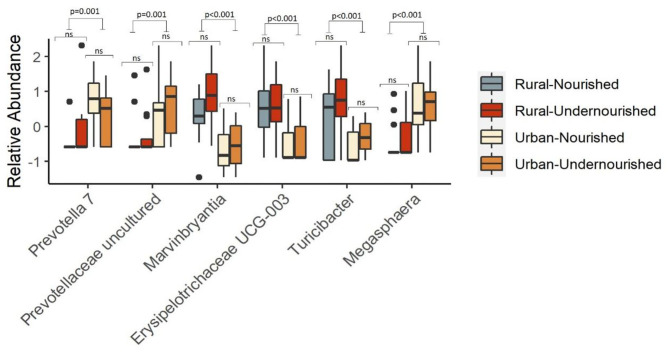
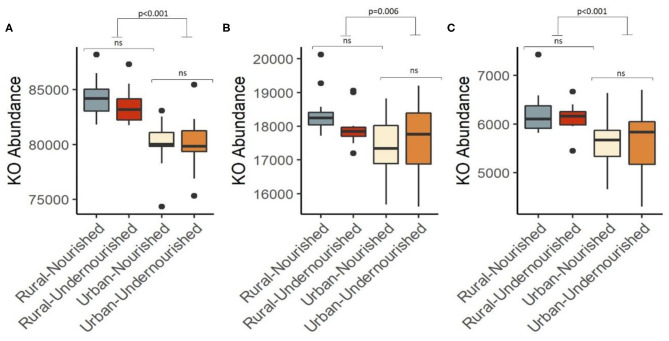
Undernutrition is a leading contributor to disease and disability in people of all ages. Several studies have reported significant association between nutritional status and gut microbiome composition but other factors such as demographic settings may also influence the adult microbiome. The relationship between undernourishment and gut microbiome in adults has not been described to date. In this study, we compared the gut microbiome in fecal samples of 48 individuals, from two demographic settings (rural and urban slum) in Karnataka, India using 16S rRNA sequencing. Nutritional status was assessed based on BMI, with a BMI of < 18.5 kg/m2 classified as undernourished, and a BMI in the range 18.5-25 kg/m2 as nourished. We analyzed 25 individuals from rural settings (12 undernourished and 13 nourished) and 23 individuals from urban slum settings (11 undernourished and 12 nourished). We found no significant difference in overall gut microbial diversity (Shannon and Unweighted UniFrac) between undernourished and nourished individuals in either geographical settings, however, microbial taxa at the phylum level (i.e., Firmicutes and Proteobacteria) and beta diversity (unweighted UniFrac) differed significantly between the rural and urban slum settings. By predicting microbial function from 16S data profiling we found significant differences in metabolic pathways present in the gut microbiota from people residing in different settings; specifically, those related to carbohydrate and lipid metabolism. The weighted sum of the KEGG Orthologs associated with carbohydrate metabolism (Spearman's correlation coefficient, ρ = -0.707, p < 0.001), lipid metabolism (Spearman's correlation coefficient, ρ = -0.330, p < 0.022) and biosynthesis of secondary metabolites (Spearman's correlation coefficient, ρ = -0.507, p < 0.001) were decreased in the urban slum group compared to the rural group. In conclusion, we report that the geographical location of residence is associated with differences in gut microbiome composition in adults. We found no significant differences in microbiome composition between nourished and undernourished adults from urban slum or rural settings in India.
Keywords: BMI; adults'; gut microbiota; rural—urban linkages; undernourished.
Copyright © 2021 Mehta, Inbaraj, Astbury, Grove, Norman, Aithal, Valdes and Vijay.
Conflict of interest statement
AMV is a consultant for Zoe Global Ltd., and a member of the scientific advisory board of CPKelco. GA has served as a consultant and an advisory board member for Pfizer and Glaxo SmithKline; he has been a consultant to Amryt Pharmaceuticals and Astra Zeneca. The remaining authors declare that the research was conducted in the absence of any commercial or financial relationships that could be construed as a potential conflict of interest.
Figures
References
-
- International Institute for Population Sciences . National Family Health Survey (NFHS-3), 2005-06: India: Volume I. Mumbai: IIPS; (2007).
-
- Fact sheets—Malnutrition. Available online at: https://www.who.int/news-room/fact-sheets/detail/malnutrition (accessed June 29, 2020).
-
- Swaminathan S, Hemalatha R, Pandey A, Kassebaum NJ, Laxmaiah A, Longvah T, et al. The burden of child and maternal malnutrition and trends in its indicators in the states of India: the Global Burden of Disease Study 1990-2017. Lancet Child Adolesc Heal. (2019) 3:855–70. https://www.researchgate.net/deref/http%3A%2F%2Fdx.doi.org%2F10.10%2F16%... - PMC - PubMed
Grants and funding
LinkOut - more resources
Full Text Sources
Other Literature Sources