. 2021 Feb;9(3):240.
doi: 10.21037/atm-20-4865.

Alteration of spatial patterns at the network-level in facial synkinesis: an independent component and connectome analysis

Affiliations

Alteration of spatial patterns at the network-level in facial synkinesis: an independent component and connectome analysis

Zhen-Zhen Ma et al. Ann Transl Med. 2021 Feb.

Abstract

Background: The treatment of post-facial palsy synkinesis (PFPS) remains inadequate. Previous studies have confirmed that brain plasticity is involved in the process of functional restoration. Isolated activation has been well studied, however, the brain works as an integrity of several isolated regions. This study aimed to assess the alteration of the brain network topology with overall and local characteristics of information dissemination. Understanding the neural mechanisms of PFPS could help to improve therapy options and prognosis.

Methods: Patients with facial synkinesis and healthy controls (HCs) were estimated using functional magnetic resonance imaging (fMRI) of resting-state. Subsequently, an independent component analysis (ICA) was used to extract four subnets from the whole brain. Then we used the measurements of graph theory and calculated in the whole-brain network and each sub-network.

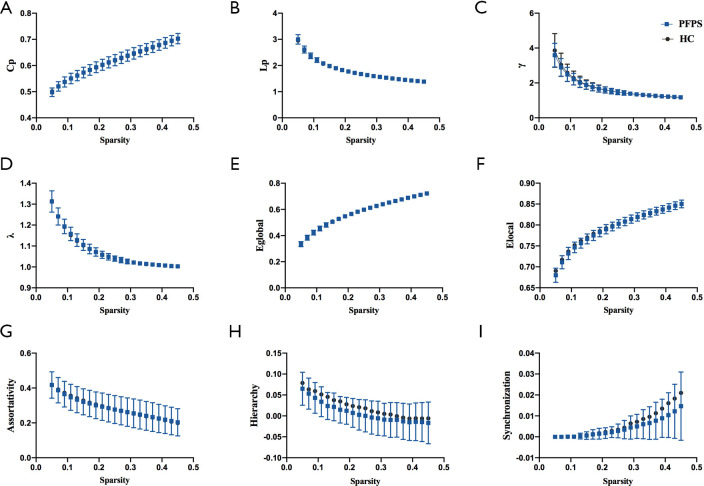
Results: We found no significant difference between the patient group and the HCs on the whole-brain scale. Then we identified four subnetworks from the resting-state data. In the sub-network property analysis, patients' locally distributed properties in the sensorimotor network (SMN) and ventral default mode network (vDMN) were reduced. It revealed that γ (10,000 permutations, P=0.048) and S (10,000 permutations, P=0.022) within the SMN progressively decreased in patients with PFPS. For the analysis of vDMN, significant differences were found in γ (10,000 permutations, P=0.019), Elocal (10,000 permutations, P=0.008), and β (10,000 permutations, P=0.011) between the groups.

Conclusions: Our results demonstrated a reduction in local network processing efficiency in patients with PFPS. Therefore, we speculate that decreased characteristics in the intra-vDMN and intra-SMN, rather than the whole-brain network, may serve distinct symptoms such as facial nerve damage or more synkinetic movements. This finding of the alteration of network properties is a small step forward to help uncover the underlying mechanism.

Keywords: Post-facial palsy synkinesis (PFPS); default mode network (DMN); graph theory analysis; independent component analysis (ICA); sensorimotor network (SMN).


Conflict of interest statement

Conflicts of Interest: All authors have completed the ICMJE uniform disclosure form (available at http://dx.doi.org/10.21037/atm-20-4865). All authors report grants from Open Project of Shanghai Key Laboratory of Peripheral Nerve and Microsurgery [Grant Number 17DZ2270500], during the conduct of the study. The other authors have no conflicts of interest to declare.

Figures

Figure 1
Figure 1
The spatial distribution pattern of four potential sub-networks extracted from resting-data by ICA. Four components (A-D) resemble the RSNs described in a previous study (18) and consist of regions known to be involved in the sensorimotor network (A), FPN (B), dDMN (C), and vDMN (D). Images (coronal, sagittal, and axial views) are t-statistics overlaid on the average high-resolution scan transformed into MNI152. Red to yellow represents t values, ranging from 6.0 to 12.0. The left hemisphere of the brain corresponds to the right side of the image. ICA, independent component analysis; RSNs, resting-state networks; MNI, Montreal neurological institute.
Figure 2
Figure 2
Global topological properties of functional connectome between the groups. The statistical comparison of area under the curve (AUC) showed no significant difference in Cp, Lp, γ, λ, Eglobal, Elocal, assortativity, hierarchy, or synchronization between groups, and the bin-width of sparsity was 0.01. PFPS group: red symbols and lines; HC group: gray symbols and lines.
Figure 3
Figure 3
Functional brain network properties of the SMN with a bin-width sparsity of 0.02. The area under the curve (AUC) displayed no significant differences in Cp, Lp, γ, λ, Eglobal, Elocal, assortativity, hierarchy, or synchronization between the groups. While the index γ was significantly lower in the PFPS group (P=0.048) and the index of synchronization was significantly decreased in patients (P=0.022). PFPS group: yellow symbols and lines; HC group: gray symbols and lines. *, indicates a significant difference between the PFPS group and the HC group.
Figure 4
Figure 4
Functional brain network properties of the FPN with a bin-width sparsity of 0.02. The area under the curve (AUC) displayed no significant differences in Cp, Lp, γ, λ, Eglobal, Elocal, assortativity, hierarchy, or synchronization between the groups. PFPS group: blue symbols and lines; HC group: gray symbols and lines.
Figure 5
Figure 5
Functional brain network properties of the dDMNs with a bin-width sparsity of 0.02. The area under the curve (AUC) displayed no significant differences in Cp, Lp, γ, λ, Eglobal, Elocal, assortativity, hierarchy, or synchronization between the groups. PFPS group: blue symbols and lines; HC group: gray symbols and lines.
Figure 6
Figure 6
Functional brain network properties of the vDMN with a bin-width sparsity of 0.02. The area under the curve (AUC) displayed no significant differences in Cp, Lp, γ, λ, Eglobal, Elocal, assortativity, hierarchy, or synchronization between the groups. The index γ, Elocal, and hierarchy were significantly lower in the PFPS group (P values were 0.019, 0.008, and 0.011, respectively). PFPS group: orange symbols and lines; HC group: gray symbols and lines. *, indicates a significant difference between the PFPS group and the HC group.

References

    1. Markey JD, Loyo M. Latest advances in the management of facial synkinesis. Curr Opin Otolaryngol Head Neck Surg 2017;25:265-72. 10.1097/MOO.0000000000000376 - DOI - PubMed
    1. Shinn JR, Nwabueze NN, Du L, et al. Treatment Patterns and Outcomes in Botulinum Therapy for Patients With Facial Synkinesis. JAMA Facial Plast Surg 2019;21:244-51. 10.1001/jamafacial.2018.1962 - DOI - PMC - PubMed
    1. Cronin GW. The effectiveness of neuromuscular facial retraining combined with electromyography in facial paralysis rehabilitation. Otolaryngol Head Neck Surg 2003;128:534-8. 10.1016/S0194-5998(03)00005-6 - DOI - PubMed
    1. Tenney AP, Livet J, Belton T, et al. Etv1 Controls the Establishment of Non-overlapping Motor Innervation of Neighboring Facial Muscles during Development. Cell Rep 2019;29:437-52.e4. 10.1016/j.celrep.2019.08.078 - DOI - PMC - PubMed
    1. Watanabe Y, Akizuki T, Ozawa T, et al. Dual innervation method using one-stage reconstruction with free latissimus dorsi muscle transfer for re-animation of established facial paralysis: simultaneous reinnervation of the ipsilateral masseter motor nerve and the contralateral facial nerve to improve the quality of smile and emotional facial expressions. J Plast Reconstr Aesthet Surg 2009;62:1589-97. 10.1016/j.bjps.2008.07.025 - DOI - PubMed

LinkOut - more resources