. 2021 Mar 9;7(2):e560.
doi: 10.1212/NXG.0000000000000560. eCollection 2021 Apr.

Polygenic Risk Scores Augment Stroke Subtyping

Affiliations

Polygenic Risk Scores Augment Stroke Subtyping

Jiang Li et al. Neurol Genet. .

Abstract

Objective: To determine whether the polygenic risk score (PRS) derived from MEGASTROKE is associated with ischemic stroke (IS) and its subtypes in an independent tertiary health care system and to identify the PRS derived from gene sets of known biological pathways associated with IS.

Methods: Controls (n = 19,806/7,484, age ≥69/79 years) and cases (n = 1,184/951 for discovery/replication) of acute IS with European ancestry and clinical risk factors were identified by leveraging the Geisinger Electronic Health Record and chart review confirmation. All Geisinger MyCode patients with age ≥69/79 years and without any stroke-related diagnostic codes were included as low risk control. Genetic heritability and genetic correlation between Geisinger and MEGASTROKE (EUR) were calculated using the summary statistics of the genome-wide association study by linkage disequilibrium score regression. All PRS for any stroke (AS), any ischemic stroke (AIS), large artery stroke (LAS), cardioembolic stroke (CES), and small vessel stroke (SVS) were constructed by PRSice-2.

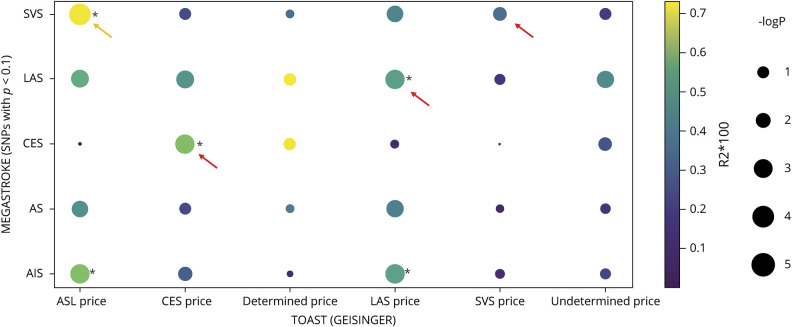
Results: A moderate heritability (10%-20%) for Geisinger sample as well as the genetic correlation between MEGASTROKE and the Geisinger cohort was identified. Variation of all 5 PRS significantly explained some of the phenotypic variations of Geisinger IS, and the R 2 increased by raising the cutoff for the age of controls. PRSLAS, PRSCES, and PRSSVS derived from low-frequency common variants provided the best fit for modeling (R 2 = 0.015 for PRSLAS). Gene sets analyses highlighted the association of PRS with Gene Ontology terms (vascular endothelial growth factor, amyloid precursor protein, and atherosclerosis). The PRSLAS, PRSCES, and PRSSVS explained the most variance of the corresponding subtypes of Geisinger IS suggesting shared etiologies and corroborated Geisinger TOAST subtyping.

Conclusions: We provide the first evidence that PRSs derived from MEGASTROKE have value in identifying shared etiologies and determining stroke subtypes.


Figures

Figure 1
Figure 1. Estimated Heritability of Geisinger Ischemic Stroke and the Genetic Correlation Between Geisinger Sample and MEGASTROKE Sample
The chip-based heritability (formula image
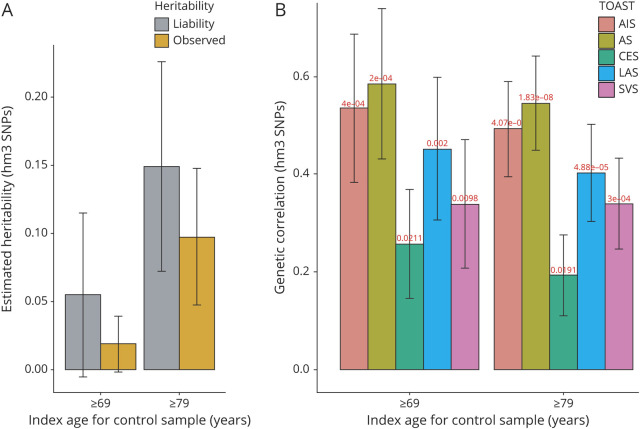
, A) and genetic correlation (rg, B) were calculated by LDSC using genotyped HapMap 3 SNPs (hm3). Both the observed scale and the liability scale h2, later of which was adjusted by the sample prevalence and population prevalence, were presented in the y-axis, including error bars for the estimates. We assumed a trait prevalence of 1% for all phenotypes and tested the robustness of heritability (formula image) under 2 levels of controls. AIS = any ischemic stroke; AS = any stroke; CES = cardioembolic stroke; LAS = large artery stroke; LDSC = linkage disequilibrium score regression; SNP = single nucleotide polymorphism; SVS = small vessel stroke.
Figure 2
Figure 2. Sensitivity Analysis to Show the Predictive Power of PRS
We conducted a sensitivity analysis to determine whether this predictive power (R2 and significance for the nonzero regression coefficient for PRS) can be improved by raising the cutoff for the age of controls. (A) We simulate the same number of controls as to the corresponding controls ≥69 or ≥79 by a random selection from controls ≥59 to determine this augmented predictive power, if any, was largely due to natural selection in aged nonstroke individuals but not due to the change in the case:control ratio. This improved predictive power was independent of the prevalence of the disease or case:control ratio as shown by this dot plot. (B) The association between PRSz-score derived from 5 summary statistics of MEGASTROKE and ischemic stroke was tested by logistic regression (phenotype ∼ PRSz-score + sex + PC1-5.). The PRS was calculated by PRSice-2 using the average score (avg) equation (default) from the best-fit modeling. The raw PRSavg was z score transformed into PRSz-score to compare the odds ratios across the analyses. Odds ratios (ORs) (y-axis) and significant levels (dot size) were calculated by the R glm. (C) The association of PRSz-score derived from the summary statistics of MEGASTROKE AIS with ischemic stroke and its major clinical risk factors were tested by the same logistic regression and visualized by the forest plot. AIS = any ischemic stroke; AS = any stroke; CES = cardioembolic stroke; LAS = large artery stroke; PRS = polygenic risk score; SVS = small vessel stroke.
Figure 3
Figure 3. PRS Derived From Lower MAF Variants Provided the Best-Fit Modeling for the Ischemic Stroke
Nonrelated individuals (piHAT ≤0.20) from the discovery and replication data sets with a random split of control samples were included in the association analysis. PRS derived from genetic variants with relatively lower MAF provided the best-fit modeling for the ischemic stroke (red dots) when PRS was constructed based on the summary statistics of TOAST subtypes such as LAS, SVS, and CES as compared to PRS constructed based on the summary statistics of AS or AIS. Both discovery data set and replication data set showed the same profile. The size of the dots represents the R2, a measure of the proportion of the variance explained by the model. The y-axis represents the significance of the model fit. The total number of variants included in the analysis under two MAF thresholds was also listed on the top. AIS = any ischemic stroke; AS = any stroke; CES = cardioembolic stroke; LAS = large artery stroke; MAF = minor allele frequency; PRS = polygenic risk score; SNP = single nucleotide polymorphism; SVS = small vessel stroke.
Figure 4
Figure 4. Gene Sets Analyses Illustrated the Top Five Pathways Enriched for Ischemic Stroke (Controls With Index Age ≥69 years) After Meta-analysis of Discovery Data Set (n = 1,076/10,107) and Replication Data set (n = 941/8,145) When the PRS Was Constructed Based on Each of the Five Summary Statistics of MEGASTROKE
The sex and 5 major PCs were included as covariates in the logistic regression model for each data set. The meta-analysis was conducted by metal with weighted effect size (coefficient) estimates using the inverse of the corresponding standard errors. Sample overlap correction was not performed because of no overlapping samples between discovery and replication samples. The global genes were selected as a universal background for gene sets analyses, and the mapping file was “Homo_sapiens.GRCh37.87.gtf.” PRSs derived from gene sets defined by the Gene Ontology Biological Process were calculated to test their association with an ischemic stroke under 2 MAF thresholds (MAF < 0.025 or < 1), which represents low-frequency common variants or all variants accordingly. Seven thousand three hundred forty-nine pathways and their related gene sets were defined by Molecular Signatures Database (“msigdb_v7.0_GMTs/c5.bp.v7.0.symbols.gmt”). Exploration of the top 5 pathways enriched from PRS gene sets analyses after the meta-analysis of discovery and replication data sets using each summary statistics from MEGASTROKE to construct PRS under 2 levels of MAF thresholding (y-axis). The red or blue bar represents the ischemic stroke has a negative or positive association with the corresponding biological process according to the direction of the coefficient, respectively. All the p values in the x-axis were raw but survived multiple testing for Bonferroni correction as −log10(p) ≥ 5.17 (−log10(0.05/7,349)). AIS = any ischemic stroke; AS = any stroke; CES = cardioembolic stroke; LAS = large artery stroke; MAF = minor allele frequency; SVS = small vessel stroke; VEGF = vascular endothelial growth factor.
Figure 5
Figure 5. The PRS Derived From MEGASTROKE Subtypes Was Mostly Associated With the Corresponding Geisinger TOAST Subtypes
The dot plot demonstrated the association of PRS derived from MEGASTROKE on Geisinger TOAST subtypes when using base p < 0.1 as an example. The association between PRS and stroke subphenotypes was tested by logistic regression (phenotype ∼ PRSavg + sex + PC1–5). PRS derived from the MEGASTROKE consortium (y-axis) was calculated by PRSice-2 to determine their association with the TOAST subtypes of Geisinger ischemic stroke patients (x-axis). Nagelkerke pseudo-R2 (color of dots) and significant levels (size of dots) were calculated by PRSice-2 with clumping and thresholding (here using SNPs with base p < 0.1 as an example). *The significance of the association survived Bonferroni correction given 30 paralleled testing (punadjusted < 0.0017). We excluded any cases with a recurrent stroke of different TOAST subtypes. AIS = any ischemic stroke; AS = any stroke; CES = cardioembolic stroke (TOAST); DETERMINED = stroke of other determined etiology (TOAST); LAS = large artery stroke (TOAST); SNP = single nucleotide polymorphism; SVS = small vessel stroke (TOAST); UNDETERMINED = stroke of undetermined etiology (TOAST); ASL was a synthesized TOAST subtype that represents a combination of Acute SVS (n = 79) and LAS (n = 124).

References

    1. Neurology Working Group of the Cohorts for Heart and Aging Research in Genomic Epidemiology (CHARGE) Consortium, the Stroke Genetics Network (SiGN), and the International Stroke Genetics Consortium (ISGC). Identification of additional risk loci for stroke and small vessel disease: a meta-analysis of genome-wide association studies. Lancet Neurol 2016;15:695–707. - PMC - PubMed
    1. Malik R, Chauhan G, Traylor M, et al. . Multiancestry genome-wide association study of 520,000 subjects identifies 32 loci associated with stroke and stroke subtypes. Nat Genet 2018;50:524–537. - PMC - PubMed
    1. Khera AV, Chaffin M, Aragam KG, et al. . Genome-wide polygenic scores for common diseases identify individuals with risk equivalent to monogenic mutations. Nat Genet 2018;50:1219–1224. - PMC - PubMed
    1. Ibrahim-Verbaas CA, Fornage M, Bis JC, et al. . Predicting stroke through genetic risk functions: the CHARGE Risk Score Project. Stroke 2014;45:403–412. - PMC - PubMed
    1. Malik R, Bevan S, Nalls MA, et al. . Multilocus genetic risk score associates with ischemic stroke in case-control and prospective cohort studies. Stroke 2014;45:394–402. - PMC - PubMed