

Research and Exploratory Analysis Driven-Time-data Visualization (read-tv) software
- PMID: 33709063
- PMCID: PMC7935610
- DOI: 10.1093/jamiaopen/ooab007
Research and Exploratory Analysis Driven-Time-data Visualization (read-tv) software
Abstract
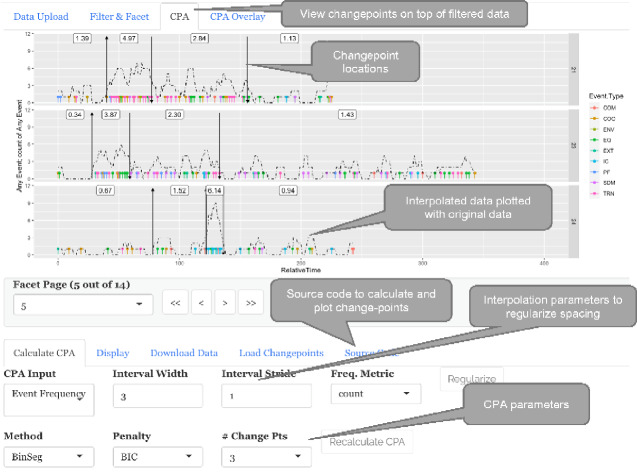
Motivation: Research & Exploratory Analysis Driven Time-data Visualization (read-tv) is an open source R Shiny application for visualizing irregularly and regularly spaced longitudinal data. read-tv provides unique filtering and changepoint analysis (CPA) features. The need for these analyses was motivated by research of surgical work-flow disruptions in operating room settings. Specifically, for the analysis of the causes and characteristics of periods of high disruption-rates, which are associated with adverse surgical outcomes.
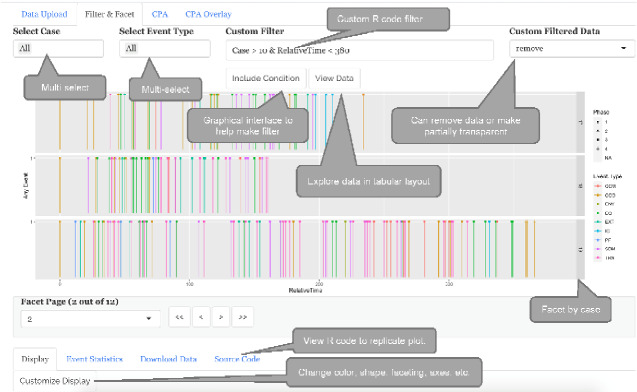
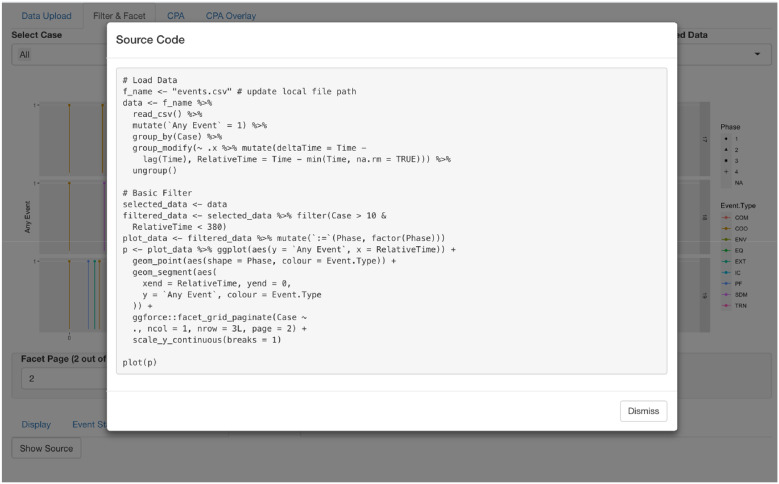
Materials and methods: read-tv is a graphical application, and the main component of a package of the same name. read-tv generates and evaluates code to filter and visualize data. Users can view the visualization code from within the application, which facilitates reproducibility. The data input requirements are simple, a table with a time column with no missing values. The input can either be in the form of a file, or an in-memory dataframe- which is effective for rapid visualization during curation.
Results: We used read-tv to automatically detect surgical disruption cascades. We found that the most common disruption type during a cascade was training, followed by equipment.
Discussion: read-tv fills a need for visualization software of surgical disruptions and other longitudinal data. Every visualization is reproducible, the exact source code that read-tv executes to create a visualization is available from within the application. read-tv is generalizable, it can plot any tabular dataset given the simple requirements that there is a numeric, datetime, or datetime string column with no missing values. Finally, the tab-based architecture of read-tv is easily extensible, it is relatively simple to add new functionality by implementing a tab in the source code.
Conclusion: read-tv enables quick identification of patterns through customizable longitudinal plots; faceting; CPA; and user-specified filters. The package is available on GitHub under an MIT license.
Keywords: R; Shiny; change point analysis; change-point analysis; changepoint analysis; forecasting; longitudinal visualization; surgical safety.
© The Author(s) 2021. Published by Oxford University Press on behalf of the American Medical Informatics Association.
Figures
References
-
- Fanny Meyer and Victor Perrier. esquisse: Explore and Visualize Your Data Interactively [program], 2020. R package version 0.3.0. https://CRAN.R-project.org/package=esquisse
-
- Gert Stulp. ggplotgui: Create Ggplots via a Graphical User Interface [program], 2017. R package version 1.0.0. https://CRAN.R-project.org/package=ggplotgui
-
- Calli Gross and Phillip Ottolinger. ggThemeAssist: Add-in to Customize ‘ggplot2’ Themes [program], 2016. R Package Version 0.1.5. https://cran.r-project.org/package=ggThemeAssist
-
- Davis Vaughan. silder: Sliding Window Functions [program], 2020. R Package Version 0.1.5. https://cran.r-project.org/package=slider
Grants and funding
LinkOut - more resources
Full Text Sources
Other Literature Sources
Molecular Biology Databases