. 2021 Mar 24;13(11):12982-12996.
doi: 10.1021/acsami.1c02338. Epub 2021 Mar 12.

Critical Parameters to Improve Pancreatic Cancer Treatment Using Magnetic Hyperthermia: Field Conditions, Immune Response, and Particle Biodistribution

Affiliations

Critical Parameters to Improve Pancreatic Cancer Treatment Using Magnetic Hyperthermia: Field Conditions, Immune Response, and Particle Biodistribution

Lilianne Beola et al. ACS Appl Mater Interfaces. .

Abstract

Magnetic hyperthermia (MH) was used to treat a murine model of pancreatic cancer. This type of cancer is generally characterized by the presence of dense stroma that acts as a barrier for chemotherapeutic treatments. Several alternating magnetic field (AMF) conditions were evaluated using three-dimensional (3D) cell culture models loaded with magnetic nanoparticles (MNPs) to determine which conditions were producing a strong effect on the cell viability. Once the optimal AMF conditions were selected, in vivo experiments were carried out using similar frequency and field amplitude parameters. A marker of the immune response activation, calreticulin (CALR), was evaluated in cells from a xenograft tumor model after the MH treatment. Moreover, the distribution of nanoparticles within the tumor tissue was assessed by histological analysis of tumor sections, observing that the exposure to the alternating magnetic field resulted in the migration of particles toward the inner parts of the tumor. Finally, a relationship between an inadequate body biodistribution of the particles after their intratumoral injection and a significant decrease in the effectiveness of the MH treatment was found. Animals in which most of the particles remained in the tumor area after injection showed higher reductions in the tumor volume growth in comparison with those animals in which part of the particles were found also in the liver and spleen. Therefore, our results point out several factors that should be considered to improve the treatment effectiveness of pancreatic cancer by magnetic hyperthermia.

Keywords: biodistribution; immunological effect; intratumor administration; iron oxide magnetic nanoparticles; magnetic hyperthermia; pancreatic cancer.


Conflict of interest statement

The authors declare no competing financial interest.

Figures
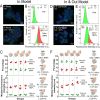
Figure 1
Figure 1
3D cell culture model characterization: In Model (left) and In&Out Model (right). (A, D) Confocal microscopy images. Red, MNPs (TAMRA); blue, 4′,6-diamidino-2-phenylindole (DAPI; nucleus); green: Alexa Fluor 488 Phalloidin. Scale bar is 10 μm. (B, E) Flow cytometry analysis of nanoparticle uptake. A representative histogram from three independent experiments is shown in the figure; in green is the cell population with no particles and in red is the cell population that contained internalized particles. (C, F) MNP uptake before and after exposure to different AMF conditions (AMF 1: 110 kHz; 31.9 kA/m. AMF 2: 377 kHz; 13 kA/m. AMF 3: 228 kHz; 23.9 kA/m) measured as a percentage of cells with MNPs and the changes in the MFI obtained from flow cytometry data. Statistical differences were determined using a two-way analysis of variance (ANOVA) followed by Sidak’s multiple comparisons test (**p < 0.01; *p < 0.05; p > 0.05 no significance).
Figure 2
Figure 2
Cell death induction (Annexin V/PI staining) 24 h after a single administration of magnetic hyperthermia treatment using different AMF conditions. In Model (left) and In&Out Model (right). AMF 1: 110 kHz, 31.9 kA/m. AMF 2: 377 kHz, 13 kA/m. AMF 3: 228 kHz, 23.9 kA/m. (A, B) Selected density plots representative of three independent experiments. Control experiments using AMF 1 and AMF 2 are shown in Figure S2 of the Supporting Information. (C, D) Summarized result data resulting from three independent experiments shown as mean ± SD. Significant differences with respect to the percentage of apoptotic cells between the control group and the treated groups were analyzed using a two-way ANOVA followed by Dunnet’s multiple comparisons test (****p < 0.0001; **p < 0.01; p > 0.05 no significance).
Scheme 1
Scheme 1. Schematic Representation of the Different Groups Used in the In Vivo Experiments and the Timeline of the Experiment Including the AMF Exposure and the Moments in Which the Animals Were Sacrificed for the Different Experiments
Control, animals without any treatment; AMF, animals exposed to the AMF but without the MNP injection; MNPs, animals that received the MNP injection but were not exposed to the AMF; and AMF + MNPs, animals that received the MNP injection and were then exposed to the AMF.
Figure 3
Figure 3
Magnetic nanoparticle uptake and calreticulin expression in animals from the control group, the group that received the MNP intratumor administration (MNPs), and the one that received the complete treatment (AMF + MNPs). (A) Flow cytometry histograms showing MNP internalization (top) and CALR expression (bottom) in cells obtained by digesting the whole tumor after the MH treatment. (B) Summarized data from flow cytometry experiments showing the percentage of cells that express CALR in the membrane in the cells without MNPs (top) and in the MNP-loaded cells (bottom). n = 2.
Figure 4
Figure 4
(A) Tumor evolution represented as the starting volume (Vmin) and maximum volume reached during the experiment (Vmax). (B) Same data as in panel A for the AMF + MNP group but divided into two subgroups with different behaviors: subgroup A, with a lower treatment effectiveness; and subgroup B, with a better response to the treatment. Significant differences with respect to the control were analyzed using a two-way ANOVA followed by Sidak’s multiple comparisons test (****p < 0.0001; ***p < 0.001; **p < 0.01; *p < 0.05; p > 0.05 no significance). In cases where more than one group generated significant differences with respect to the control, the means between those groups were also compared. This figure was produced using images from the Servier Medical Art PPT image bank.
Figure 5
Figure 5
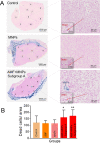
Histological analysis of tumor sections. (A) Representative tumor sections after Perls Prussian blue staining. The numbers represent the 10 random areas used for dead cell quantification in each section. (B) Summarized analysis of the dead cells per area in the different groups analyzed. The data are represented as mean ± SD. The statistical differences with respect to the control group were determined using a one-way ANOVA (**p < 0.01; *p < 0.05; p > 0.05 no significance).
Figure 6
Figure 6
MNP biodistribution assessed by AC magnetic susceptibility 30 days after their intratumor injection. Temperature dependence of the in-phase susceptibility from the (A) tumor and (B) liver 30 days after the intratumor injection. (C) Average iron concentration (associated with MNPs) calculated from the magnetic characterization analysis for each of the analyzed tissues (tumor, liver, spleen, and skin next to the tumor) for the two subgroups of animals that received the complete treatment (AMF + MNPs). This figure was produced using images from the Servier Medical Art PPT image bank.

References

    1. Kanat O.; Ertas H. Shattering the Castle Walls: Anti-Stromal Therapy for Pancreatic Cancer. World J. Gastrointest. Oncol. 2018, 10, 202–210. 10.4251/wjgo.v10.i8.202. - DOI - PMC - PubMed
    1. Elahi-Gedwillo K. Y.; Carlson M.; Zettervall J.; Provenzano P. P. Antifibrotic Therapy Disrupts Stromal Barriers and Modulates the Immune Landscape in Pancreatic Ductal Adenocarcinoma. Cancer Res. 2019, 79, 372–386. 10.1158/0008-5472.CAN-18-1334. - DOI - PMC - PubMed
    1. van Mackelenbergh M. G.; Stroes C. I.; Spijker R.; van Eijck C. H.; Wilmink J. W.; Bijlsma M. F.; van Laarhoven H. W. Clinical Trials Targeting the Stroma in Pancreatic Cancer: A Systematic Review and Meta-Analysis. Cancers 2019, 11, 58810.3390/cancers11050588. - DOI - PMC - PubMed
    1. Bogart L. K.; Pourroy G.; Murphy C. J.; Puntes V.; Pellegrino T.; Rosenblum D.; Peer D.; Lévy R. Nanoparticles for Imaging, Sensing, and Therapeutic Intervention. ACS Nano 2014, 8, 3107–3122. 10.1021/nn500962q. - DOI - PMC - PubMed
    1. Brachi G.; Bussolino F.; Ciardelli G.; Mattu C. Nanomedicine for Imaging and Therapy of Pancreatic Adenocarcinoma. Front. Bioeng. Biotechnol. 2019, 7, 30710.3389/fbioe.2019.00307. - DOI - PMC - PubMed