. 2021 May 25;143(21):2091-2109.
doi: 10.1161/CIRCULATIONAHA.120.051171. Epub 2021 Mar 12.

Extracellular Tuning of Mitochondrial Respiration Leads to Aortic Aneurysm

Affiliations

Extracellular Tuning of Mitochondrial Respiration Leads to Aortic Aneurysm

Jorge Oller et al. Circulation. .

Abstract

Background: Marfan syndrome (MFS) is an autosomal dominant disorder of the connective tissue caused by mutations in the FBN1 (fibrillin-1) gene encoding a large glycoprotein in the extracellular matrix called fibrillin-1. The major complication of this connective disorder is the risk to develop thoracic aortic aneurysm. To date, no effective pharmacologic therapies have been identified for the management of thoracic aortic disease and the only options capable of preventing aneurysm rupture are endovascular repair or open surgery. Here, we have studied the role of mitochondrial dysfunction in the progression of thoracic aortic aneurysm and mitochondrial boosting strategies as a potential treatment to managing aortic aneurysms.

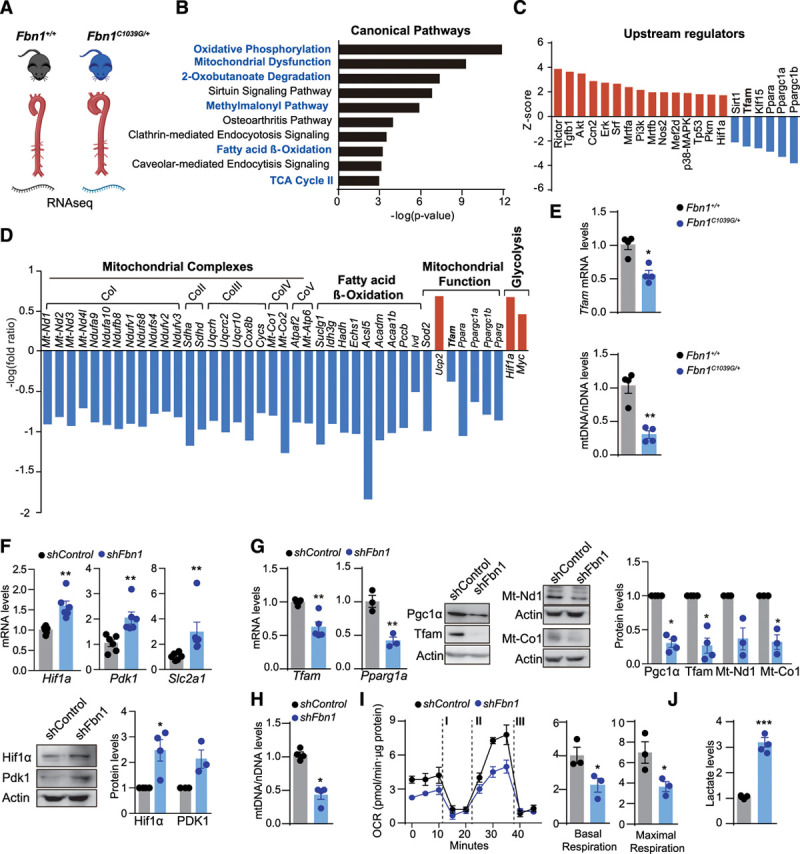
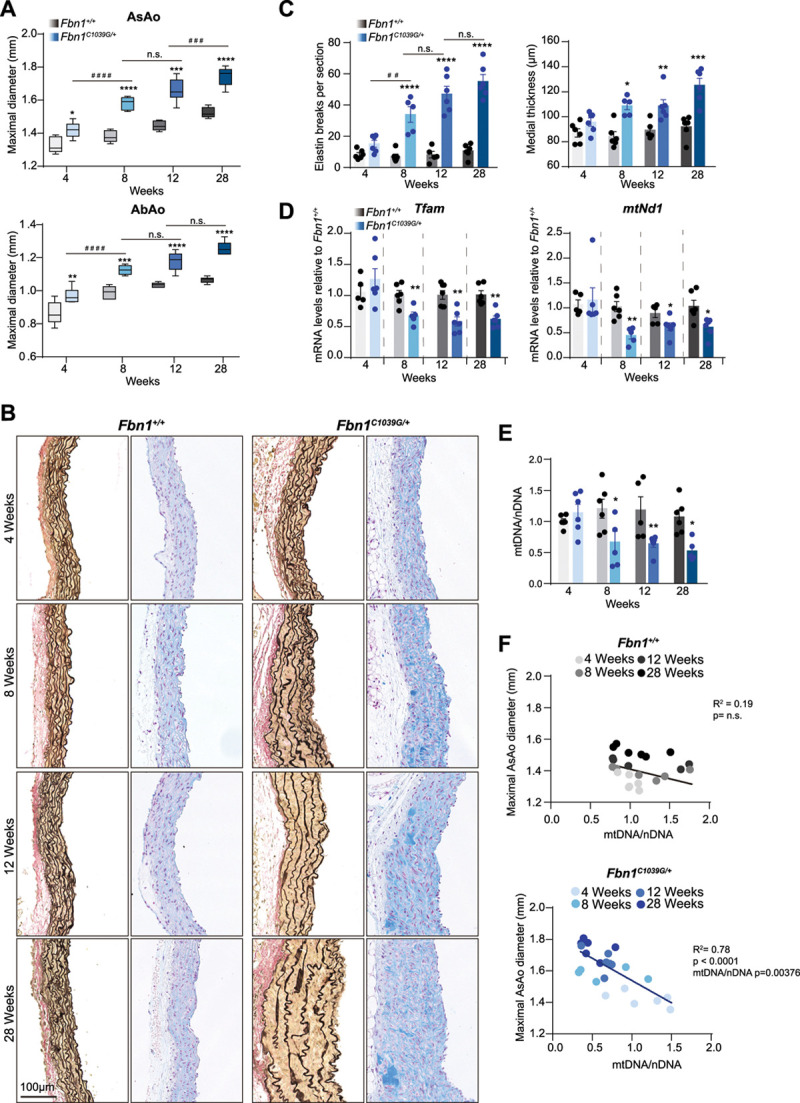
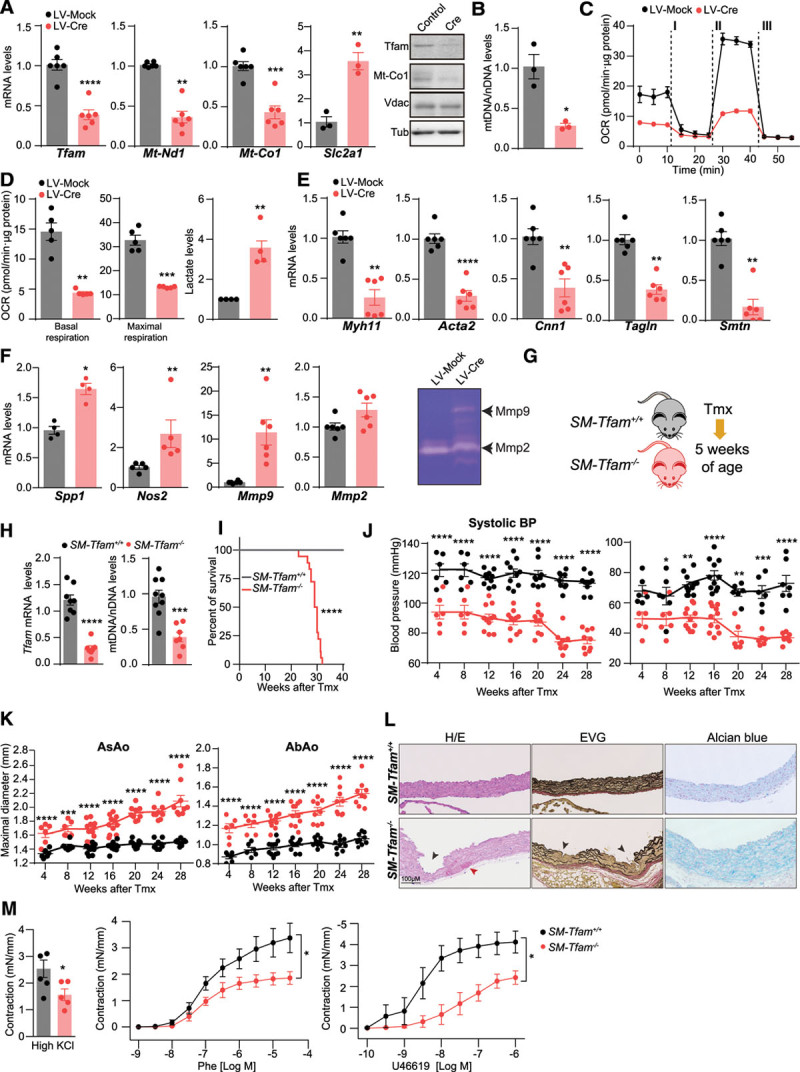
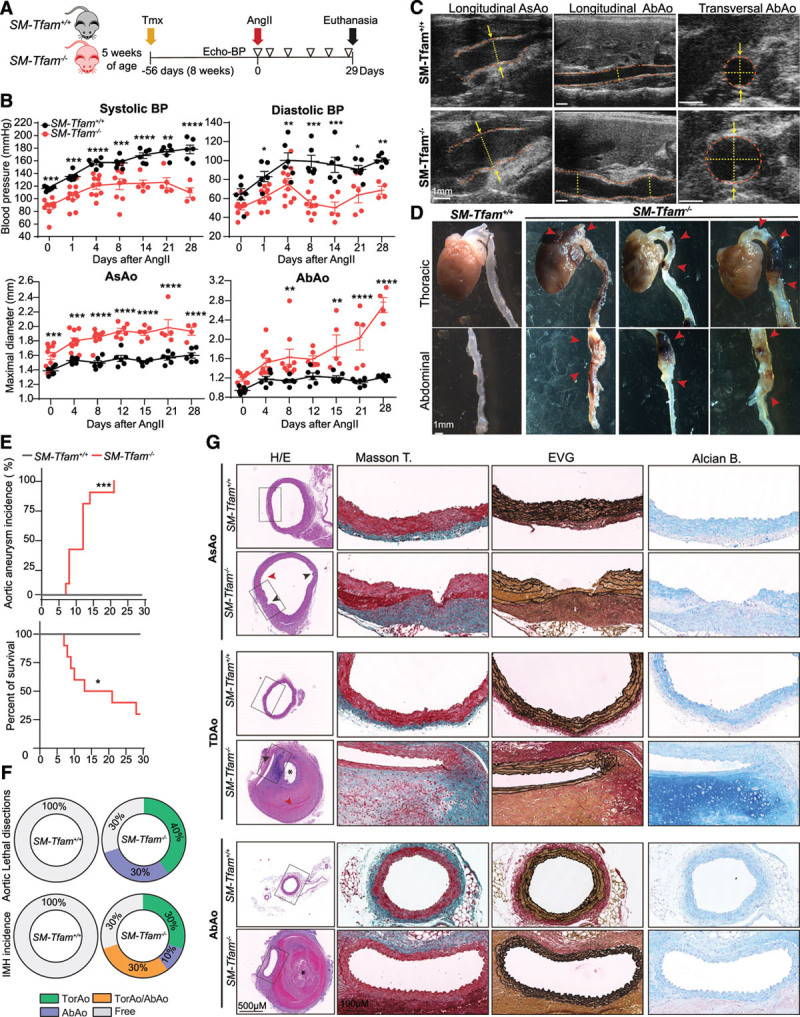
Methods: Combining transcriptomics and metabolic analysis of aortas from an MFS mouse model (Fbn1c1039g/+) and MFS patients, we have identified mitochondrial dysfunction alongside with mtDNA depletion as a new hallmark of aortic aneurysm disease in MFS. To demonstrate the importance of mitochondrial decline in the development of aneurysms, we generated a conditional mouse model with mitochondrial dysfunction specifically in vascular smooth muscle cells (VSMC) by conditional depleting Tfam (mitochondrial transcription factor A; Myh11-CreERT2Tfamflox/flox mice). We used a mouse model of MFS to test for drugs that can revert aortic disease by enhancing Tfam levels and mitochondrial respiration.

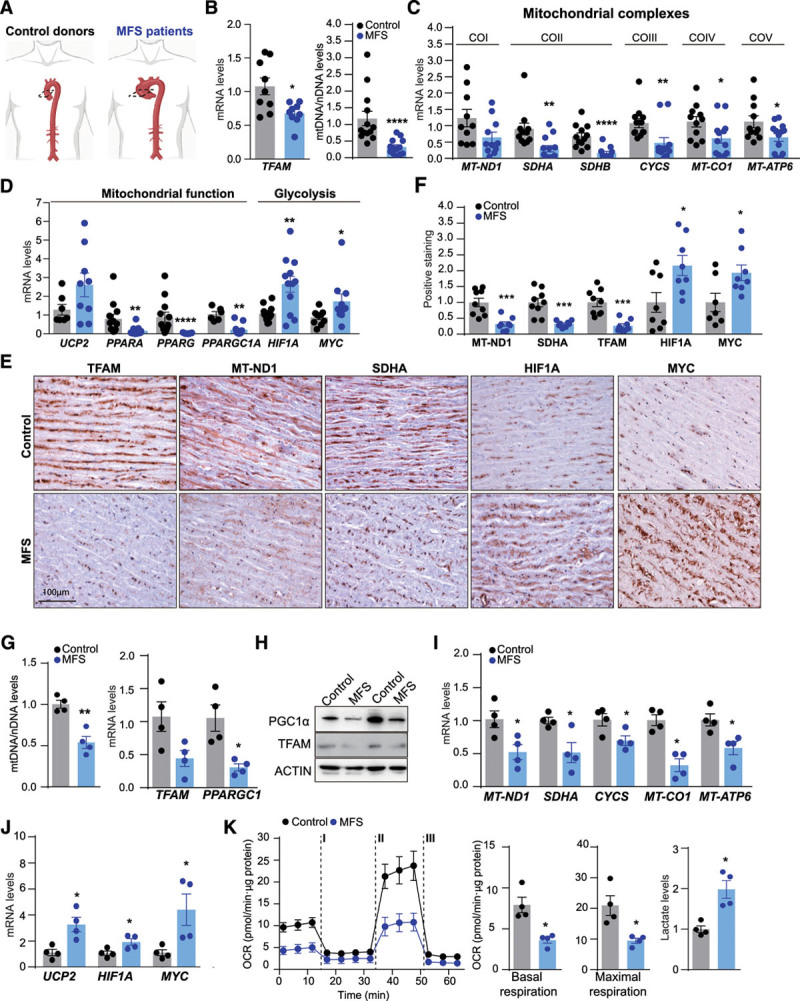
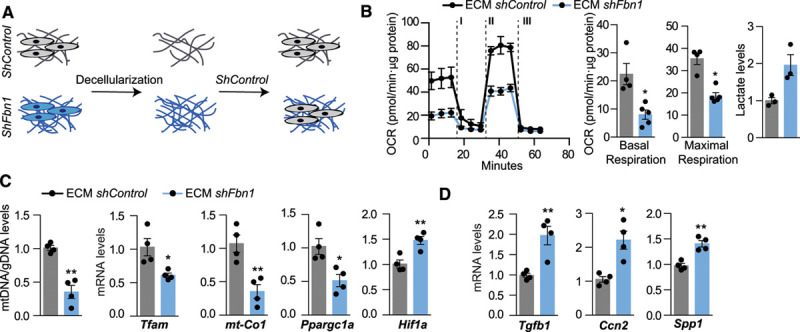
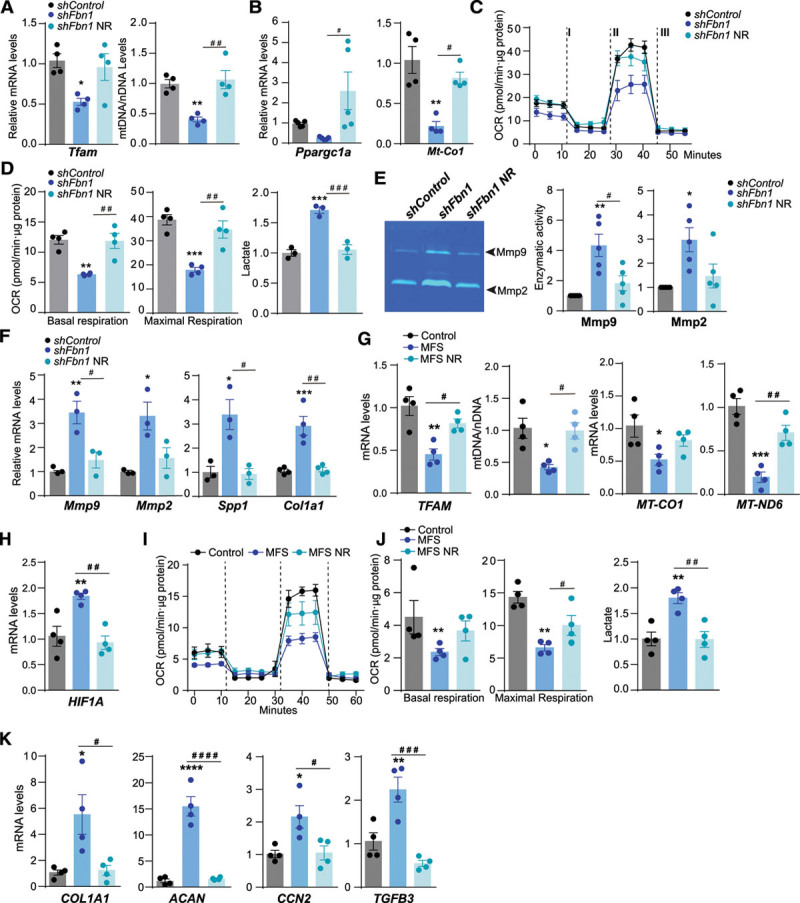
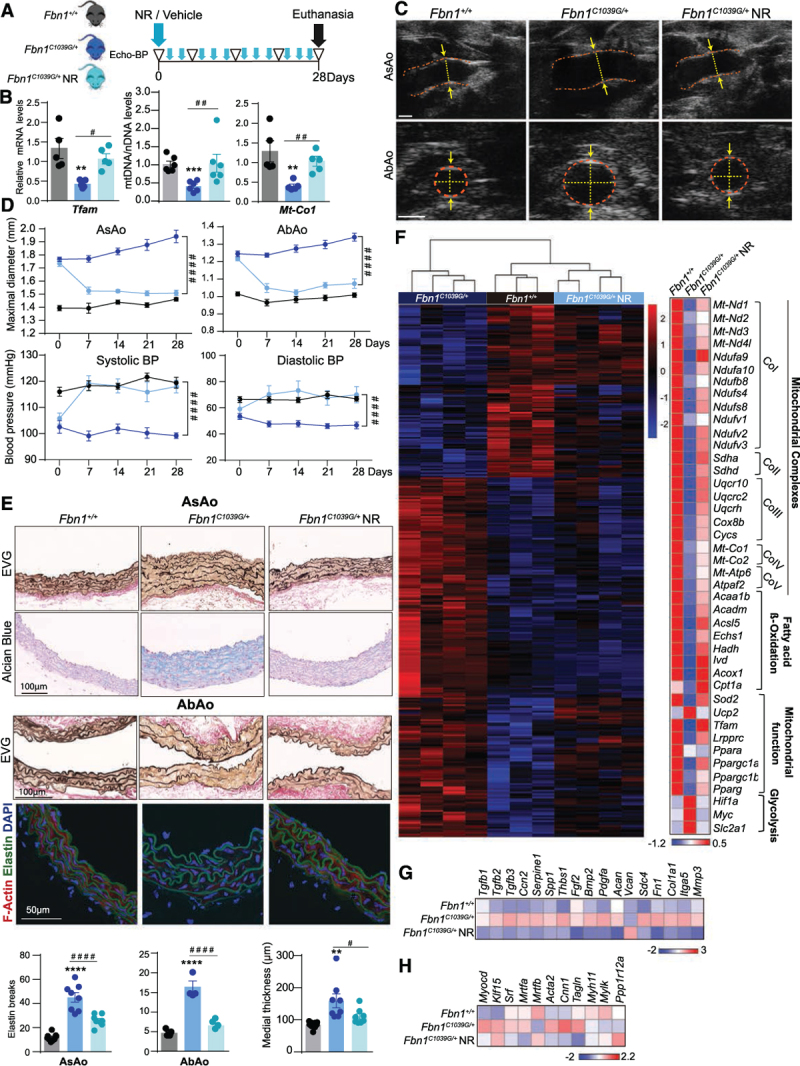
Results: The main canonical pathways highlighted in the transcriptomic analysis in aortas from Fbn1c1039g/+ mice were those related to metabolic function, such as mitochondrial dysfunction. Mitochondrial complexes, whose transcription depends on Tfam and mitochondrial DNA content, were reduced in aortas from young Fbn1c1039g/+ mice. In vitro experiments in Fbn1-silenced VSMCs presented increased lactate production and decreased oxygen consumption. Similar results were found in MFS patients. VSMCs seeded in matrices produced by Fbn1-deficient VSMCs undergo mitochondrial dysfunction. Conditional Tfam-deficient VSMC mice lose their contractile capacity, showed aortic aneurysms, and died prematurely. Restoring mitochondrial metabolism with the NAD precursor nicotinamide riboside rapidly reverses aortic aneurysm in Fbn1c1039g/+ mice.

Conclusions: Mitochondrial function of VSMCs is controlled by the extracellular matrix and drives the development of aortic aneurysm in Marfan syndrome. Targeting vascular metabolism is a new available therapeutic strategy for managing aortic aneurysms associated with genetic disorders.

Keywords: DNA, mitochondrial; Marfan syndrome; aortic aneurysm; extracellular matrix; genetic diseases, inborn; glycolysis; muscle, smooth, vascular.


Figures

Figure 1.
Figure 1.
Mitochondrial function decline in a mouse model of Marfan syndrome. A through D, RNA-sequencing analysis of aortas from 4 Fbn1C1039G/+ mice with 3 Fbn1+/+ littermates (24-week-old male mice). B, Top 10 significantly changed canonical pathways predicted by ingenuity pathway analysis based on differentially regulated genes. Metabolism-related pathways are highlighted in blue lettering; P<0.01. C, Activation or inhibition of upstream regulators predicted by ingenuity pathway analysis (–2>bias-corrected z-score>4; P<0.05). The predicted inhibition of Tfam is highlighted. D, Expression of genes encoding mitochondrial complexes (Co) and fatty acid oxidation enzymes, and genes related to mitochondrial function and glycolysis; P < 0.05. E, Quantitative reverse transcription polymerase chain reaction analysis of Tfam mRNA expression and quantitative polymerase chain reaction analysis of relative mtDNA content in aortic extracts from 20-week-old Fbn1C1039G/+ and Fbn1+/+ male mice. F through I, Primary murine vascular smooth muscle cells transduced with shFbn1 or shControl for 5 days. F, Quantitative reverse transcription polymerase chain reaction of Hif1a, Pdk1, and representative immunoblots analysis, and relative quantification of Hif1a and Pdk1 protein levels. G, Quantitative reverse transcription polymerase chain reaction of Tfam and Ppargc1a and representative immunoblot analysis and quantification of Pgc1α, Tfam, Mt-Nd1, and Mt-Co1. H, Quantitative polymerase chain reaction analysis of relative mtDNA content in shFbn1- and shControl-transduced vascular smooth muscle cells. I, OCR in shFbn1 and shControl vascular smooth muscle cells at basal respiration and after addition of the complex V inhibitor oligomycin (I) and fluoro carbonyl cyanide phenylhydrazone (II) to measure maximal respiration, followed by a combination of rotenone and antimycin A (III). J, Levels of extracellular lactate in the supernatant from shFbn1 and shControl vascular smooth muscle cells. Actin was used as total protein loading control. Data are mean±SEM Statistical significance was assessed by Student t test. *P<0.05, **P<0.01, ***P<0.001, ****P<0.0001 vs Fbn1+/+ mice (E), shControl (F through J). Acaa1b indicates 3-ketoacyl-CoA thiolase B, peroxisomal; Acsl5, Acyl-CoA Synthetase Long Chain Family Member 5; Akt, serine/threonine kinase 1; Atpaf2, ATP synthase mitochondrial F1 complex assembly factor 2; Ccn2, cellular communication network factor 2; CoI–V, mitochondrial complexes I-V; Cox8b, cytochrome c oxidase subunit 8B; Cycs, cytochrome c, somatic; Echs1, enoyl-CoA hydratase, short chain 1; Erk, extracellular signal regulated kinases; Fbn1, fibrillin-1; Hadh, hydroxyacyl-CoA dehydrogenase; Hif1a, hypoxia-inducible factor 1 α; Idh3g, isocitrate dehydrogenase (NAD(+)) 3 non-catalytic subunit gamma; Ivd, isovaleryl-CoA dehydrogenase; Mrtfa, b, myocardin related transcription factor A, B; Mt-Atp6, mitochondrially-encoded ATP synthase membrane subunit 6; Mt-Co1, 2, mitochondrially encoded cytochrome c oxidase I /II; Mt-Nd1–4I, mitochondrially encoded NADH dehydrogenase 1-4; Myc, Myc protoncogen, myelocytomatosis oncogene; Ndufa9, 10, NADH:ubiquinone oxidoreductase subunit A9-10; Ndufb8, NADH:ubiquinone oxidoreductase subunit B8; Ndufs4, 8, NADH:ubiquinone oxidoreductase core subunit S4,8; Ndufv1–3, NADH:ubiquinone oxidoreductase core subunit V1-3; Nos2, nitric oxide synthase 2; OCR, oxygen consumption rate; Mef2d, myocyte enhancer factor 2D; p38-MAPK, p38 mitogen-activated protein kinase; Pccb, propionyl-CoA carboxylase beta chain, mitochondrial; Pkm, Pyruvate kinase muscle isozyme; Pi3k, phosphatidylinositol 3-kinase; Pparg, Peroxisome proliferator-activated receptor gamma; Ppara, peroxisome proliferator-activated receptor α: Ppargc1a, b, peroxisome proliferator-activated receptor γ coactivators 1a and 1b, respectively; Rictor, RPTOR independent companion of MTOR, complex 2; Sdha, d, succinate dehydrogenase complex flavoprotein subunit A, D; shControl, Control Short hairpin RNA; shFbn1, Short hairpin RNA Fbn1; Sirt1, NAD-dependent deacetylase sirtuin-1; Slc2a1, Glut1, solute carrier family 2 member 1; Sod2, Superoxide dismutase 2, mitochondrial; Srf, serum response factor; Suclg1, succinate-CoA ligase GDP/ADP-forming subunit alpha; TCA, tricarboxylic acid cycle; Tfam, mitochondrial transcription factor A; Tgfb1, transforming growth factor β1; Tp53, tumor protein p53; Uqcr10, Ubiquinol-Cytochrome C Reductase, Complex III Subunit X; Ucp2, mitochondrial uncoupling protein 2; Uqcrc2, Ubiquinol-Cytochrome C Reductase Core Protein 2; and Uqcrh, Ubiquinol-Cytochrome C Reductase Hinge Protein.
Figure 2.
Figure 2.
Decrease of Tfam levels and mitochondrial DNA correlate with aortic deterioration of Fbn1C1039G/+ mice. Analysis of the progression of mitochondrial and aortic phenotype in Fbn1+/+ and Fbn1C1039G/+ male mice from 4, 8, 12, and 28 weeks old. A, Maximal AsAo and AbAo diameter. B, Representative images of Van Gienson and Alcian blue histologic staining. C, Quantification of elastin breaks per section and aortic medial thickness in ascending aortas at the indicated ages. D, Relative quantitative reverse transcription polymerase chain reaction analysis of Tfam and Mt-Co1 mRNA expression in aortic extracts from Fbn1+/+. E, Quantitative polymerase chain reaction analysis of relative mtDNA content in aortas from 4-week-old Fbn1+/+ mice and (F) multiple linear regression adjusted for age, between the AsAo diameter and mtDNA/nDNA levels; adjusted R2 and P value are indicated. Histograms show mean±SEM. Aortic diameter is presented in box and whisker plots showing maximal and minimal values and 75th and 25th percentiles. Statistical significance was assessed by 2-way ANOVA (A, C, E), Student t test (D), and multiple linear regression (F). *P<0.05, **P<0.01, ***P<0.001, ****P<0.0001 vs. Fbn1+/+ mice; ##P<0.01, ###P<0.001 vs. Fbn1C1039G/+ mice. AbAo indicates abdominal aorta; AsAo, ascending aorta; Fbn1, fibrillin-1; mtNd1, mitochondrially-encoded NADH ubiquinone oxidoreductase core subunit 1; n.s., not significant; and Tfam, mitochondrial transcription factor A.
Figure 3.
Figure 3.
Decrease of TFAM levels and mitochondrial respiration in samples from MFS patients. A, Analysis of human ascending aortic samples from MFS patients and control donors. B, Quantitative reverse transcription polymerase chain reaction analysis of TFAM mRNA and quantitative polymerase chain reaction analysis of relative mtDNA content. C, Expression of genes encoding mitochondrial complex components and (D) genes related to mitochondrial function and glycolysis. E, Representative medial layer sections of immunohistochemical analysis of MT-ND1 (CoI), SDHA (CoII), TFAM, HIF1A, and MYC levels and (F) quantification. G through K, Primary fibroblasts from 4 patients with MFS and 4 healthy controls. G, Quantitative polymerase chain reaction analysis of mtDNA content and quantitative reverse transcription polymerase chain reaction analysis of TFAM and PPARGC1A expression (H) and representative TFAM and PGC1α immunoblotting (n=4). I, mRNA of MT-ND1, SDHA, CYCS, MT-CO1, MT-ATP6, (J) UCP2, HIF1A, and MYC as assessed by quantitative reverse transcription polymerase chain reaction, in extracts from human MFS and Control fibroblast. K, OCR after addition of oligomycin (I), fluoro carbonyl cyanide phenylhydrazone (II), and a combination of rotenone and antimycin-A (III) and extracellular lactate levels. Data are mean±SEM. Statistical significance was assessed by Student t test *P<0.05, **P<0.01, ***P<0.001, ****P<0.0001 vs Control. ACTIN indicates beta actin; COI–V, mitochondrial complexes I-V; CYCS, Cytochrome C, Somatic; HIF1A, hypoxia-inducible factor 1 α; MFS, Marfan syndrome; MT-ATP6, mitochondrially-encoded ATP synthase membrane subunit 6; MT-CO1, mitochondrially-encoded cytochrome c oxidase I; MT-ND1, mitochondrially-encoded NADH ubiquinone oxidoreductase core subunit 1; MYC, MYC proto-oncogene, bHLH transcription factor; PPARA, Peroxisome proliferator-activated receptor alpha; PPARAGC, peroxisome proliferator-activated receptor γ coactivator; PPARAGC1a, Peroxisome proliferator-activated receptor gamma coactivator 1-alpha; PGC1α, Peroxisome proliferator-activated receptor gamma coactivator 1-alpha (protein); SDHA, B, succinate dehydrogenase complex flavoprotein subunit A-B; TFAM, mitochondrial transcription factor A; and UCP2, mitochondrial uncoupling protein 2.
Figure 4.
Figure 4.
ECM derived from thoracic aortic aneurysm cells decreases Tfam levels and mitochondrial respiration. A, Primary vascular smooth muscle cells transduced with shFbn1 or shControl were cultured for 5 days, lead to produce ECM, then the matrices were decellularized and shControl cells were seeded. B, OCR in shControl vascular smooth muscle cells seeded in shControl and ShFbn1-ECM at basal respiration and after addition of oligomycin (I) and fluoro carbonyl cyanide phenylhydrazone (II) to measure maximal respiration, followed by a combination of rotenone and antimycin A (III) and extracellular lactate levels. C, Quantitative reverse transcription polymerase chain reaction analysis of Tfam, Mt-co1, Ppargc1, and Hif1a, and quantitative polymerase chain reaction analysis of mtDNA content. D, Quantitative reverse transcription polymerase chain reaction analysis of synthetic genes Tgfb1, Ccn2, and Spp1. Statistical significance was assessed by Student t test. *P<0.05, **P<0.01 vs Control. Ccn2 indicates cellular communication network factor 2; ECM, extracellular matrix; Hif1a, hypoxia-inducible factor 1 α; mt-Co1, mitochondrially-encoded cytochrome c oxidase I; OCR, oxygen consumption rate; Ppargc1, peroxisome proliferator-activated receptor γ coactivator 1; shFbn1, Short hairpin RNA Fbn1; Spp1, secreted phosphoprotein 1; Tfam, mitochondrial transcription factor A; and Tgfb1, transforming growth factor β1;
Figure 5.
Figure 5.
Ablation of Tfam in vascular smooth muscle cells induces synthetic phenotype and aortic remodeling. A through F, Primary mouse Tfamflox/flox vascular smooth muscle cells were transduced with LV-Mock or LV-Cre lentivectors and analyzed after 10 days. A, Quantitative reverse transcription polymerase chain reaction analysis of relative Tfam, and RT Mt-Nd1, Mt-Co1, and Slc2a1 mRNA expression and representative immunoblot analysis of Tfam and Mt-Co1; Vdac and Tub were used as mitochondrial and total protein loading controls, respectively. B, Quantitative polymerase chain reaction analysis of relative mtDNA content. C, OCR at (D) basal respiration and after addition of oligomycin (I) and fluoro carbonyl cyanide phenylhydrazone (II) to measure maximal respiration, followed by a combination of rotenone and antimycin A (III); and normalized extracellular lactate levels. E, Quantitative reverse transcription polymerase chain reaction assessed relative mRNA expression of the smooth muscle contractile genes Myh11, Acta2, Cnn1, Tagln, and Smtn. F, Quantitative reverse transcription polymerase chain reaction assessed relative mRNA expression of the vascular smooth muscle cells synthetic phenotype genes Spp1, Nos2, Mmp9, and Mmp2. F, right, Representative gelatin zymograph from 24 h conditioned medium, indicating Mmp9 and Mmp2 enzymatic activity. G, Experimental design for H through L: SM-Tfam+/+ and SM-Tfam−/− mice were treated with tamoxifen at 5 weeks old. H, Quantitative reverse transcription polymerase chain reaction analysis of Tfam expression and quantitative polymerase chain reaction analysis of mtDNA content in aortic extracts from SM-Tfam+/+ and SM-Tfam−/− mice 28 weeks after tamoxifen injections. I, Percent survival after tamoxifen injections in SM-Tfam+/+ and SM-Tfam−/− mice; n=20. J, Evolution of systolic and diastolic blood pressure after tamoxifen injections in SM-Tfam+/+ and SM-Tfam−/− mice. K, Evolution of maximal ascending aorta and abdominal aorta diameters after tamoxifen treatment in SM-Tfam+/+ and SM-Tfam−/− mice. L, Representative images of histologic staining with H/E, EVG, and Alcian blue in ascending aortas from SM-Tfam+/+ and SM-Tfam−/− mice 28 weeks after tamoxifen injection. Black arrowheads indicate aortic dissections; red arrowheads indicate intramural hematomas; n=4. M, Aortic contractile responses to high KCl solution and concentration–response curves to Phe and U46619; n=5. Data are mean±SEM. Statistical significance was assessed by Student t test (A through H), log-rank (Mantel–Cox) test (I), mixed-effects linear model (J, K), or 2-way ANOVA repeated measures (M, right). *P<0.05, **P<0.01, ***P<0.001, ****P<0.0001 vs Lv-Mock (A through F) or vs SM-Tfam+/+ mice (H through M). AbAo indicates abdominal aorta; Acta2, actin α2, smooth muscle; AsAo, ascending aorta; Bp, blood pressure; Cnn1, calponin 1; Cre, Cre recombinase; EVG, elastin Van Gienson; H/E, hematoxylin-eosin; LV-Cre, Cre-expressing; LV-Mock, green fluorescent protein–expressing; Mmp2, 9, matrix metalloproteinase 2 and 9, respectively; Mt-Co1, mitochondrially-encoded cytochrome c oxidase I; Mt-Nd1, mitochondrially-encoded NADH ubiquinone oxidoreductase core subunit 1; Myh11, myosin heavy chain 11; Nos2, nitric oxide synthase 2; OCR, oxygen consumption rate; Phe, phenylephrine; Slc2a1, solute carrier family 2 member 1; SM-Tfam+/+, tamoxifen–treated Myh11-CreERT2TfamWt/Wt mice; SM-Tfam−/−, tamoxifen–treated Myh11-CreERT2Tfamflox/flox mice; Smtn, smoothelin; Spp1, secreted phosphoprotein 1; Tagln, transgelin; Tfam, mitochondrial transcription factor A; Tmx, tamoxifen; Tub, tubulin; U46619, U46619 synthetic analog of the prostaglandin PGH2; and Vdac, Voltage-dependent anion channel mitochondrial.
Figure 6.
Figure 6.
Infusion of Ang II in SM-Tfam−/− mice predisposes mice to lethal aortic aneurysm and dissections. A, Experimental design: 56 days (8 weeks) after tamoxifen injections, Ang II minipumps were implanted in 6 SM-Tfam+/+ and 10 SM-Tfam−/− male mice. Ultrasound and blood pressure (BP) analysis was performed 6 times (empty triangles). B, Evolution of systolic and diastolic BP (top) and maximal AsAo and AbAo diameters (bottom) on Ang II infusion. C, Representative aortic ultrasound images after 28 days of Ang II infusion in SM-Tfam+/+ and SM-Tfam−/− mice. Discontinuous red lines mark the lumen boundary and discontinuous yellow lines and arrows denote the lumen diameter. D, Representative macroscopic images of aortas from the same animal cohort shown in A. Red arrowheads indicate aneurysms, dissections, and intramural hematomas. E, Aortic aneurysm incidence and percent survival of Ang II−infused SM-Tfam+/+ and SM-Tfam−/− mice from the same cohort shown in A. F, Incidence and localization of lethal aortic dissections and IMH in the same cohort shown in A. G, Representative histologic analysis on sections of AsAo, TDAo, and AbAo from the same cohort shown in A. Statistical significance was assessed by mixed-effects linear model (B) and log-rank (Mantel–Cox) test (E). Data are mean±SEM. Red arrows indicate intramural hematomas. *False lumen; P<0.05, **P<0.01, ***P<0.001, ****P<0.0001 vs. SM-Tfam+/+ mice. AbAo indicates abdominal aorta; Alcian B, Alcian blue; AngII, angiotensin II; AsAo, ascending aorta; BP, blood pressure; EVG, elastin Van Gienson; H/E, hematoxylin eosin; IMH, intramural hematomas; Masson T, Masson’s trichrome; MFS, Marfan syndrome; NR, nicotinamide riboside; SM-Tfam+/+, tamoxifen–treated Myh11-CreERT2TfamWt/Wt mice; SM-Tfam−/−, tamoxifen–treated Myh11-CreERT2Tfamflox/flox mice; TDAo, thoracic descending aorta; Tfam, mitochondrial transcription factor A; Tmx, tamoxifen; TorAo, Thoracic aorta; and TorAo/AbAo, Thoracic/Abdominal aorta.
Figure 7.
Figure 7.
NR increases Tfam levels and mitochondrial respiration in murine and human MFS cells. A through F, Primary vascular smooth muscle cells transduced with shFbn1 or shControl were treated with NR for 5 days. A, Quantitative reverse transcription polymerase chain reaction (RT-qPCR) analysis of Tfam and quantitative polymerase chain reaction analysis of mtDNA content. B, RT-qPCR analysis of Ppargc1a and Mt-Co1 mRNA expression. C through D, OCR in shFbn1 and shControl vascular smooth muscle cells after incubation with or without NR at basal respiration, and after addition of oligomycin (I) and fluoro carbonyl cyanide phenylhydrazone (II) to measure maximal respiration, followed by a combination of rotenone and antimycin A (III) and extracellular lactate levels. E, Representative gelatin zymogram images (left) and enzymatic activity analysis of Mmp2 and Mmp9 in 24h conditional medium (right). F, RT-qPCR analysis of Mmp9, Mmp2, Spp1, and Col1a1 mRNA expression. G through K, Effect of NR on primary dermal fibroblasts from 4 MFS patients and 4 healthy donors (Control); cells were treated with NR for 5 days. G, RT-qPCR analysis of TFAM mRNA expression, quantitative polymerase chain reaction analysis of mtDNA content, and RT-qPCR analysis of MT-CO1, MT-ND6, TFAM, and (H) HIF1A mRNA expression. I, OCR after addition of oligomycin (I), fluoro carbonyl cyanide phenylhydrazone (II), and a combination of rotenone and antimycin A (III). J, Basal and maximal respiration rate and extracellular lactate levels. K, RT-qPCR analysis of COL1A1, ACAN, CCN2, and TGFB3 mRNA expression. Data are mean±SEM. Statistical significance was assessed by 1-way ANOVA: *P<0.05, **P<0.01, ***P<0.001, ****P<0.0001 vs ShControl or Control; # P<0.05, ## P<0.01, ###P<0.001, ####P<0.0001 vs ShFbn1 or MFS NR. ACAN indicates aggrecan; CCN2, cellular communication network factor 2; COL1A1, collagen type I α1 chain; HIF1A, hypoxia-inducible factor 1 α; MFS, Marfan syndrome; Mmp2, 9, matrix metalloproteinases 2 and 9, respectively; MT-CO1, mitochondrially-encoded cytochrome c oxidase I; MT-ND6, mitochondrially-encoded NADH-ubiquinone oxidoreductase chain 6; NR, nicotinamide riboside; OCR, oxygen consumption rate; Ppargc1a, peroxisome proliferator-activated receptor γ coactivator 1a; Spp1, secreted phosphoprotein 1; TFAM, mitochondrial transcription factor A; and TGFB3, transforming growth factor β3.
Figure 8.
Figure 8.
Nicotinamide riboside treatment restores aortic homeostasis in a mouse model of Marfan syndrome. A, Experimental design: 20-week-old Fbn1+/+ and Fbn1C1039G/+ male mice were treated with NR or vehicle for 28 days (blue arrowheads). Ultrasound and BP analysis was performed 5 times (empty triangles); n=9. B, Quantitative reverse transcription polymerase chain reaction analysis of Tfam, quantitative polymerase chain reaction analysis of relative mtDNA content, and mt-Co1 mRNA. C, Representative aortic ultrasound images after 28 days of vehicle or NR treatment. Discontinuous red lines mark the lumen boundary, and discontinuous yellow lines and arrows denote the lumen diameter. D, Evolution of maximal AsAo and AbAo diameter (top) and systolic and diastolic BP (bottom) on NR treatment; n=9. E, Representative histologic staining with EVG and Alcian blue in the AsAo (top) and with EVG in the AbAo (middle) and confocal imaging of F-actin (red), elastin (green, autofluorescence), and 4′,6-diamidino-2-phenylindole–stained nuclei (blue) in the descending thoracic aorta (bottom); and quantification of elastin breaks and aortic medial thickness. F through H, RNA-sequencing analysis of aortic medial tissue from Fbn1+/+ mice (n=3) and from Fbn1C1039G/+ mice treated for 28 days with vehicle (n=4) or NR (n=4). F, Hierarchical clustering showing the top 200 most significant differentially expressed genes (by adjusted P < 0.05) between the 3 groups of mice (left) and gene expression heatmap for mitochondrial complex, fatty acid β-oxidation, mitochondrial function, and proglycolytic genes (right). G, Expression heatmap for genes encoding extracellular matrix–related proteins and (H) smooth muscle contractile apparatus. The heatmap was obtained from DESeq2 analysis. Statistical significance was assessed by 1-way ANOVA (B, E) or 2-way repeated measurements ANOVA (D). **P<0.01, ***P<0.001, ****P<0.0001 for Fbn1C1039G/+ vs Fbn1+/+; #P<0.05, ##P<0.01, ####P<0.0001 for Fbn1C1039G/+NR vs Fbn1C1039G/+. AbAo indicates abdominal aorta; Acaa1b, acetyl-Coenzyme A acyltransferase 1B; Acadm, acyl-CoA dehydrogenase medium chain; ACAN, aggrecan; Acsl5, Acyl-CoA Synthetase Long Chain Family Member 5; Acox1, acyl-Coenzyme A oxidase 1, palmitoyl; Acta2, actin, alpha 2, smooth muscle; AsAo, ascending aorta; Bmp 2, bone morphogenetic protein 2; BP, blood pressure; Ccn2, cellular communication network factor 2; Col1a1, collagen type I α1 chain; Cox8b, cytochrome c oxidase subunit 8B; Cnn1, calponin 1; Cpt1a, carnitine palmitoyltransferase 1A; Cycs, cytochrome c, somatic; DAPI, 4′,6-diamidino-2-phenylindole; Echs1, enoyl-CoA hydratase, short chain 1; EVG, elastin Van Gienson; F-Actin, filamentous actin; Fbn1, fibrillin-1; Fgf2, fibroblast growth factor 2; Fn1, Fibronectin1; Hadh, hydroxyacyl-CoA dehydrogenase; Hif1a, hypoxia-inducible factor 1 α; Itga5, integrin subunit alpha 5; Ivd, isovaleryl-CoA dehydrogenase; Klf15, Kruppel-like factor 15; Lrpprc, leucine rich pentatricopeptide repeat containing; Mmp3, matrix metalloproteinase 3; Mrtfa, b, myocardin related transcription factor A,B; Mt-Atp6, mitochondrially-encoded ATP synthase membrane subunit 6; Mt-Co1, 2, mitochondrially encoded cytochrome c oxidase I,II; Mt-Nd1–4l, mitochondrially-encoded NADH-ubiquinone oxidoreductase chains 1–4l, respectively; Myc, MYC proto-oncogene, bHLH transcription factor; Myh11, myosin heavy chain 11; Mylk, myosin light chain kinase; Myocd, myocardin; Ndufa9, 10, NADH:ubiquinone oxidoreductase subunit A9, 10; Ndufb8, NADH:ubiquinone oxidoreductase subunit B8; Ndufs4, 8, NADH:ubiquinone oxidoreductase core subunit S4; Ndufv1–3, NADH:ubiquinone oxidoreductase core subunit V1, V3; NR, nicotinamide riboside; Pdgfa, platelet derived growth factor subunit A; Pparg, Peroxisome proliferator-activated receptor gamma; Ppara, peroxisome proliferator-activated receptor α; Ppargc1a, b, peroxisome proliferator activated receptor γ coactivators 1a and b, respectively; Ppp1r12a, protein phosphatase 1 regulatory subunit 12A; Sdc4, Syndecan4; Sdha, d, succinate dehydrogenase complexes A and D, respectively; Serpine1, serpin family E member 1; Slc2a1, solute carrier family 2 member 1; Spp1, secreted phosphoprotein 1; Sod2, superoxide dismutase 2, mitochondrial; Srf, serum response factor; Tagln, transgelin; Tfam, mitochondrial transcription factor A; Tgfb1–3, transforming growth factors β1–3, respectively; Thbs1, thrombospondin 1; Uqcr10, ubiquinol-cytochrome c reductase, complex III subunit X; Uqcrc2, ubiquinol-cytochrome c reductase core protein 2; Uqcrh, ubiquinol-cytochrome c reductase hinge protein; and Vcan, Versican.

References

    1. Gillis E, Van Laer L, Loeys BL. Genetics of thoracic aortic aneurysm: at the crossroad of transforming growth factor-β signaling and vascular smooth muscle cell contractility. Circ Res. 2013;113:327–340. doi: 10.1161/CIRCRESAHA.113.300675 - PubMed
    1. Pinard A, Jones GT, Milewicz DM. Genetics of thoracic and abdominal aortic Diseases. Circ Res. 2019;124:588–606. doi: 10.1161/CIRCRESAHA.118.312436 - PMC - PubMed
    1. Dietz HC, Cutting GR, Pyeritz RE, Maslen CL, Sakai LY, Corson GM, Puffenberger EG, Hamosh A, Nanthakumar EJ, Curristin SM. Marfan syndrome caused by a recurrent de novo missense mutation in the fibrillin gene. Nature. 1991;352:337–339. doi: 10.1038/352337a0 - PubMed
    1. Keane MG, Pyeritz RE. Medical management of Marfan syndrome. Circulation. 2008;117:2802–2813. doi: 10.1161/CIRCULATIONAHA.107.693523 - PubMed
    1. De Paepe A, Devereux RB, Dietz HC, Hennekam RC, Pyeritz RE. Revised diagnostic criteria for the Marfan syndrome. Am J Med. Genet. 1996;62:417–426. doi: 10.1002/(SICI)1096-8628(19960424)62:4<417::AID-AJMG15>3.0.CO;2-R - PubMed

Publication types