

Continuous Prediction of Mortality in the PICU: A Recurrent Neural Network Model in a Single-Center Dataset
- PMID: 33710076
- PMCID: PMC8162230
- DOI: 10.1097/PCC.0000000000002682
Continuous Prediction of Mortality in the PICU: A Recurrent Neural Network Model in a Single-Center Dataset
Abstract
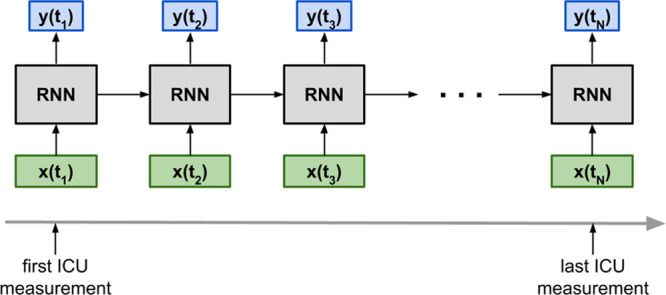
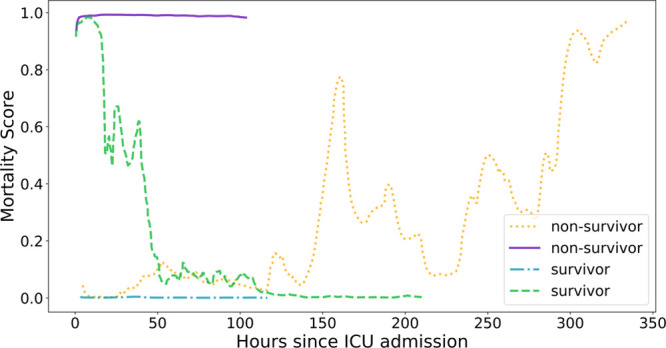
Objectives: Develop, as a proof of concept, a recurrent neural network model using electronic medical records data capable of continuously assessing an individual child's risk of mortality throughout their ICU stay as a proxy measure of severity of illness.
Design: Retrospective cohort study.
Setting: PICU in a tertiary care academic children's hospital.
Patients/subjects: Twelve thousand five hundred sixteen episodes (9,070 children) admitted to the PICU between January 2010 and February 2019, partitioned into training (50%), validation (25%), and test (25%) sets.
Interventions: None.
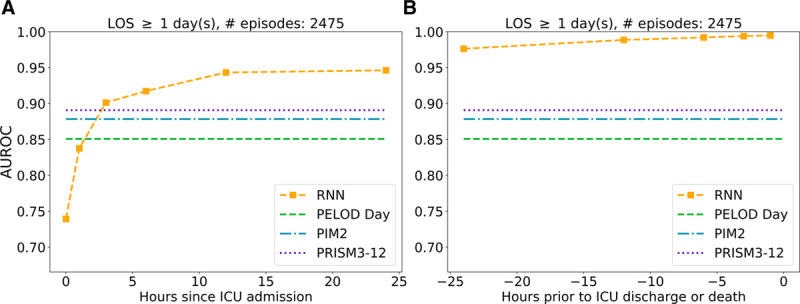
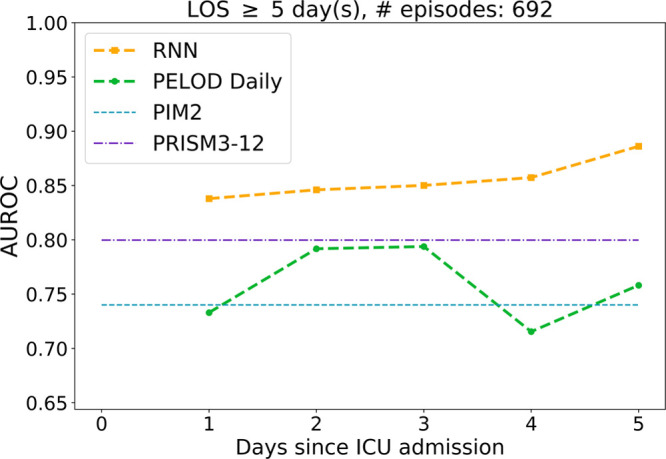
Measurements and main results: On 2,475 test set episodes lasting greater than or equal to 24 hours in the PICU, the area under the receiver operating characteristic curve of the recurrent neural network's 12th hour predictions was 0.94 (CI, 0.93-0.95), higher than those of Pediatric Index of Mortality 2 (0.88; CI, [0.85-0.91]; p < 0.02), Pediatric Risk of Mortality III (12th hr) (0.89; CI, [0.86-0.92]; p < 0.05), and Pediatric Logistic Organ Dysfunction day 1 (0.85; [0.81-0.89]; p < 0.002). The recurrent neural network's discrimination increased with more acquired data and smaller lead time, achieving a 0.99 area under the receiver operating characteristic curve 24 hours prior to discharge. Despite not having diagnostic information, the recurrent neural network performed well across different primary diagnostic categories, generally achieving higher area under the receiver operating characteristic curve for these groups than the other three scores. On 692 test set episodes lasting greater than or equal to 5 days in the PICU, the recurrent neural network area under the receiver operating characteristic curves significantly outperformed their daily Pediatric Logistic Organ Dysfunction counterparts (p < 0.005).
Conclusions: The recurrent neural network model can process hundreds of input variables contained in a patient's electronic medical record and integrate them dynamically as measurements become available. Its high discrimination suggests the recurrent neural network's potential to provide an accurate, continuous, and real-time assessment of a child in the ICU.
Copyright © 2021 The Author(s). Published by Wolters Kluwer Health, Inc. on behalf of the Society of Critical Care Medicine and the World Federation of Pediatric Intensive and Critical Care Societies.
Conflict of interest statement
Dr. Wetzel’s institution received funding from The Whittier Family Foundation. The remaining authors have disclosed that they do not have any potential conflicts of interest.
Figures
Comment in
-
Neural Networks for Mortality Prediction: Ready for Prime Time?Pediatr Crit Care Med. 2021 Jun 1;22(6):578-581. doi: 10.1097/PCC.0000000000002710. Pediatr Crit Care Med. 2021. PMID: 34078844 Free PMC article. No abstract available.
References
-
- Pollack MM, Patel KM, Ruttimann UE: PRISM III: An updated pediatric risk of mortality score. Crit Care Med 1996; 24:743–752 - PubMed
-
- Slater A, Shann F, Pearson G; Paediatric Index of Mortality (PIM) Study Group: PIM2: A revised version of the paediatric index of mortality. Intensive Care Med 2003; 29:278–285 - PubMed
-
- Jeffries HE, Soto-Campos G, Katch A, et al. : Pediatric index of cardiac surgical intensive care mortality risk score for pediatric cardiac critical care. Pediatr Crit Care Med 2015; 16:846–852 - PubMed
Publication types
MeSH terms
LinkOut - more resources
Full Text Sources
Other Literature Sources
