. 2021 Jun 28;17(24):5878-5887.
doi: 10.1039/d1sm00100k. Epub 2021 Mar 12.

Topological defects of integer charge in cell monolayers

Affiliations

Topological defects of integer charge in cell monolayers

Kirsten D Endresen et al. Soft Matter. .

Abstract

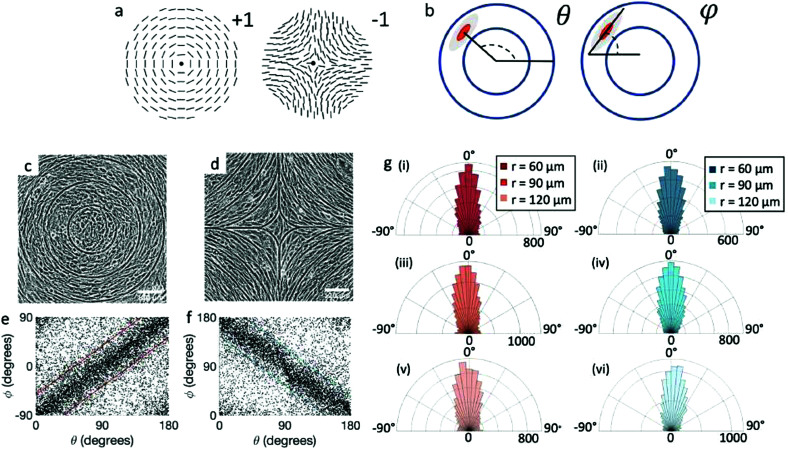
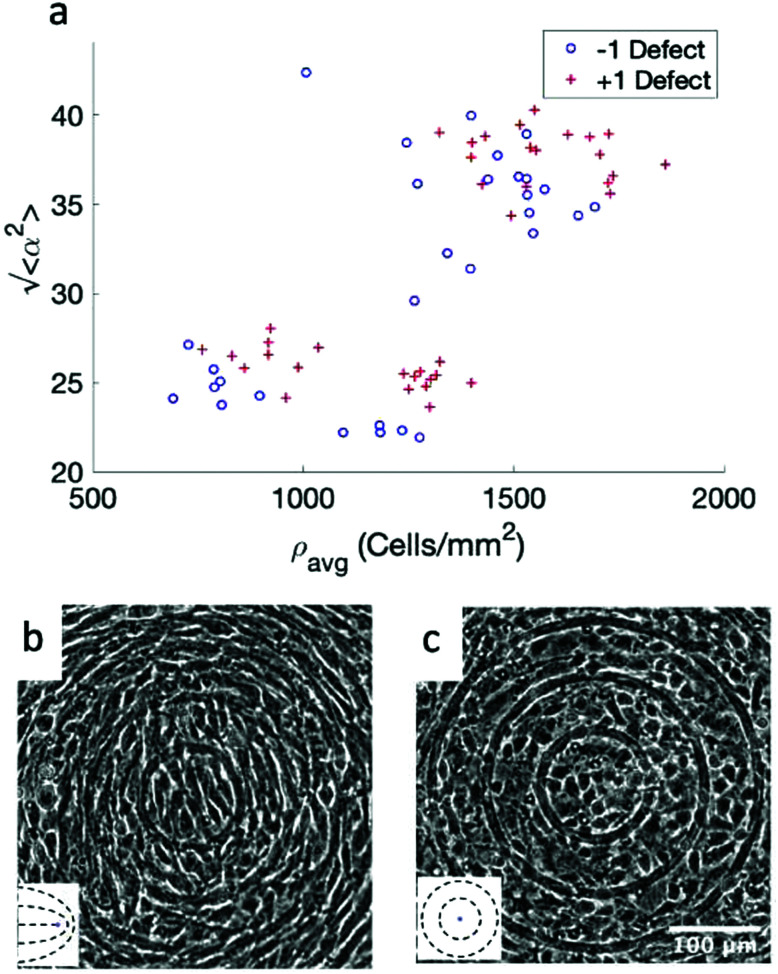
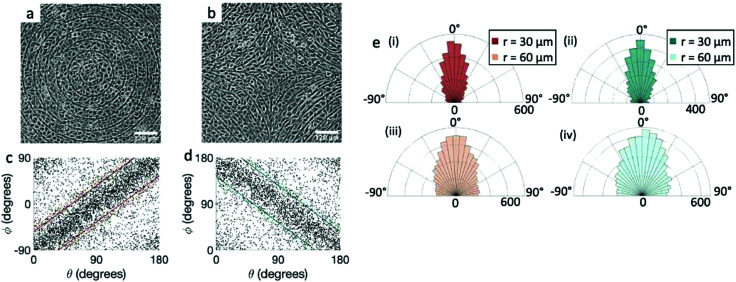
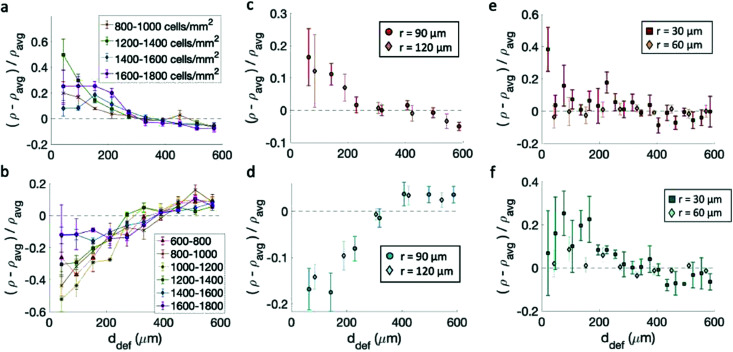
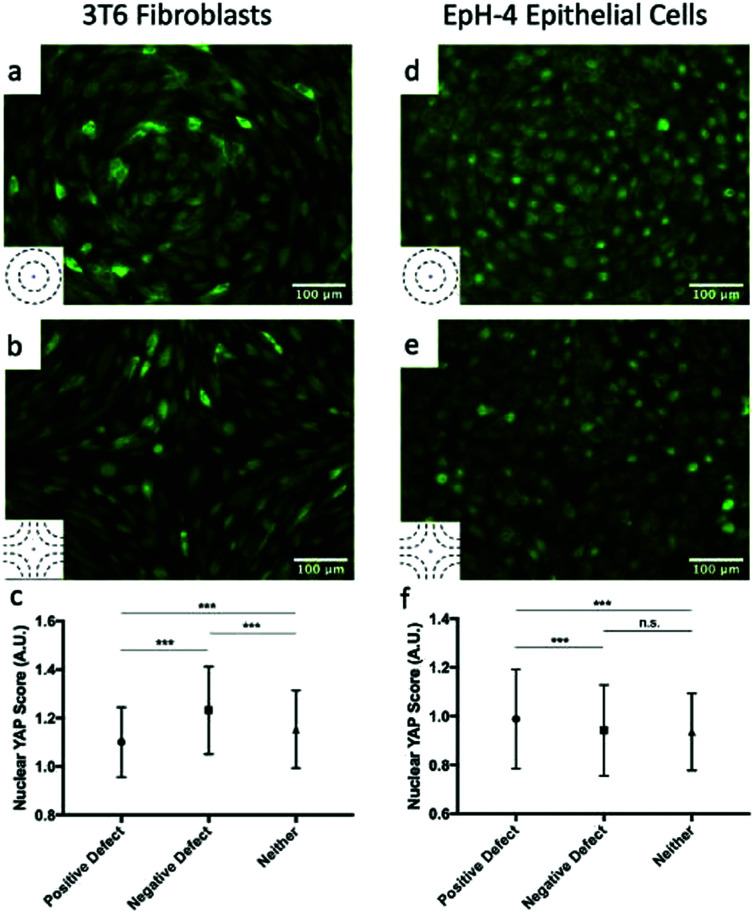
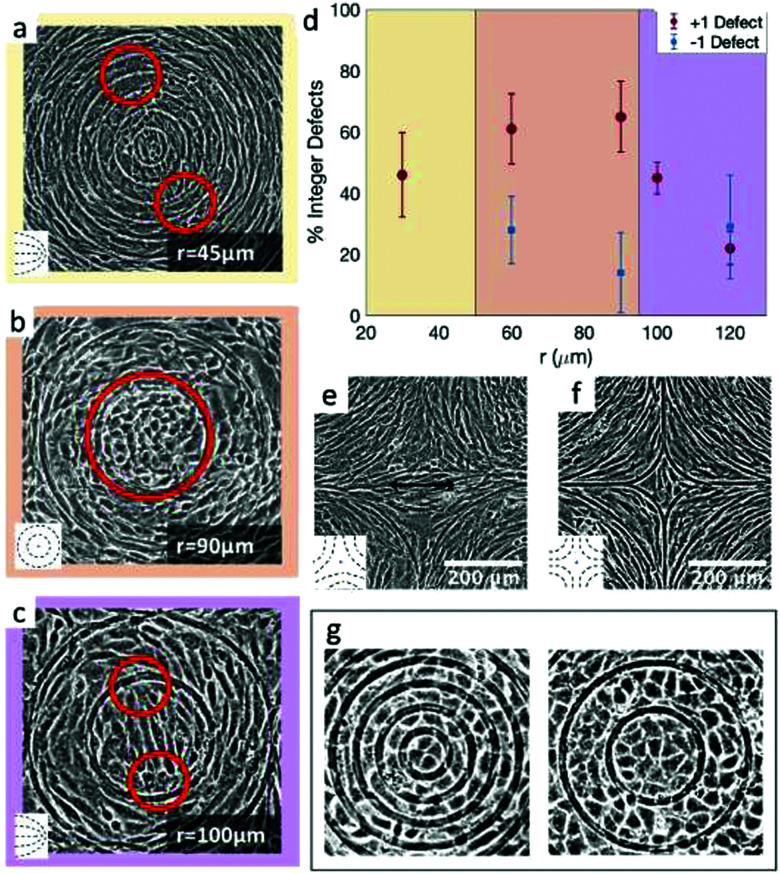
Many cell types spontaneously order like nematic liquid crystals, and, as such, they form topological defects, which influence the cell organization. While defects with topological charge ±1/2 are common in cell monolayers, defects with charge ±1, which are thought to be relevant in the formation of protrusions in living systems, are more elusive. We use topographical patterns to impose topological charge of ±1 in controlled locations in cell monolayers. We study two types of cells, 3T6 fibroblasts and EpH-4 epithelial cells, and we compare their behavior on such patterns, characterizing the degree of alignment, the cell density near the defects, and their behavior at the defect core. We observe density variation in the 3T6 monolayers near both types of defects over the same length-scale. By choosing appropriate geometrical parameters of our topographical features, we identify a new behavior of 3T6 cells near the defects with topological charge +1, leading to a change in the cells' preferred shape. Our strategy allows a fine control of cell alignment near defects as a platform to study liquid crystalline properties of cells.


Conflict of interest statement

There are no conflicts to declare.

Figures

Fig. 1
Fig. 1. Topological defects in fibroblasts. (a) Schematic of a +1 azimuthal and a −1 topological defect. (b) Schematic of θ, corresponding to the angle from the center of the defect, and ϕ, the angle of the major axis of the nucleus. (c) Phase contrast (PC) image of 3T6 cells in the vicinity of a positive defect on r = 120 μm pattern. Scale Bar is 120 μm. (d) PC of 3T6 in the vicinity of a negative defect on r = 120 μm pattern. Scale bar is 120 μm. The ridges are 1.5 μm tall. (e) Scatter plot of 3T6 alignment with r = 90 μm positive defect pattern. Red lines indicate root-mean-square (rms) deviation from the expected angle. The shades of red correspond to the colors specified in (g), indicating the for all the patterns with different ridge spacing. In this case, they overlap. (f) Scatter plot of 3T6 alignment with r = 90 μm negative defect pattern. Blue lines indicate rms deviation in angle for all three patterns, corresponding to the shades in (g). Alignment of 3T6 with ridges for (i and ii) r = 60 μm, (iii and iv) r = 90 μm, and (v and vi) r = 120 μm patterns around (i, iii and v) positive defects and (ii, iv and vi) negative defects. Radial axis represents number of cells, and angle represents the deviation of cell alignment from the expected value. (i) has n = 5 samples, and . (ii) has n = 5, and . (iii) has n = 7, and . (iv) has n = 5, and . (v) has n = 5, and . (vi) has n = 5, and .
Fig. 2
Fig. 2. Density dependence of 3T6 alignment on r = 60 μm patterns with 1.5 μm tall ridges. (a) Angle , measuring the deviation from the ideal alignment, as a function of the average density of cell monolayers. Every point corresponds to the observation of cells near one defect, either positive (red crosses) or negative (blue circles). (b) Details of fibroblasts near a positive defect in a monolayer with density 1400 cells per mm2, showing good alignment. (c) Detail of fibroblasts near a positive defect with density 1700 cells per mm2, showing a smaller aspect ratio and worse alignment. For n = 30 negative defects and n = 39 positive defects, we observe a difference in the quality of alignment between cells with a density typically >1400 cells per mm2 and with a density <1400 cells per mm2, with p-value < 0.0001.
Fig. 3
Fig. 3. Alignment of EpH-4 cells near topological defects. (a) PC of EpH-4 cells in the vicinity of a positive defect on r = 60 μm pattern. Scale bar is 120 μm. (b) PC of EpH-4 cells in the vicinity of a negative defect on r = 60 μm pattern. (c) Scatter plot of EpH-4 alignment with r = 30 μm positive defect pattern. Lines of different shades indicate for r = 30 μm and r = 60 μm. (d) Scatter plot of EpH-4 alignment with r = 30 μm negative defect pattern. Lines of different shades indicate for r = 30 μm and r = 60 μm. (e) Alignment of EpH-4 with ridges of (i and ii) r = 30 μm and (iii and iv) r = 60 μm patterns around (i and iii) positive defects and (ii and iv) negative defects. (i) n = 4 samples and . (ii) has n = 3 and . (iii) has n = 5 and . (iv) has n = 5 and .
Fig. 4
Fig. 4. Density of cells near defects with positive and negative topological charge. (a and b) Density of fibroblasts near +1 (a) and −1 (b) defects for monolayers at different cell density on 60 μm-spaced, 1.5 μm-tall ridges. The legend indicates the density range in cells per mm2. Note that for (a) the cell density was calculated from the fluorescence intensity and not by nuclear counting, as discussed in the Methods section. (c and d) Density of fibroblasts as a function of distance from the defects +1 (c) and −1 (d) defects. The data refer to patterns with different sizes. (e and f) Density of epithelial cells near +1 (e) and −1 (f) defects. All densities are normalized by the average density of each pattern. Statistical analysis of this figure are reported in Methods. Briefly, an increase in cell density is observed within 200 μm of a +1 defect with a p-value <0.05 for cells at all densities in (a), the 90 μm pattern in (c), and the 30 μm pattern in (e). A decrease in cell density is observed within 200 μm of a −1 defect with p-values < 0.05 for cells at densities < 1600 cells per mm2 in (b), both patterns in (d), and the 30 μm pattern in (f).
Fig. 5
Fig. 5. YAP localization in cells. (a and b) Fluorescence images showing YAP localization in 3T6 cells on r = 120 μm patterns indicates the presence of compressive stresses. In +1 defects, YAP is mostly localized in cytoplasm (a), while in −1 defects it is localized in nuclei (b). The ratio of nuclear to cytoplasmic YAP is shown in panel (c) for 3T6 cells near +1 defects, near −1 defects and far from defects. (d and e) Fluorescence images showing YAP localization in EpH-4 cells on r = 60 μm patterns near +1 defects, where it is localized in nuclei (d), and −1 defects, where it is more evenly distributed (e). The ratio of nuclear to cytoplasmic YAP is shown in panel (f) for EpH-4 cells near +1 defects, near −1 defects, and far from defects. Insets indicate the type of defect in the corresponding images. For each defect, at least n = 4 samples were included in analysis; error bars represent standard deviation; *** indicates p-value < 0.0001, n.s. is for “not significant”.
Fig. 6
Fig. 6. Examples of cell alignment near the positive and negative defects. (a) 3T6 fibroblasts with defect splitting into two +1/2 defects far from the inner ring, (b) isotropic region in the inner ring, indicating a +1 defect, and (c) defect splitting into two +1/2 defects in the inner ring. (d) Fraction of observed integer defects (as opposed to two half-integer defects), both for positive and for negative defects. Comparing r = 60 μm patterns (n = 18 samples) to r = 120 μm patterns (n = 60 samples), the prevalence of +1 defects was higher for the 60 μm pattern (p-value = 0.0015). (e and f) Cells near −1 defects with an elongated (e) or more isotropic (f) conformation. Insets display the type of defects observed in the cell alignment. (g) Rosette structure near +1 defects in EpH-4 epithelial cells in patterns by 30 and 60 μm.

Similar articles

Cited by

References

    1. Bouligand Y. C. R. Chim. 2008;11:281–296. doi: 10.1016/j.crci.2007.10.001. - DOI
    1. Saw T. B. Xi W. Ladoux B. Lim C. T. Adv. Mater. 2018;30:1802579. doi: 10.1002/adma.201802579. - DOI - PubMed
    1. Volfson D. Cookson S. Hasty J. Tsimring L. S. Proc. Natl. Acad. Sci. U. S. A. 2008;105:15346–15351. doi: 10.1073/pnas.0706805105. - DOI - PMC - PubMed
    1. Li X. Balagam R. He T.-F. Lee P. P. Igoshin O. A. Levine H. Proc. Natl. Acad. Sci. U. S. A. 2017;114:8974–8979. doi: 10.1073/pnas.1707210114. - DOI - PMC - PubMed
    1. Martella D. Pattelli L. Matassini C. Ridi F. Bonini M. Paoli P. Baglioni P. Wiersma D. S. Parmeggiani C. Adv. Healthcare Mater. 2019;8:1801489. doi: 10.1002/adhm.201801489. - DOI - PubMed

LinkOut - more resources