. 2021 Mar 12;17(3):e1009439.
doi: 10.1371/journal.ppat.1009439. eCollection 2021 Mar.

A novel cell culture system modeling the SARS-CoV-2 life cycle

Affiliations

A novel cell culture system modeling the SARS-CoV-2 life cycle

Xiaohui Ju et al. PLoS Pathog. .

Abstract

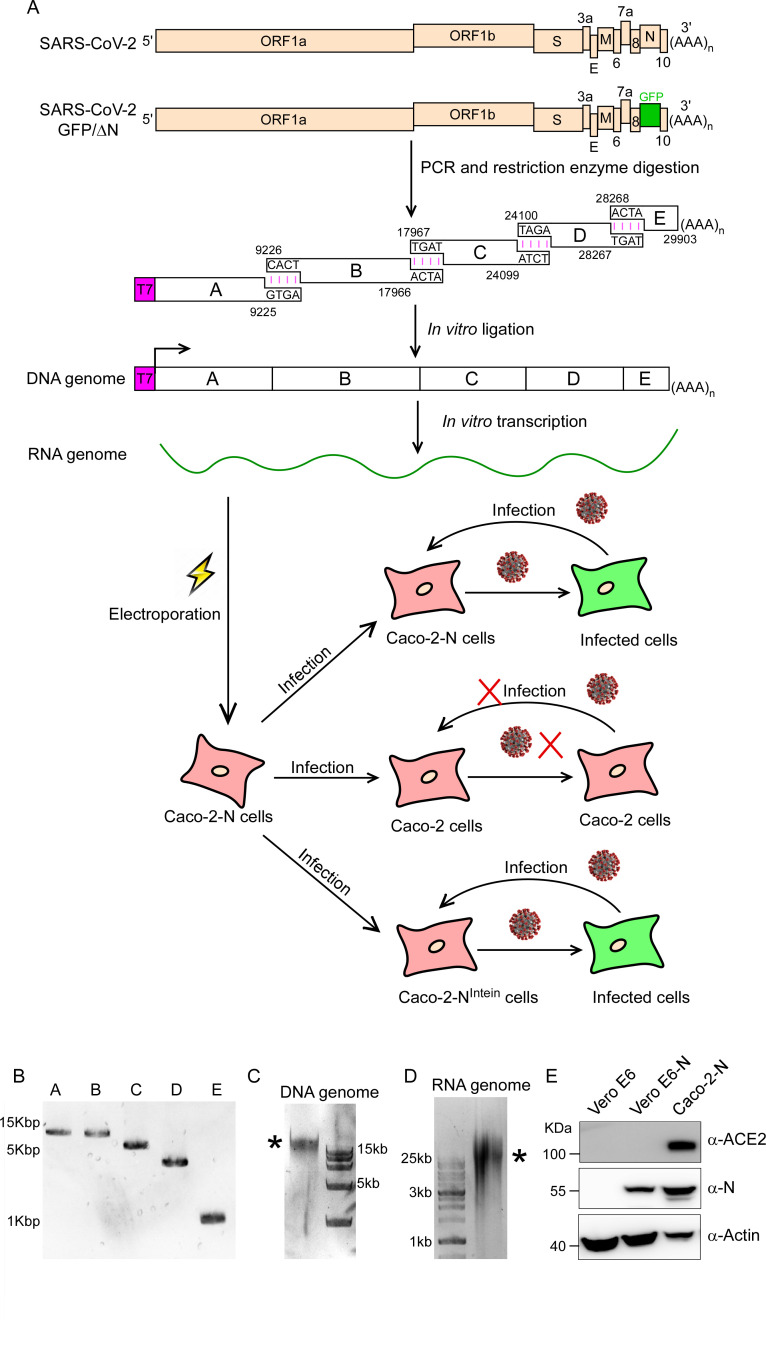
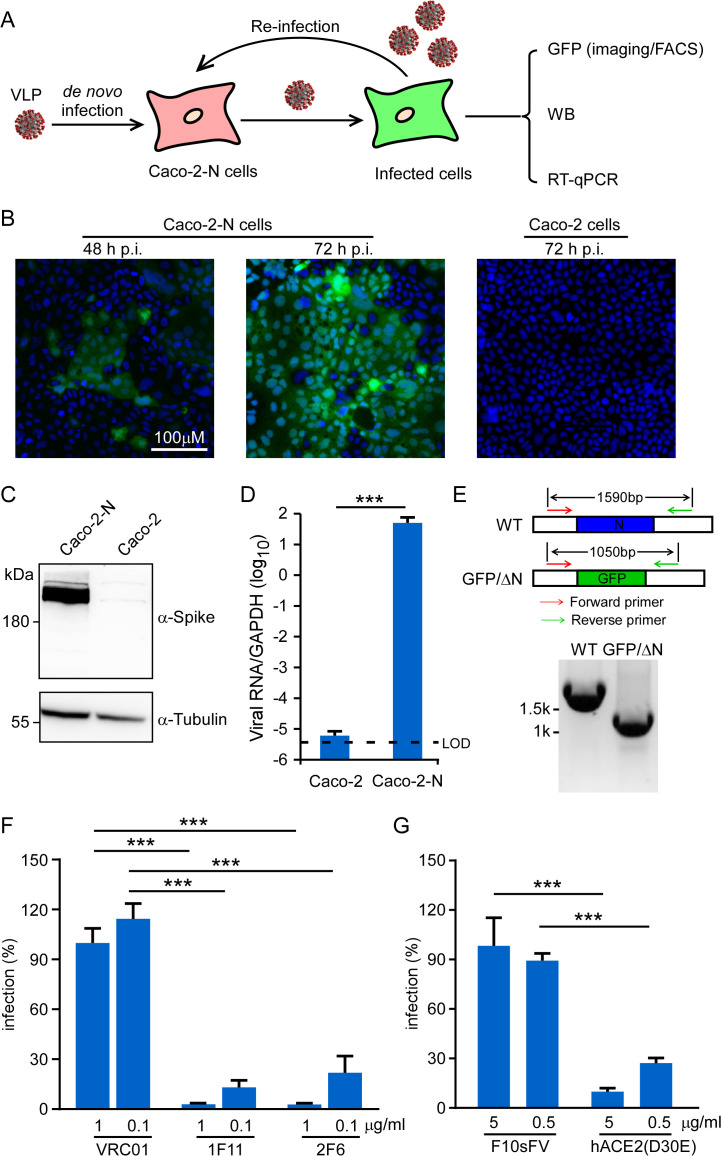
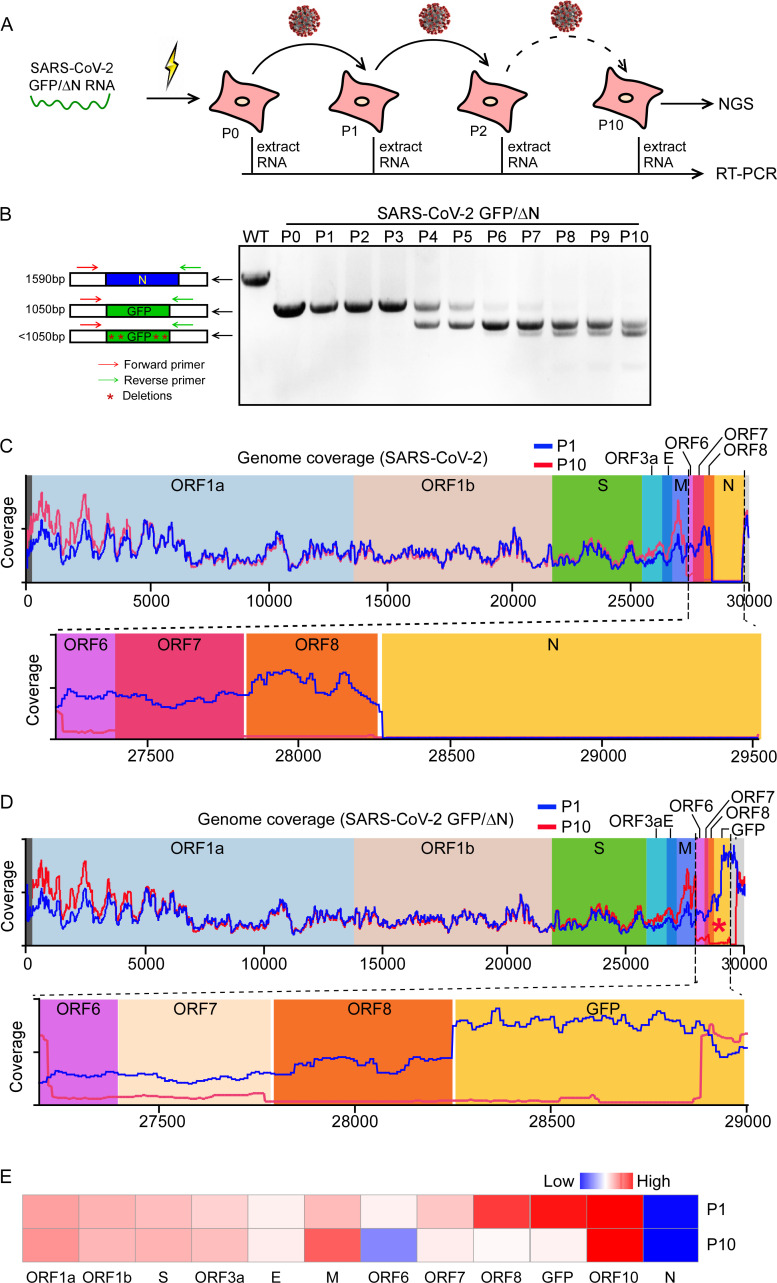
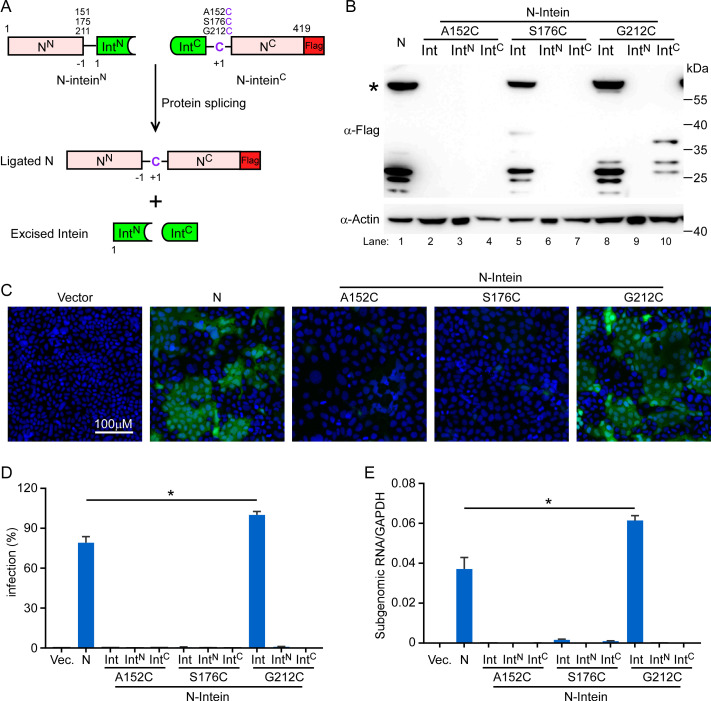
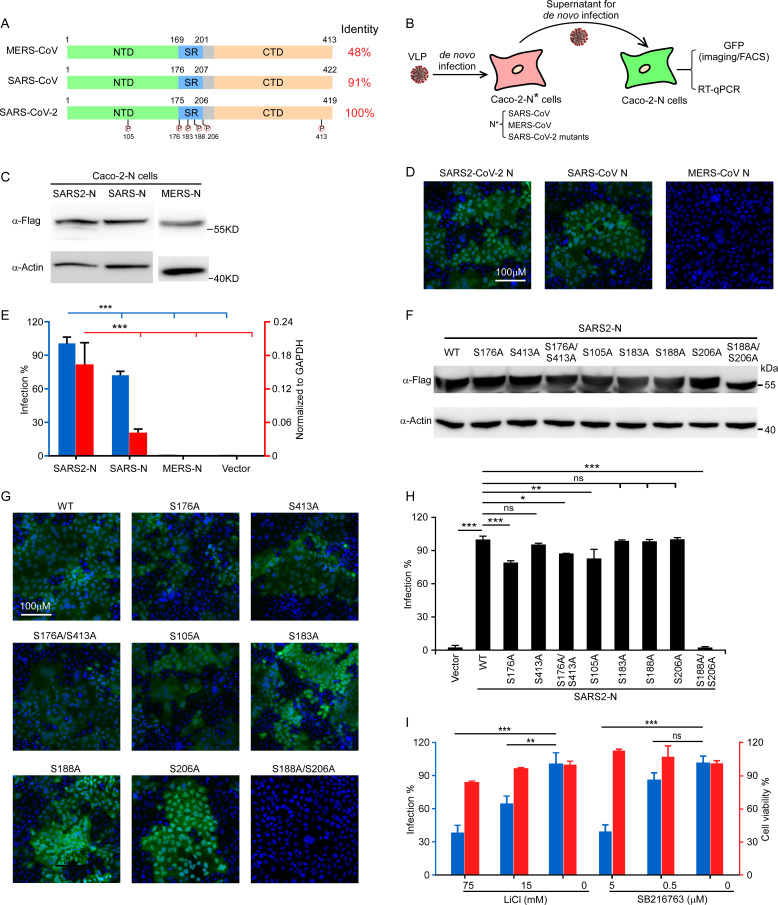
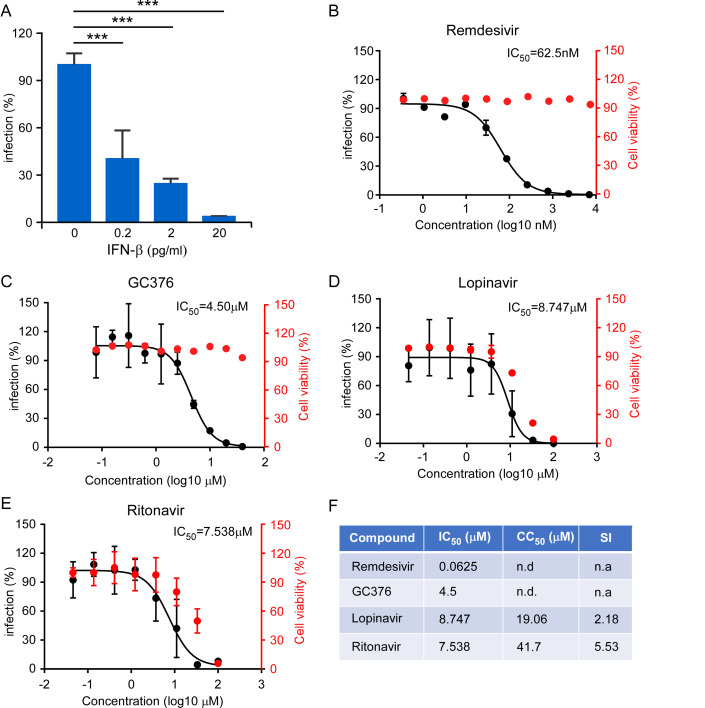
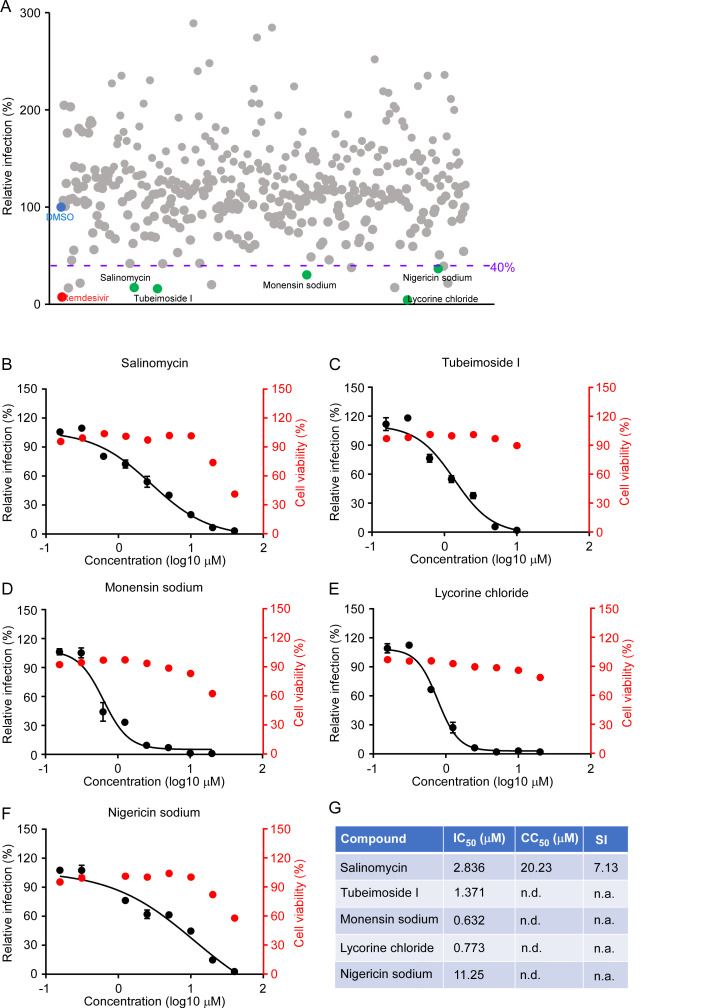
Severe acute respiratory syndrome coronavirus 2 (SARS-CoV-2) causes the global pandemic of COVID-19. SARS-CoV-2 is classified as a biosafety level-3 (BSL-3) agent, impeding the basic research into its biology and the development of effective antivirals. Here, we developed a biosafety level-2 (BSL-2) cell culture system for production of transcription and replication-competent SARS-CoV-2 virus-like-particles (trVLP). This trVLP expresses a reporter gene (GFP) replacing viral nucleocapsid gene (N), which is required for viral genome packaging and virion assembly (SARS-CoV-2 GFP/ΔN trVLP). The complete viral life cycle can be achieved and exclusively confined in the cells ectopically expressing SARS-CoV or SARS-CoV-2 N proteins, but not MERS-CoV N. Genetic recombination of N supplied in trans into viral genome was not detected, as evidenced by sequence analysis after one-month serial passages in the N-expressing cells. Moreover, intein-mediated protein trans-splicing approach was utilized to split the viral N gene into two independent vectors, and the ligated viral N protein could function in trans to recapitulate entire viral life cycle, further securing the biosafety of this cell culture model. Based on this BSL-2 SARS-CoV-2 cell culture model, we developed a 96-well format high throughput screening for antivirals discovery. We identified salinomycin, tubeimoside I, monensin sodium, lycorine chloride and nigericin sodium as potent antivirals against SARS-CoV-2 infection. Collectively, we developed a convenient and efficient SARS-CoV-2 reverse genetics tool to dissect the virus life cycle under a BSL-2 condition. This powerful tool should accelerate our understanding of SARS-CoV-2 biology and its antiviral development.


Conflict of interest statement

I have read the journal’s policy and the authors of this manuscript have the following competing interests: Q.D. and X.J. have filed a patent application on the use of the SARS-CoV-2 transcomplementation system and its use for anti-SARS-CoV-2 drug screening.

Figures

Fig 1
Fig 1. Production of SARS-CoV-2 GFP/ΔN trVLP.
(A) The top rows show genetic organizations of the SARS-CoV-2 and SARS-CoV-2 GFP/ΔN genomes. The ORF of N is replaced with reporter gene (GFP here). The cDNA of SARS-CoV-2 GFP/ΔN genome was divided into five fragments designated as Fragment A, B, C, D and E, which could be obtained by PCR (B). Each cDNA fragment was flanked by a class IIS restriction endonuclease site (BsaI or BsmBI) and the nucleotide sequences and locations of the cohesive overhangs are indicated. The fragment cDNA were digested and purified for directed assembly of SARS-CoV-2 GFP/ΔN cDNA (see C panel, and the star indicates the genome-length cDNA), which served as the template for in vitro transcription to generate viral RNA genome (see D panel, and the star indicates the genome-length RNA transcript). The viral genomic RNAs were electroporated into Caco-2-N cells. After 3 days, the supernatant was collected and inoculated with Caco-2 or Caco-2-N cells. (E). Western blotting assay was performed to detect the expression of N proteins and ACE2 in Caco-2-N cells, Vero E6 and Vero E6-N cells.
Fig 2
Fig 2. The recombinant SARS-CoV-2-GFP/ΔN trVLP can propagate with the help of viral N protein.
(A) Experimental scheme. Caco-2 or Caco-2-N cells were infected with SARS-CoV-2 GFP/ΔN for 3h (MOI 0.05), washed, and incubated for an additional 72 h. GFP fluorescence were observed or quantified by microscopy or flow cytometry analysis. Viral RNA was determined by RT-qPCR assay; (B) GFP expression was observed in Caco-2 or Caco-2-N cells using microscopy at indicated time point after inoculation; Representative images from one of three independent experiments. (C) Cell lysates were resolved by SDS-PAGE and probed with anti-Spike and anti-Tubulin antibodies. Representative images from two independent experiments; (D) The total RNAs were extracted and RT-qPCR assays were conducted to determine viral RNA levels. Error bars represent the standard deviations from one of two independent experiments performed in triplicate; (E) RT-PCR analysis of the SARS-CoV-2 GFP/ΔN genome in Caco-2-N cells infected with recombinant virus using a primer set flanking the N region. The expected DNA sized were indicated in each genome, and DNA marker is shown on the left. Representative images from one of two independent experiments; (F-G) Recombinant SARS-CoV-2 GFP/ΔN virus was incubated with indicated doses of neutralizing mAbs against SARS-CoV-2 (1F11 and 2F6) or HIV (VCR01), as well as soluble human ACE2-Fc or F10sFV for 1 h prior to inoculation. The infection was analyzed by GFP expression 2 days later, and the number of positive cells was expressed as a percentage of that for the VRC01 or F10sFV treatment control. Error bars represent the standard deviations from three independent experiments (n = 6). ***, P < 0.001. Significance assessed by one-way ANOVA.
Fig 3
Fig 3. Characterization of the genetic stability of SARS-CoV-2 GFP/ΔN trVLP.
(A) Detection of the GFP reporter gene during viral passage. RNAs were extracted from the VLP infected cells of P0 to P10 passage, respectively. (B) RT-PCR was performed with a primer pair flanking the N region of ORF8 and 3’UTR. The PCR products were resolved on an agarose gel using electrophoresis. The numbers of time points-samples-passage were denoted on the top of each lane. Representative images from one of three independent experiments; (C-D) RNA-seq coverage of virus derived reads aligned to SARS-CoV-2 (C) or SARS-CoV-2 GFP/ΔN (D) genome, respectively. (E) Heatmap shows the expression levels of each subgenomic RNA of P1 or P10 trVLP.
Fig 4
Fig 4. Reconstitution of functional N protein by intein-mediated protein splicing.
(A) Scheme depicting of intein-mediated protein trans-splicing to reconstitute full length N protein. (B) Western blot (WB) analysis of lysates from Caco-2 cells transduced with either full-length N or intein-N lentiviruses. The star indicates the full-length N protein. The WB is representative of three independent experiments. (C) GFP fluorescence in Caco-2-N cells infected cell culture medium (containing SARS-CoV-2 GFP/ΔN progeny) collected from each Caco-2-Nint cells which was inoculated with SARS-CoV-2 GFP/ΔN trVLP at 2 days of culture. The image is representative of n = 4. (D) Cells were harvested to quantify GFP expression by flow cytometry analysis, and (E) Subgenomic RNA of E were determined by RT-qPCR assay. Error bars represent the standard deviations from one of three independent experiments performed in triplicate. *, P < 0.05. Significance assessed by one-way ANOVA.
Fig 5
Fig 5. Site-specific phosphorylation of N is required to support virus life cycle.
(A) Schematics and alignments of N proteins from MERS-CoV, SARS-CoV and SARS-CoV-2. The phosphorylation sites in SARS-CoV-2 N protein were highlighted. (B) Schematic presentation of assessment of N variants function. The trVLP inoculated with Caco-2 cells transduced with N variants, and the cell culture medium were collected to infect the Caco-2-N cells, and GFP expression analyzed by flow cytometry/microscopy or viral subgenomic RNA abundance were determined by RT-qPCR. (C) Western blotting assay was performed to detect the N proteins expression in Caco-2 cells transduced with distinct N genes from SARS-CoV-2, SARS-CoV or MERS-CoV. (D-E) The cell culture medium was collected from SARS-CoV-2 GFP/ΔN trVLP infected Caco-2 cells expressing N from SARS-CoV-2, SARS-CoV or MERS-CoV to infect the naïve Caco-2-N cells. GFP were observed using microscopy and cellular RNA was extracted for RT-qPCR analysis to determine viral subgenomic RNA levels. (F) Western blotting assay detected the expression of SARS-CoV-2 N WT or mutants in Caco-2 cells. (G-H) The cell culture medium was collected from SARS-CoV-2 GFP/ΔN trVLP infected Caco-2 cells expressing SARS-CoV-2 N mutants to infect the naïve Caco-2-N cells. GFP were observed using microscopy and cellular RNA was extracted for RT-qPCR analysis to determine viral subgenomic RNA levels. (I) GSK-3 inhibitors LiCl or SB216763 treated Caco-2-N cells inoculated with SARS-CoV-2 GFP/ΔN trVLP, the cell culture medium was then inoculated with Caco-2-N cells. RNA was extracted for RT-qPCR analysis to determine viral subgenomic RNA levels. Cell viability was evaluated by CellTiter-Glo assay. Error bars (E, H and I) represent the standard deviations from one of three independent experiments performed in triplicate. n.s. no significance; *, P < 0.05; **, P < 0.01; ***, P < 0.001. Significance assessed by one-way ANOVA.
Fig 6
Fig 6. Inhibition of recombinant SARS-CoV-2 GFP/ΔN trVLP infection by IFN and antivirals.
(A) IFN-β pretreated Caco-2-Nint cells were subsequently infected with trVLP and cells were subjected to flow cytometry analysis for quantify the GFP fluorescence at 2 days post-infection. Error bars represent the standard deviations from three independent experiments (n = 6). (B-E) Antiviral effect of remdesivir, GC376, lopinavir and ritonavir. The drug treated cells were infected with trVLP and GFP fluorescence was quantified at 48h after infection. The cytotoxic effect of each drug at indicated concentrations were determined by CellTiter-Glo cell viability assay. The virus infection or cytotoxicity is plotted versus compound concentration (n = 3 biological replicates for all compounds). The black dots indicate replicate measurements, and the black lines indicate dose-response curve fits. The red dots indicate cytotoxicity. IC50 values were calculated using Prism software and is representative of one of three independent experiments performed in triplicate. Three independent experiments had similar results. (F) Comparison of antiviral activity and cytotoxicity of each compound. Selectivity Index (SI), a ratio that compares a drug’s cytotoxicity and antiviral activity was also calculated. n.d. = not detected; n.a. = not applicable.
Fig 7
Fig 7. High throughput screening of antivirals against SARS-CoV-2 infection using trVLP system.
(A) Screening of 377 compounds from Topscience Natural Product Library and hits selection. The purple dot line represents the threshold (40%) for positive hit compounds. DMSO (blue) and remdesivir (red) are used as the control for the screening. Each dot represents a single compound, and the green dots represent the promising candidates which exhibited potent antiviral activity without dramatic cytotoxic effect. (B-F) Dose response curves of selected hit compounds. Compounds concentrations are presented in log scale for logarithmic interpolation. Dose response curves were generated using GraphPad Prism software version 7.0. IC50 values were calculated using Prism software and is representative of one of three independent experiments. Error bars represent the standard deviations from one of three independent experiments performed in triplicate. (G) Comparison of antiviral activity and cytotoxicity of each compound. Selectivity Index (SI), a ratio that compares a drug’s cytotoxicity and antiviral activity was also calculated. n.d. = not detected; n.a. = not applicable.

Comment in

Similar articles

Cited by

References

    1. Wang C, Horby PW, Hayden FG, Gao GF. A novel coronavirus outbreak of global health concern. Lancet. 2020;395(10223):470–3. Epub 2020/01/28. 10.1016/S0140-6736(20)30185-9 - DOI - PMC - PubMed
    1. Rome BN, Avorn J. Drug Evaluation during the Covid-19 Pandemic. N Engl J Med. 2020;382(24):2282–4. Epub 2020/04/15. 10.1056/NEJMp2009457 . - DOI - PubMed
    1. Fung TS, Liu DX. Human Coronavirus: Host-Pathogen Interaction. Annu Rev Microbiol. 2019;73:529–57. Epub 2019/06/22. 10.1146/annurev-micro-020518-115759 . - DOI - PubMed
    1. Enjuanes L, Almazan F, Sola I, Zuniga S. Biochemical aspects of coronavirus replication and virus-host interaction. Annu Rev Microbiol. 2006;60:211–30. Epub 2006/05/23. 10.1146/annurev.micro.60.080805.142157 . - DOI - PubMed
    1. Lai MM. Coronavirus: organization, replication and expression of genome. Annu Rev Microbiol. 1990;44:303–33. Epub 1990/01/01. 10.1146/annurev.mi.44.100190.001511 . - DOI - PubMed

Publication types

MeSH terms

Substances