. 2021 Apr;20(4):e13341.
doi: 10.1111/acel.13341. Epub 2021 Mar 12.

B-cell capacity for differentiation changes with age

Affiliations

B-cell capacity for differentiation changes with age

Xuanxiao Xie et al. Aging Cell. 2021 Apr.

Abstract

Background: Age-related immune deficiencies are thought to be responsible for increased susceptibility to infection in older adults, with alterations in lymphocyte populations becoming more prevalent over time. The loss of humoral immunity in ageing was attributed to the diminished numbers of B cells and the reduced ability to generate immunoglobulin.

Aims: To compare the intrinsic B-cell capacity for differentiation into mature plasma cells (PCs), between young and old donors, using in vitro assays, providing either effective T-cell help or activation via TLR engagement.

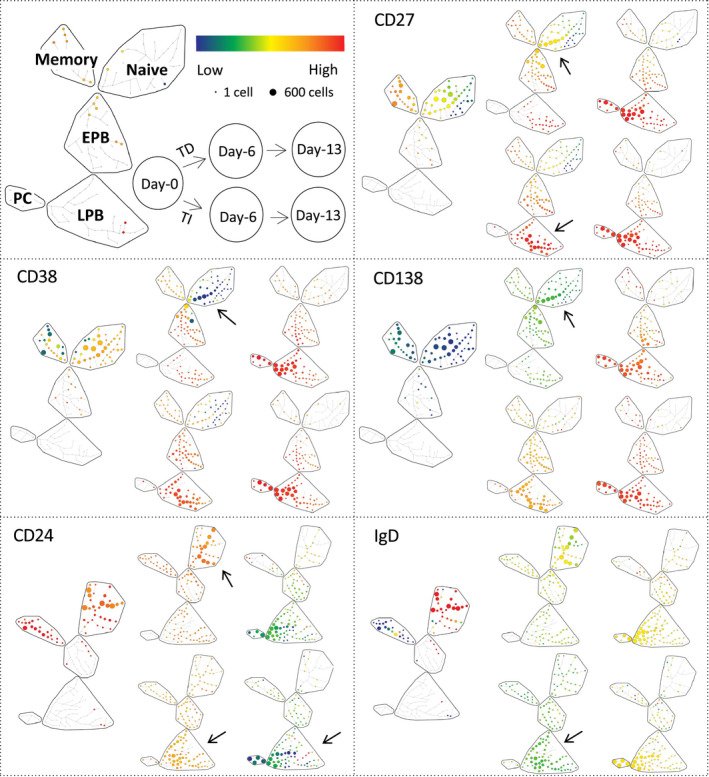
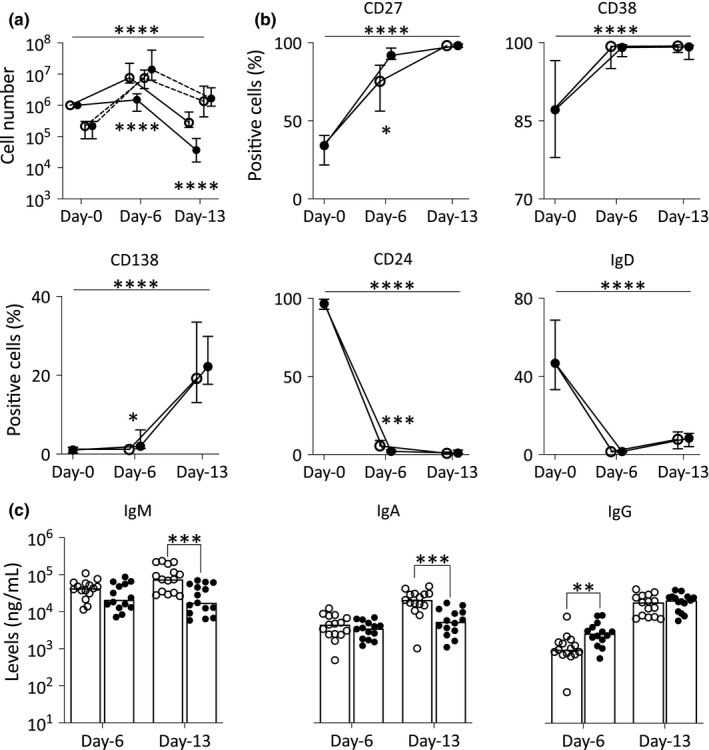
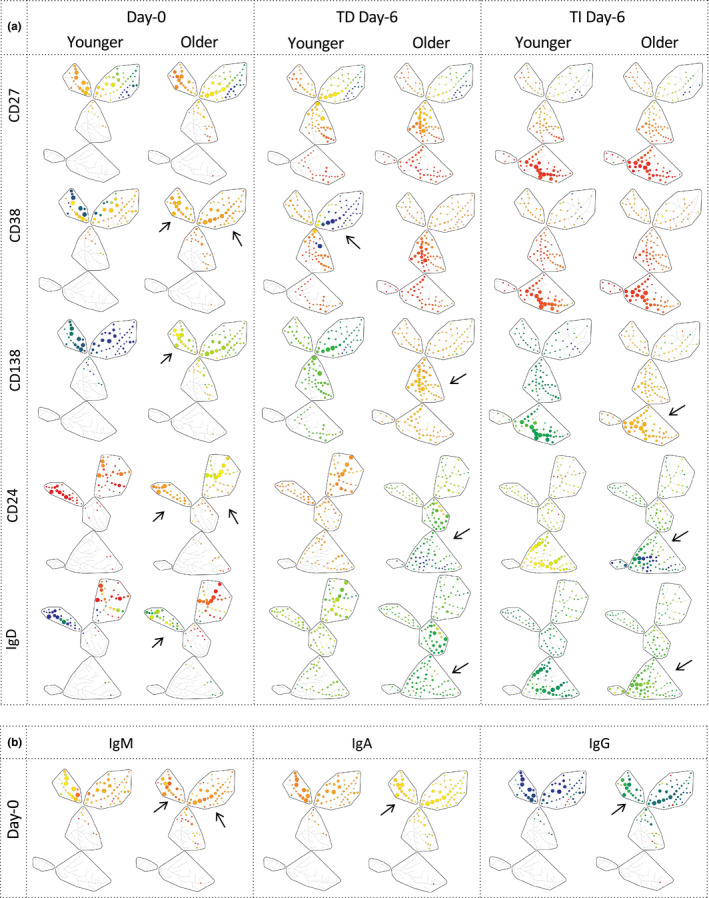
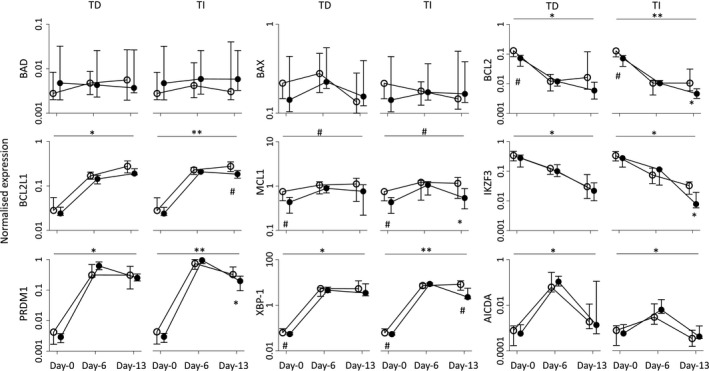
Methods: B cells were isolated from healthy individuals, in younger (30-38 years) and older (60-64 years) donors. An in vitro model system of B-cell differentiation was used, analysing 5 differentiation markers by flow cytometry, under T-dependent (TD: CD40/BCR stimulation) or T-independent (TI: TLR7/BCR activation) conditions. Antibody secretion was measured by ELISA and gene expression using qPCR.

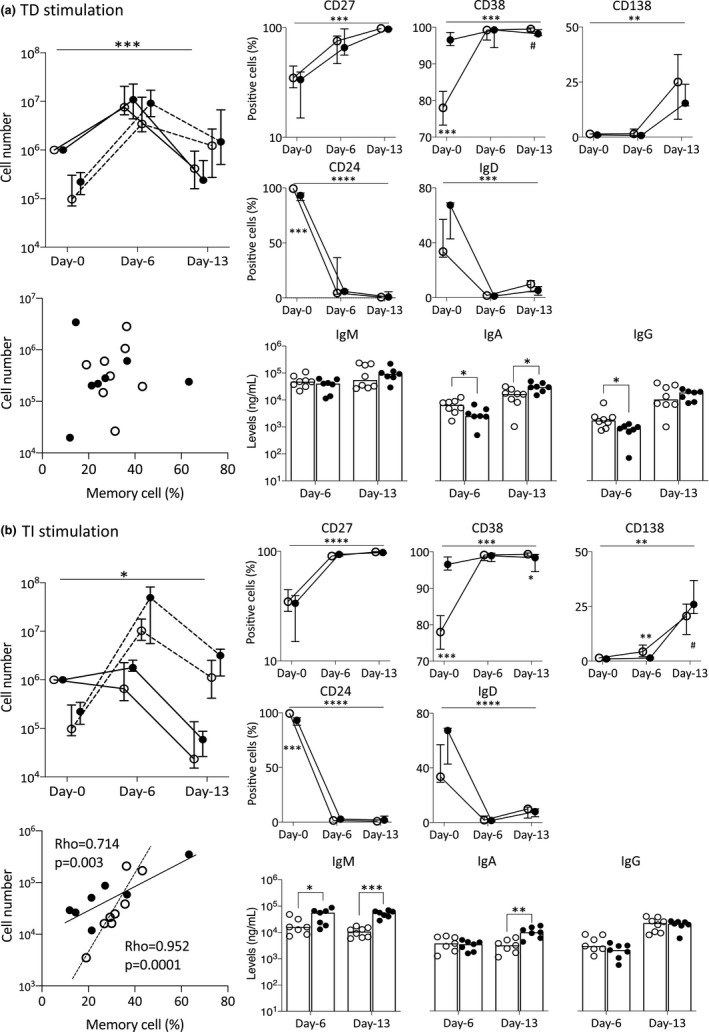
Results: TI and TD differentiation resulted in effective proliferation of B cells followed by their differentiation into PC. B-cell-executed TI differentiation was faster, all differentiation marker and genes being expressed earlier than under TD differentiation (day 6), although generating less viable cells and lower antibody levels (day 13). Age-related differences in B-cell capacity for differentiation were minimal in TD differentiation. In contrast, in TI differentiation age significantly affected proliferation, viability, differentiation, antibody secretion and gene expression, older donors being more efficient.

Conclusion: Altogether, B-cell differentiation into PC appeared similar between age groups when provided with T-cell help, in contrast to TI differentiation, where multiple age-related changes suggest better capacities in older donors. These new findings may help explain the emergence of autoantibodies in ageing.

Keywords: B-cell differentiation; T-cell dependent; T-cell independent; ageing.


Conflict of interest statement

No conflicts of interest, financial or otherwise, are declared by the authors.

Figures

FIGURE 1
FIGURE 1
B‐cell changes in marker expression levels during differentiation. Top left: SPADE trees of cellular hierarchy with clusters of cells (nodes) with a similar profile being grouped in subsets (region: naïve, memory, EPB, early plasmablasts; LPB, late plasmablasts; PC, plasma cells) based on manual annotation of the phenotype. Organization of data displayed for TD/TI differentiation at 3 time points (days 0, 6 and 13) and colour‐coded scale for low (blue) to high (red) levels of expression. Top right and bottom 4 panels: SPADE trees of cellular hierarchy for 5 markers expressed on B cells in a representative donor (age 36). Arrows highlight visible differences. Note that regulatory B cells are not indicated on the SPADE representation (usually part of the EPB subset) due to their small number and only possible identification at day 0. Also, note the move from naïve and memory subsets to EPB and LPB at day 6 in TD while mainly from the memory to EPB subset in TI. Both assays showed very similar cell distributions in LPB and PC by day 13
FIGURE 2
FIGURE 2
B‐cell changes in marker expression (% of positive cells) during differentiation. (a) Number of live (plain line) and dead (dashed line) B cells normalized (using counting beads) compared with day 0 (n = 15, median, IQR). (b) Positivity (% of positive live B cells) for each marker (median, IQR). (c) Total IgM, IgA and IgG levels measured by ELISA (n = 15) from supernatant collected at days 6 and 13. p‐Value for the overall results between two differentiation assays in (a) and (b) was calculated by ANOVA as indicated by the top bar. Comparison of the 2 assays at individual time points (all 3 panels) was tested by MWU, and significance is indicated by symbol next to each group (n = 10). ○, TD assay; ●, TI assay. p‐Values: *p < 0.050; **p = 0.009; ***p < 0.001; and ****p = 0.0001
FIGURE 3
FIGURE 3
B‐cell changes in marker expression levels at day 0 and day 6 of differentiation in young and old subjects. SPADE trees of cellular hierarchy in a representative donor (age 36 and 61) for (a) 5 markers expressed on live B cells at days 0 and 6 of the assays (using the same display as in Figure 1) and (b) Ig‐isotype expression on live circulating B cells (day 0). Arrows highlight visible differences in levels of expression of markers. Note that the proportion of naïve and EPB cells is higher in the older donor at day 0 (as shown by larger nodes in these subsets). Also, note the move from naïve and memory subsets to EPB in older donor at day 6 in TD while mainly from the memory to EPB subset in the younger one. In contrast in TI, both donors showed very similar cell distribution in EPB and LPB by day 6
FIGURE 4
FIGURE 4
Changes in B‐cell differentiations between age groups during (a) TD and (b) TI stimulation conditions. Top left: Number of live (plain line) and dead (dashed line) B cells at different time points. Bottom left: Relationship between % memory cells in circulating B cells and number of PC generated at day 13. p‐Value and rho were calculated using the Pearson correlations. Top right: Positivity (% of live cells) for each marker (median; IQR). Bottom right: Total IgM, IgA and IgG levels measured from supernatant collected at days 6 and 13. n = 8 younger (1 donor missing CD24, IgD and IgM/A/G in TI) and n = 7 older. p‐Value for the overall assays between groups was calculated by ANOVA (top bar). For individual comparison between 2 groups at a time point, MWU test results are given next to the group denoting difference between old and young donors. ○, younger donors; ●, older donors. p‐Values: # p < 0.100; *p < 0.050; **p < 0.010; ***p < 0.001; and ****p = 0.0001
FIGURE 5
FIGURE 5
Expression profile of gene associated with differentiation and survival/apoptosis. Gene expression changes (median, IQR) during differentiation assays between age groups at different time points, quantified by TaqMan qPCR (n = 5 for each group). Overall changes between two groups were tested by ANOVA (top bar). Individual time point differences were tested by MWU. ○, younger donors; ●, older donors. p‐Values: # p < 0.100; *p < 0.050; **p < 0.010, ***p < 0.001; and ****p = 0.0001

Similar articles

Cited by

References

    1. Adams, C. M. , Clark‐Garvey, S. , Porcu, P. , & Eischen, C. M. (2018). Targeting the Bcl‐2 family in B cell lymphoma. Frontiers in Oncology, 8, 636. 10.3389/fonc.2018.00636 - DOI - PMC - PubMed
    1. Agarwal, B. , & Naresh, K. N. (2002). Bcl‐2 family of proteins in indolent B‐cell non‐Hodgkin's lymphoma: study of 116 cases. American Journal of Hematology, 70(4), 278–282. 10.1002/ajh.10139 - DOI - PubMed
    1. Amanna, I. J. , Dingwall, J. P. , & Hayes, C. E. (2003). Enforced bcl‐xL gene expression restored splenic B lymphocyte development in BAFF‐R mutant mice. The Journal of Immunology, 170(9), 4593–4600. 10.4049/jimmunol.170.9.4593 - DOI - PubMed
    1. Amir, E.‐A. , Davis, K. L. , Tadmor, M. D. , Simonds, E. F. , Levine, J. H. , Bendall, S. C. , Shenfeld, D. K. , Krishnaswamy, S. , Nolan, G. P. , & Pe'er, D. (2013). viSNE enables visualization of high dimensional single‐cell data and reveals phenotypic heterogeneity of leukemia. Nature Biotechnology, 31(6), 545–552. 10.1038/nbt.2594 - DOI - PMC - PubMed
    1. Aspinall, R. , & Andrew, D. (2000). Thymic involution in aging. Journal of Clinical Immunology, 20(4), 250–256. 10.1023/a:1006611518223 - DOI - PubMed

MeSH terms