. 2021 Apr 13;16(4):810-824.
doi: 10.1016/j.stemcr.2021.02.006. Epub 2021 Mar 11.

Decoding Neuronal Diversification by Multiplexed Single-cell RNA-Seq

Affiliations

Decoding Neuronal Diversification by Multiplexed Single-cell RNA-Seq

Joachim Luginbühl et al. Stem Cell Reports. .

Abstract

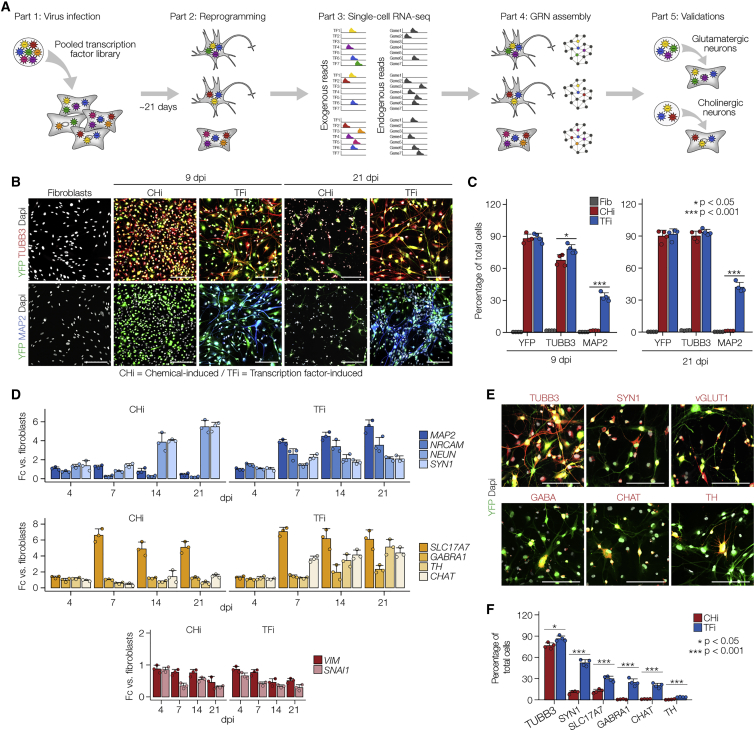
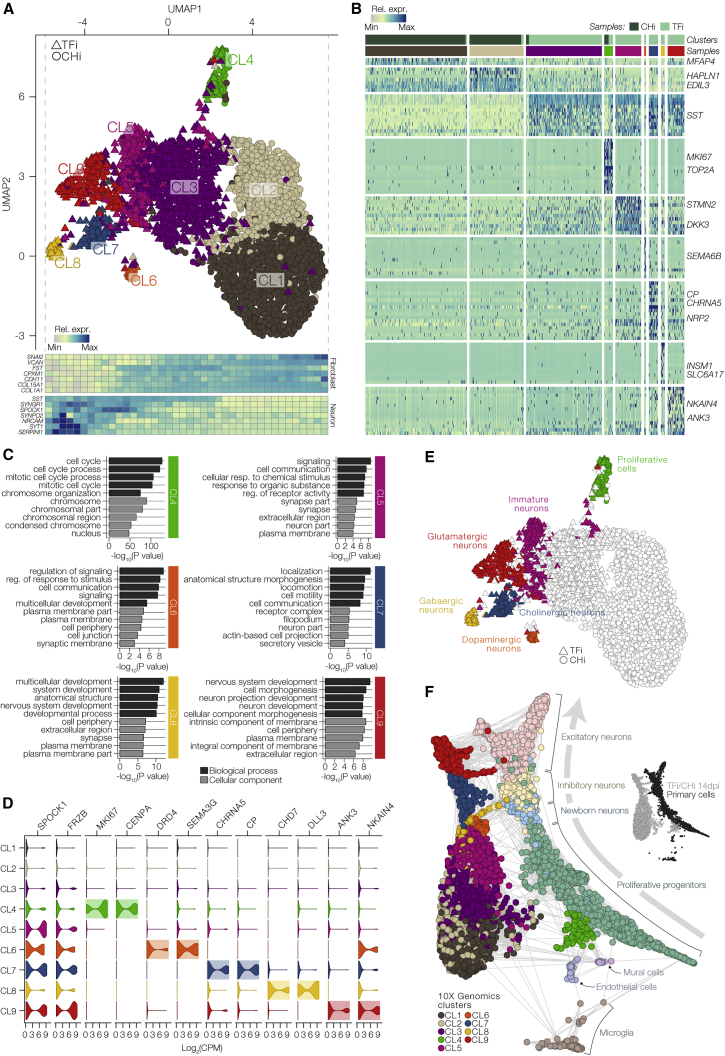
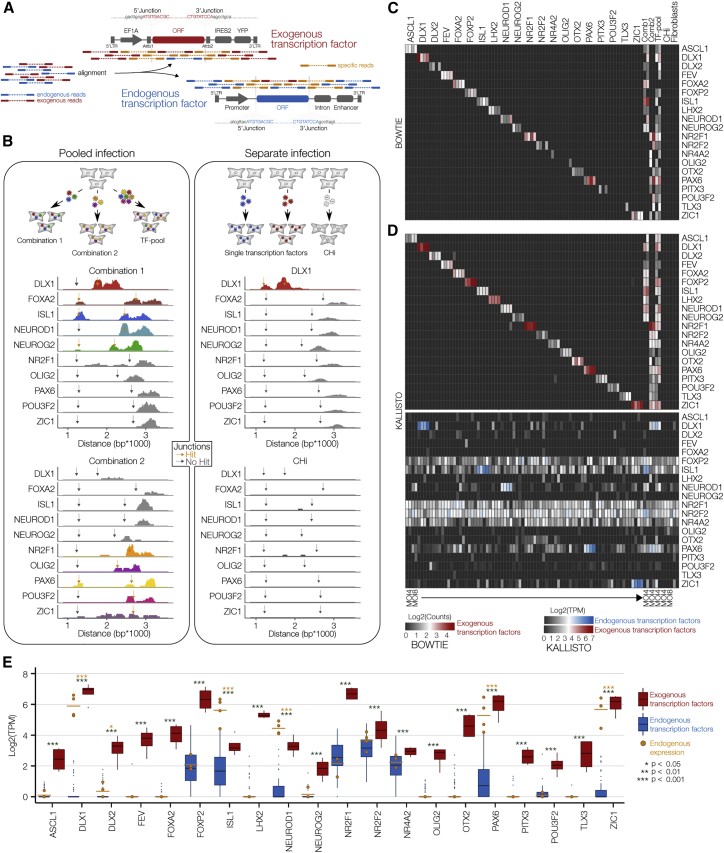
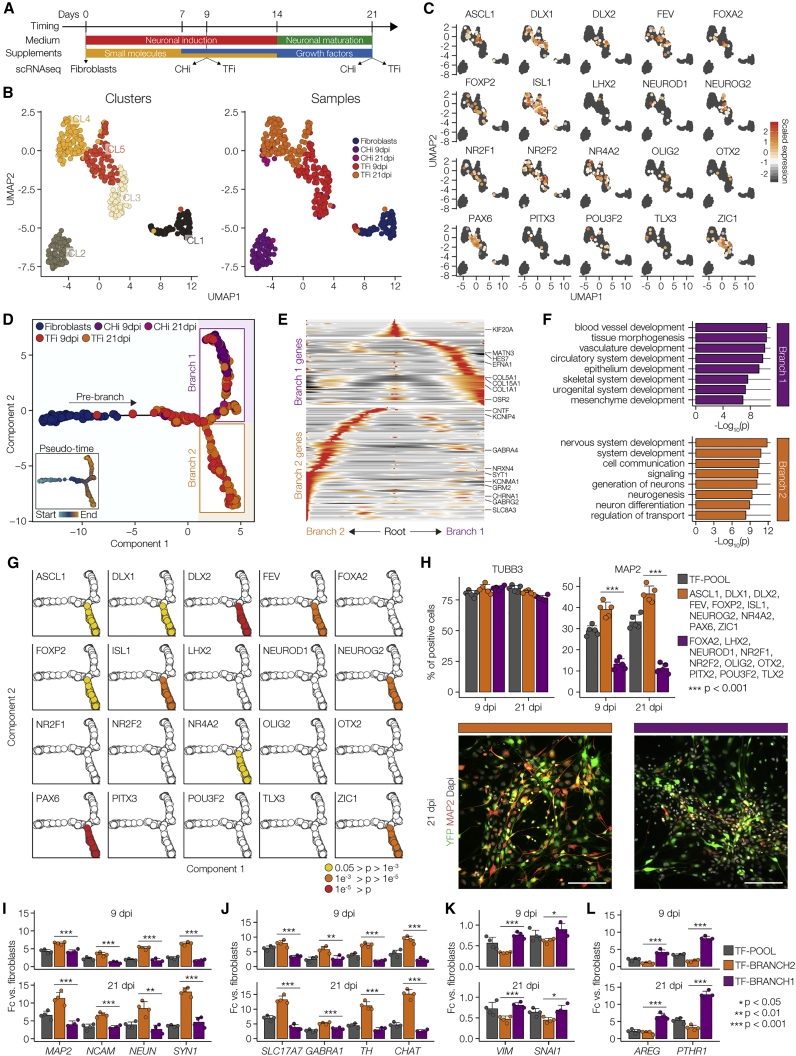
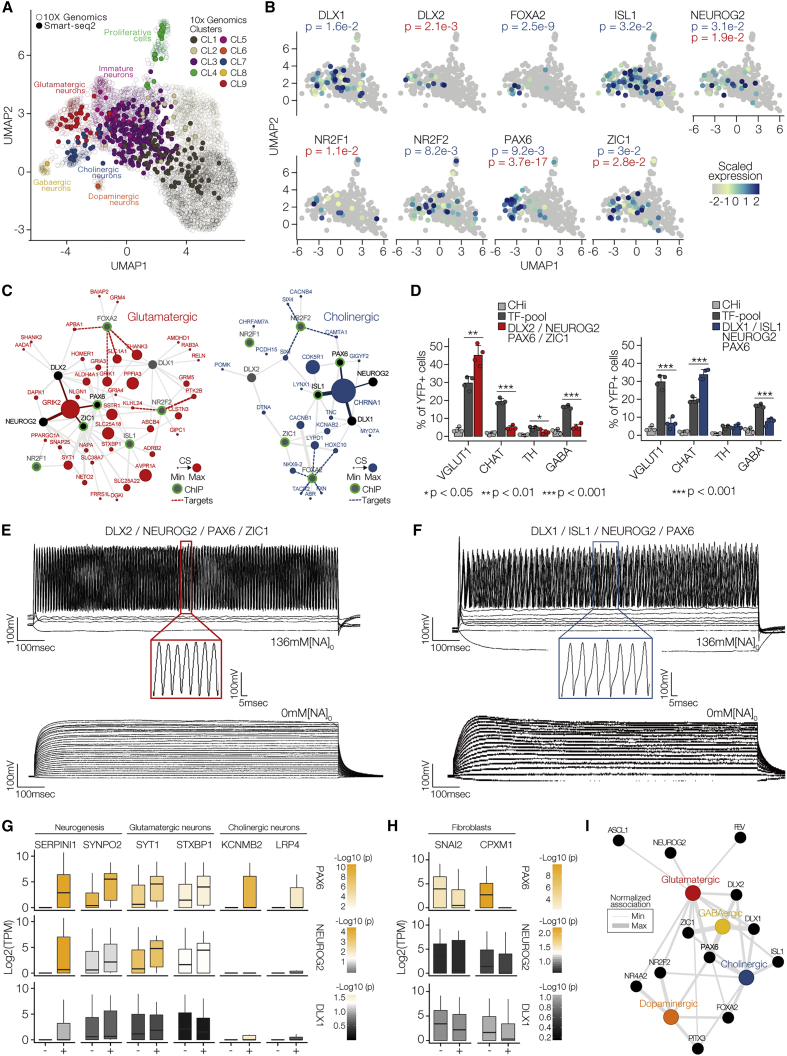
Cellular reprogramming is driven by a defined set of transcription factors; however, the regulatory logic that underlies cell-type specification and diversification remains elusive. Single-cell RNA-seq provides unprecedented coverage to measure dynamic molecular changes at the single-cell resolution. Here, we multiplex and ectopically express 20 pro-neuronal transcription factors in human dermal fibroblasts and demonstrate a widespread diversification of neurons based on cell morphology and canonical neuronal marker expressions. Single-cell RNA-seq analysis reveals diverse and distinct neuronal subtypes, including reprogramming processes that strongly correlate with the developing brain. Gene mapping of 20 exogenous pro-neuronal transcription factors further unveiled key determinants responsible for neuronal lineage specification and a regulatory logic dictating neuronal diversification, including glutamatergic and cholinergic neurons. The multiplex scRNA-seq approach is a robust and scalable approach to elucidate lineage and cellular specification across various biological systems.

Keywords: direct cell reprogramming; neuronal reprogramming; single-cell multiplexing genomics.


Figures

Figure 1
Figure 1
Generation of a Heterogeneous Population of Human Induced Neurons (A) Overview of the single-cell TF multiplex pipeline. (B) Immunostaining for canonical neuronal marker genes of fibroblasts at day 0 and CHi and TFi at 9 and 21 dpi. Scale bars, 100 μm. YFP (green) marks infected cells and cell nuclei were visualized using DAPI nuclear stain (gray). (C) Quantification of immunostainings in (B). n = 4 independent experiments, unpaired Student's t test. Error bars represent mean + SD. (D) qPCR for pan-neuronal marker genes (MAP2, NRCAM, NEUN, SYN1; top), canonical neuronal subtype markers (SLC17A7, GABRA1, TH, CHAT; middle), and canonical fibroblast markers (VIM, SNAI1; bottom). n = 3 independent experiments, unpaired Student's t test. Error bars represent mean + SD. (E) Immunostainings for canonical neuronal subtype markers (red) of TFi at 21 dpi. Scale bars, 100 μm. YFP (green) marks infected cells and cell nuclei were visualized using DAPI nuclear stain (gray). (F) Quantification of immunostainings in (E). n = 4 independent experiments, unpaired Student's t test. Error bars represent mean + SD.
Figure 2
Figure 2
Molecular Characterization of Induced Neurons using scRNA-Seq (A) Top: visualization of droplet-based scRNA-seq data from CHi and TFi at 14 dpi using UMAP (n = 3,865 cells). The detected clusters are indicated by different colors. Bottom: heatmap of the relative expression of canonical fibroblast and neuron markers along UMAP1. (B) Heatmap of the relative expression of top marker genes for each cluster in the UMAP plot in (A). (C) GO analysis of cluster-specific marker genes in clusters CL4–CL9. Shown are the top 5 GO terms related to biological process (dark gray) and cellular component (light gray) for each cluster; colors as in (A). (D) Violin plots of log2-transformed counts per million (CPM) values of marker genes in all clusters. (E) Annotation of TFi clusters CL4–CL9 based on genes differentially expressed between each cluster. (F) Relationship of CHi and TFi to primary human brain cells in a force-directed k-nearest neighbors graph created using SPRING. Primary cells are colored in light colors, induced cells are colored by cluster as in (A).
Figure 3
Figure 3
Distinguished Detection of Exogenous and Endogenous Transcripts (A) Schematic depicting the strategy to distinguish exogenous and endogenous sequencing reads. (B) Bulk RNA-seq on pooled and separately infected fibroblasts. Horizontal dimension, distance from the 5ʹ end of the EF1A promoter; vertical dimension, number of aligned paired-end reads. Gray arrows (no overlap) and golden arrows (overlap) mark 5ʹ and 3′ junctions of exogenous ORFs. (C and D) Heatmaps showing log2-transformed count values of exogenous TFs after alignment using Bowtie (C) and log2-transformed tags per million (TPM) values of exogenous and endogenous TF pairs after trimming junction sequences to ~100 base pairs and alignment using Kallisto (D). For individually infected fibroblasts and CHi, two replicates at an MOI of 4 and two replicates at an MOI of 8 were included. For pooled infected fibroblasts, two replicates at an MOI of 4 were included. (E) Boxplots showing increased exogenous (red) versus endogenous (blue) expression of all TFs across all individually infected fibroblasts. Golden dots show endogenous expression in samples infected with the corresponding exogenous TFs. Unpaired Student's t test. Error bars represent mean + SD.
Figure 4
Figure 4
Association of Developmental Trajectories with Exogenous Expression Profiles (A) Diagram of the differentiation protocol of TFi and CHi, depicting the samples used for the time course Smart-seq experiment. (B) UMAP 2D cell maps of the time course data. Left: cells were colored by cluster identity. Right: cells were colored by sample identity. Fibroblasts (n = 78 cells), CHi at 9 dpi (n = 87 cells), TFi at 9 dpi (n = 129), CHi at 21 dpi (n = 15 cells), and TFi at 21 dpi (n = 137 cells). (C) Visualization of relative expression values of exogenous TFs on UMAP plots. (D) Pseudo-temporal ordering of the Smart-seq time course based on the expression of 2,925 developmental genes (n = 446 cells). Small inset shows the same plot colored by pseudo-temporal values. (E) Heatmap showing ~200 genes with branch-specific differential expression as determined by BEAM (R Package “Monocle”). In this heatmap, columns are points in pseudo-time, rows are genes, and the middle (Root) is the beginning of pseudo-time. Branch 1 goes from the middle of the heatmap to the right, while branch 2 goes to the left. (F) GO analysis of genes differentially expressed in branch 1 (top panel) and branch 2 (bottom panel). (G) Identification of exogenous TFs with branch-specific enrichment based on Fisher's exact tests. (H) Top panels: quantification of TUBB3+ and MAP2+ cells in fibroblasts infected with the complete TF-pool (gray), branch 2-enriched TFs (orange), and unenriched TFs (purple) at 9 and 21 dpi. n = 5 independent experiments, unpaired Student's t test. Error bars represent mean + SD. Bottom panels: representative images of immunostainings for MAP2 (red) at 21 dpi; colors as in top panels. YFP (green) marks infected cells and cell nuclei were visualized using DAPI nuclear stain (gray). Scale bars, 100 μm. (I–L) Neuronal differentiation, loss of fibroblast characteristics, and acquisition of alternative developmental fates as revealed by qPCR for pan-neuronal marker genes (MAP2, NRCAM, NEUN, SYN1) (I), canonical neuronal subtype markers (VGlut1, GABA, TH, CHAT) (J), canonical fibroblast markers (VIM, SNAI2) (K), and branch 1-enriched genes (AREG, PTHR1) (L) at 9 and 21 dpi; colors as in (H). n = 4 independent experiments, unpaired Student's t test. Error bars represent mean +SD.
Figure 5
Figure 5
PAX6 Acts as Master Regulator to Control Reprogramming of Glutamatergic and Cholinergic Neurons (A) Computational mapping of the Smart-seq time course onto the 10X Genomics UMAP. Smart-seq cells are colored based on 10X Genomics cluster membership and positioned based on the five nearest neighbors. (B) Visualization of scaled expression values of exogenous TFs that showed significant enrichment (Fisher's exact test, p < 0.05) in glutamatergic and/or cholinergic clusters on 2D UMAPs. (C) Neuronal subtype-specific co-expression modules on the basis of significant associations (Fisher's exact test, p < 0.05) with exogenous TFs shown in (B). Exogenous TFs associated with genes showing highest CS in each module are shown in black, all other exogenous TFs are shown in gray. Neuronal subtype-specific genes are colored. Direct targets of exogenous TF are indicated with dashed lines based on TF with chromatin immunoprecipitation sequencing (ChIP-seq) evidence, highlighted with green borders. (D) Validation of novel combinations of exogenous TFs by quantification of immunostainings for VGlut1, CHAT, TH, and GABA of CHi (light gray), fibroblasts infected with the complete TF-pool (dark gray) and fibroblasts infected with novel combinations (color) at 21 dpi. n = 4 independent experiments, unpaired Student's t test. Error bars represent mean + SD. (E and F) The generation of repetitive action potentials in induced neurons infected with DLX2, NEUROG2, PAX6, ZIC1 (E) or DLX1, ISL1, NEUROG2, or PAX6 (F). Representative traces in the presence (upper panel) or absence (lower panel) of extracellular Na+ were recorded using the current-clamp protocol. (G and H) Boxplots showing the log2-transformed TPM values of neurogenic and neuronal subtype-specific genes (G) and fibroblast-specific genes (H) in cells with (+) or without (−) exogenous PAX6 (top), NEUROG2 (middle), and DLX1 (bottom). Boxplots are colored based on −log10-transformed p values. (I) Edge-normalized network summarizing the associations of exogenous TFs with glutamatergic, cholinergic, GABAergic, and dopaminergic modules.

References

    1. Adamson B., Norman T.M., Jost M., Cho M.Y., Nunez J.K., Chen Y., Villalta J.E., Gilbert L.A., Horlbeck M.A., Hein M.Y. A multiplexed single-cell CRISPR screening platform enables systematic dissection of the unfolded protein response. Cell. 2016;167:1867–1882.e21. - PMC - PubMed
    1. Alda-Catalinas C., Bredikhin D., Hernando-Herraez I., Eckersley-Maslin A., Stegle O., Reik W. A single-cell transcriptomics CRISPR-activation screen identifies epigenetic regulators of the zygotic genome activation program. Cell. Syst. 2020;11:25–41. - PMC - PubMed
    1. An N., Xu H., Gao W.Q., Yang H. Direct conversion of somatic cells into induced neurons. Mol. Neurobiol. 2016;55:642–651. - PubMed
    1. Bray N.L., Pimentel H., Melsted P., Pachter L. Near-optimal probabilistic RNA-seq quantification. Nat. Biotechnol. 2016;34:525–527. - PubMed
    1. Caiazzo M., Dell’Anno M.T., Dvoretskova E., Lazarevic D., Taverna S., Leo D., Sotnikova T.D., Menegon A., Roncaglia P., Colciago G. Direct generation of functional dopaminergic neurons from mouse and human fibroblasts. Nature. 2011;476:224–227. - PubMed

Publication types