. 2021 May 10;39(5):649-661.e5.
doi: 10.1016/j.ccell.2021.02.015. Epub 2021 Mar 11.

Tumor and immune reprogramming during immunotherapy in advanced renal cell carcinoma

Affiliations

Tumor and immune reprogramming during immunotherapy in advanced renal cell carcinoma

Kevin Bi et al. Cancer Cell. .

Erratum in

  • Tumor and immune reprogramming during immunotherapy in advanced renal cell carcinoma.
    Bi K, He MX, Bakouny Z, Kanodia A, Napolitano S, Wu J, Grimaldi G, Braun DA, Cuoco MS, Mayorga A, DelloStritto L, Bouchard G, Steinharter J, Tewari AK, Vokes NI, Shannon E, Sun M, Park J, Chang SL, McGregor BA, Haq R, Denize T, Signoretti S, Guerriero JL, Vigneau S, Rozenblatt-Rosen O, Rotem A, Regev A, Choueiri TK, Van Allen EM. Bi K, et al. Cancer Cell. 2025 Jun 9;43(6):1177-1179. doi: 10.1016/j.ccell.2025.05.009. Cancer Cell. 2025. PMID: 40494276 Free PMC article. No abstract available.

Abstract

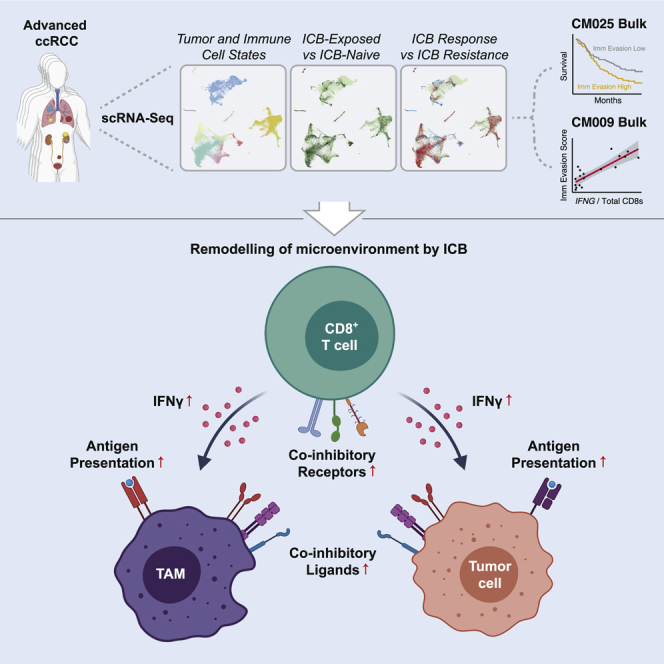
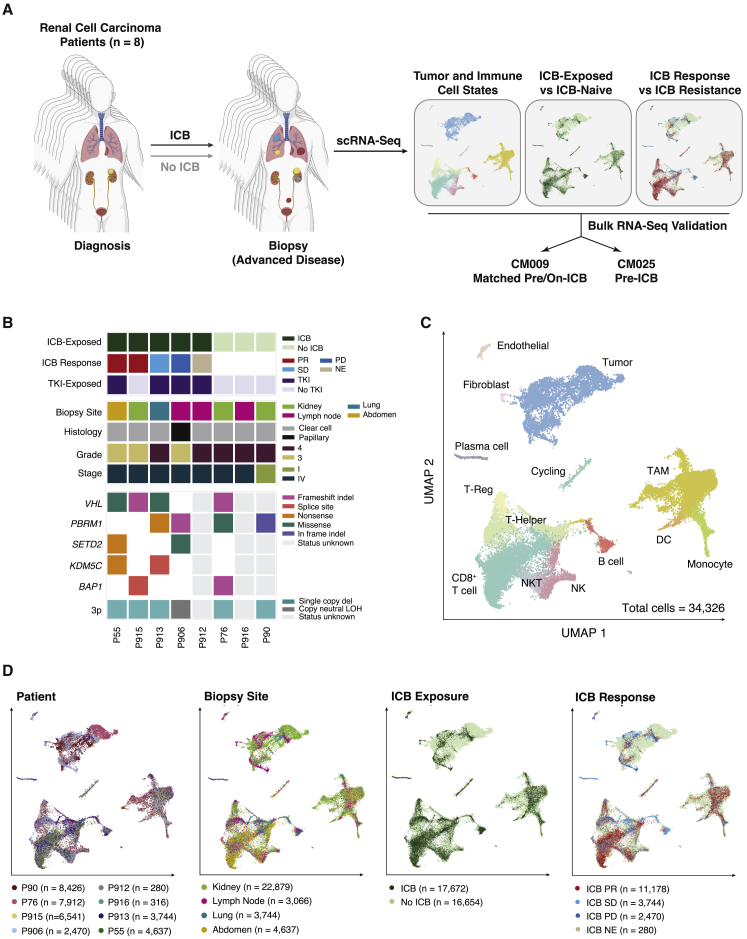
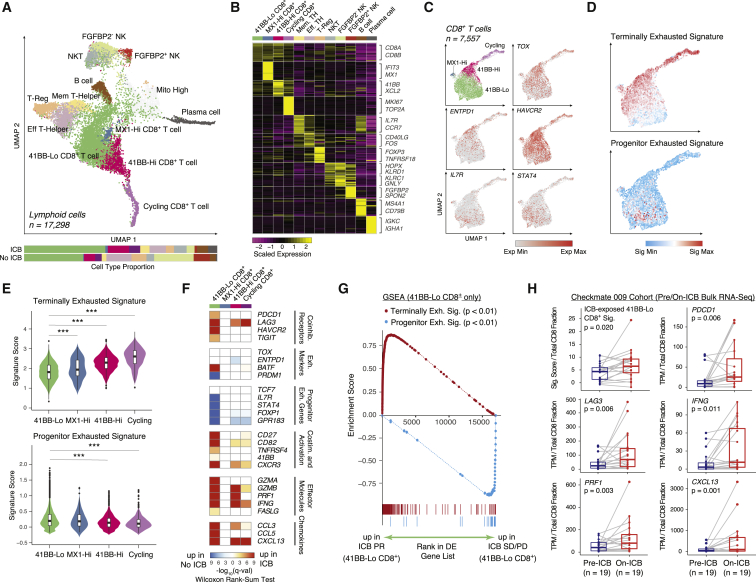
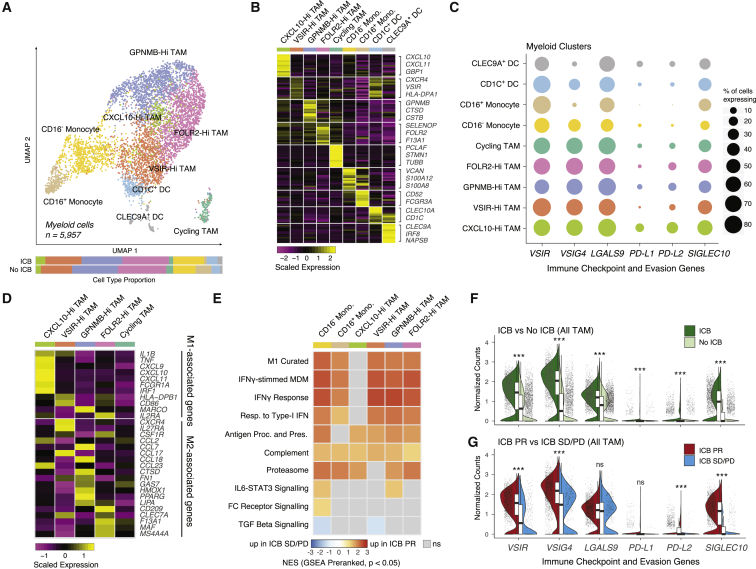
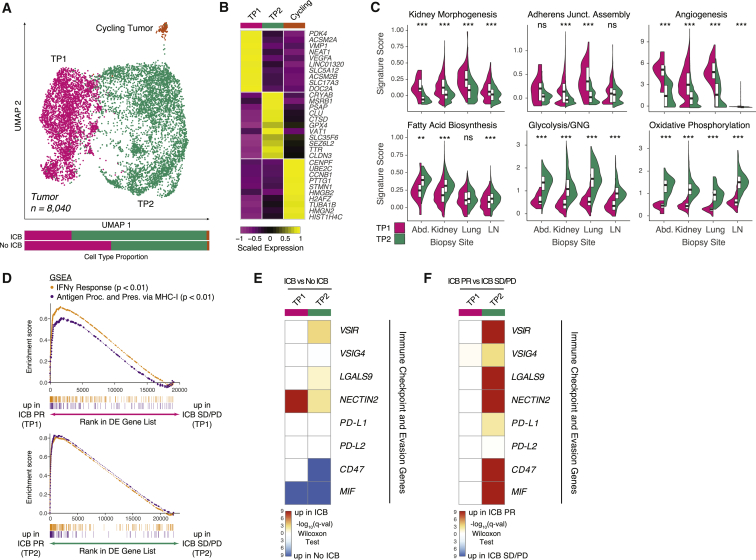
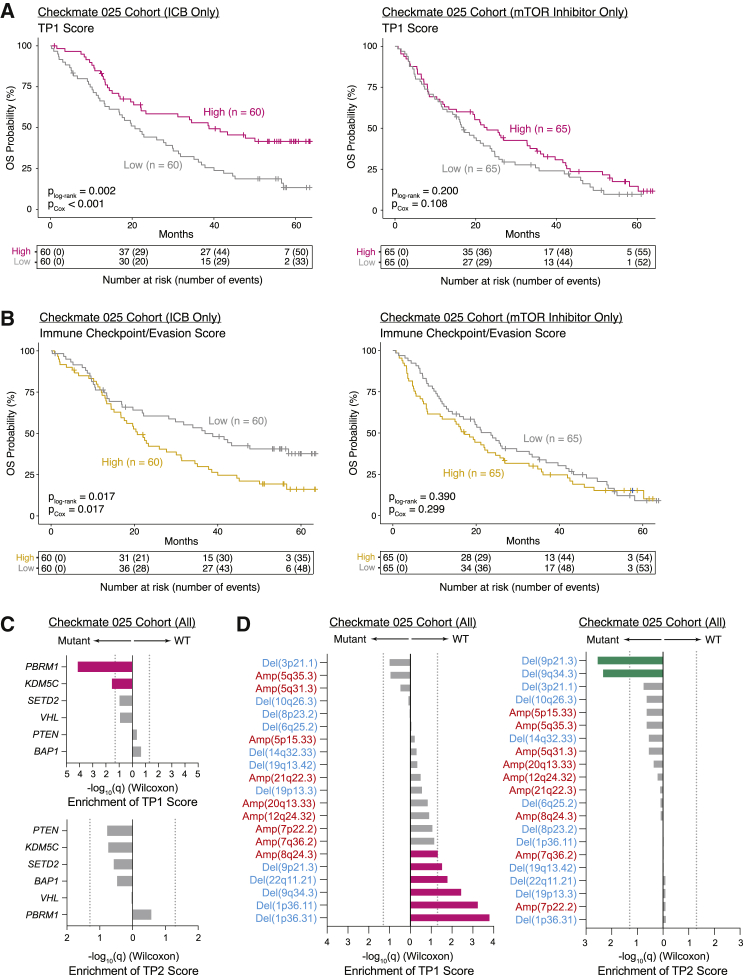
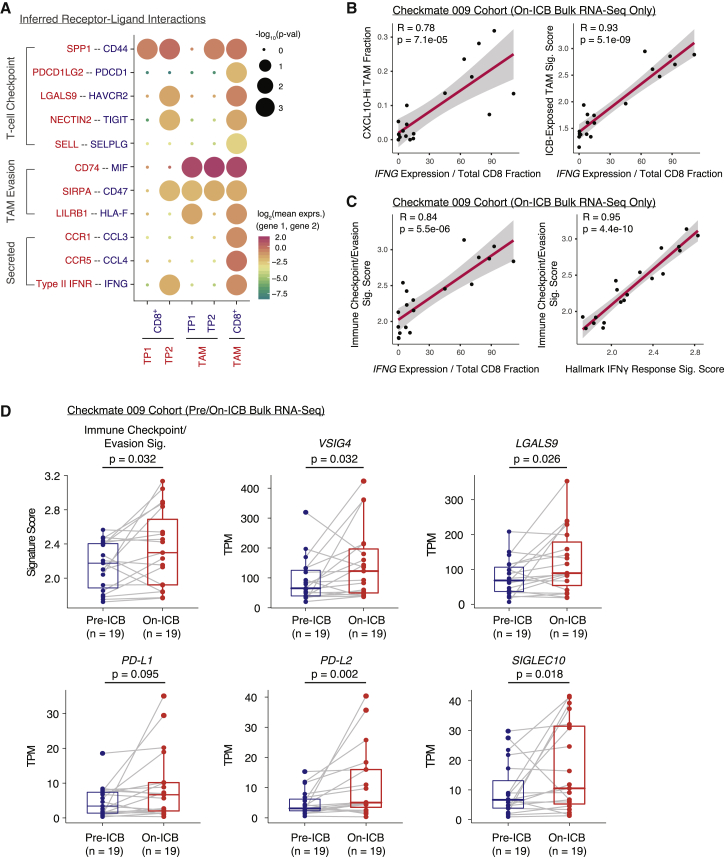
Immune checkpoint blockade (ICB) results in durable disease control in a subset of patients with advanced renal cell carcinoma (RCC), but mechanisms driving resistance are poorly understood. We characterize the single-cell transcriptomes of cancer and immune cells from metastatic RCC patients before or after ICB exposure. In responders, subsets of cytotoxic T cells express higher levels of co-inhibitory receptors and effector molecules. Macrophages from treated biopsies shift toward pro-inflammatory states in response to an interferon-rich microenvironment but also upregulate immunosuppressive markers. In cancer cells, we identify bifurcation into two subpopulations differing in angiogenic signaling and upregulation of immunosuppressive programs after ICB. Expression signatures for cancer cell subpopulations and immune evasion are associated with PBRM1 mutation and survival in primary and ICB-treated advanced RCC. Our findings demonstrate that ICB remodels the RCC microenvironment and modifies the interplay between cancer and immune cell populations critical for understanding response and resistance to ICB.

Keywords: cancer; immunotherapy; kidney; resistance; single cell.


Conflict of interest statement

Declaration of interests M.X.H. has consulted for Amplify Medicines and Ikena Oncology. Z.B. reports research support from Bristol-Meyers Squibb (BMS) and Genentech/imCORE unrelated to this study. D.A.B. reports non-financial support from BMS, honoraria from LM Education/Exchange Services, and personal fees from Octane Global, Defined Health, Dedham Group, Adept Field Solutions, Slingshot Insights, Blueprint Partnerships, Charles River Associates, Trinity Group, and Insight Strategy, outside of this work. B.A.M. has consulted for Bayer, Astellas, AstraZeneca, Seattle Genetics, Exelixis, Nektar, Pfizer, Janssen, Genentech, Eisai, and EMD Serono. He received research support to Dana-Farber Cancer Institute from BMS, Calithera, Exelixis, and Seattle Genetics. J.L.G. is a consultant for and/or receives sponsored research support from GlaxoSmithKline (GSK), Array BioPharma, Codagenix, Verseau, Kymera, and Eli Lilly. A. Rotem is an employee of AstraZeneca and an equity holder in NucleAI and Celsius Therapeutics. A. Regev is a founder and equity holder of Celsius Therapeutics, holds equity in Immunitas Therapeutics, and, until August 31, 2020, was an SAB member of Syros Pharmaceuticals, Neogene Therapeutics, Asimov, and Thermo Fisher Scientific; since August 1, 2020, she has been an employee of Genentech. E.M.V.A. reports advisory/consulting with Tango Therapeutics, Genome Medical, Invitae, Monte Rosa, Enara Bio, Manifold Bio, and Janssen; research support from Novartis and BMS; equity in Tango Therapeutics, Genome Medical, Syapse, Manifold Bio, Monte Rosa, and Enara Bio. T.K.C. reports research support/honoraria from, consulting/advisory relationships with, and/or equity stakes in Alexion, Analysis Group, AstraZeneca, Aveo, Bayer, BMS, Calithera, Cerulean, Corvus, Eisai, EMD Serono, Exelixis, F. Hoffmann-La Roche, Foundation Management, Genentech, GSK, Heron Therapeutics, Infinity Pharma, Janssen Oncology, IQVIA, Ipsen, Lilly, Merck, NCCN, Novartis, Peloton, Pfizer, Pionyr, Prometheus Labs, Roche, Roche Products Limited, Sanofi/Aventis, Takeda, Tracon, Surface Oncology, Tempest, Up-to-Date, OncLIve, PVI, and MJH Life Sciences; patents filed, royalties, or other intellectual properties related to biomarkers of immune checkpoint blockers; and support from the Dana-Farber/Harvard Cancer Center Kidney SPORE and Program, the Kohlberg Chair at Harvard Medical School and the Trust Family, Michael Brigham, and Loker Pinard Funds for Kidney Cancer Research at DFCI.

Figures

None
Graphical abstract
Figure 1
Figure 1
Characterizing the tumor microenvironment of advanced RCC during therapy (A) Study overview. (B) Summary of treatment histories at time of biopsy, clinicopathological features, and genomic features across profiled RCC lesions. ICB Response: PR, partial response; SD, stable disease; PD, progressive disease; NE, not evaluable. For some samples without successful whole-exome sequencing, genomic characterization is incomplete or missing. (C) Uniform manifold approximation and projection (UMAP) of malignant and non-malignant cells captured across all lesions, colored by broad cell type. Granular cell types and states were discerned through iterative reprojection and unsupervised clustering of lymphoid, myeloid, and tumor compartments, and merged into broader cell-type categories for this visualization. DC, dendritic cell; NK, natural killer cell; NKT, natural killer T cell; TAM, tumor-associated macrophage; T-Reg, regulatory T cell. (D) UMAP of malignant and non-malignant cells captured across all lesions, colored by patient, biopsy site, ICB treatment history, and ICB response. See also Figure S1, Table S1.
Figure 2
Figure 2
CD8+ T cell exhaustion states are differentially remodeled by ICB (A) UMAP of lymphoid cells captured across all lesions, colored and labeled by cell type. Bar plots show cell-type proportions grouped by ICB treatment history. (B) Heatmap of scaled normalized expression for cell-type-defining genes as determined by two-sided Wilcoxon rank-sum test with Bonferroni FDR correction (q < 0.01). (C) UMAP of CD8+ T cell subtypes, followed by expression heatmaps in UMAP space of co-inhibitory receptors, exhaustion markers, and memory-associated genes. (D) Heatmaps in UMAP space of VISION signature scores for terminally exhausted and progenitor exhausted CD8+ T cells. (E) Signature score distributions for terminally exhausted and progenitor exhausted CD8+ T cell signatures within each CD8+ T cell subtype. Significance of differential signature enrichment (p value) between subtypes was determined by two-sided Wilcoxon rank-sum test. Boxplots include centerline, median; box limits, upper and lower quartiles; and whiskers extending at most 1.5× the interquartile range past upper and lower quartiles. (F) Heatmap of differential gene expression q values (two-sided Wilcoxon rank-sum test with Bonferroni FDR correction) for comparisons of cells within each CD8+ T cell cluster from ICB-exposed versus ICB-naive patients. (G) Gene set enrichment analysis (GSEA) of terminally exhausted and progenitor exhausted signatures in 4-1BB-Lo CD8+ T cells from ICB PR patients compared with ICB SD/PD patients. (H) Signature scores for an ICB-exposed 4-1BB-Lo CD8+ T cell signature and expression values for individual genes in paired pre-/on-ICB bulk RNA-seq samples in the Checkmate 009 RCC cohort. Expression values for individual genes were normalized against total CD8 fraction per sample as inferred by CIBERSORTx. Significance of differential signature enrichment or expression (p value) was determined by paired two-sided Wilcoxon rank-sum test. Boxplots include centerline, median; box limits, upper and lower quartiles; and whiskers extending at most 1.5× the interquartile range past upper and lower quartiles. ∗∗∗p < 0.001, two-sided Wilcoxon rank-sum test. See also Figures S2 and S3, Table S2.
Figure 3
Figure 3
Tumor-associated macrophages shift toward inflammation during checkpoint blockade (A) UMAP of myeloid cells captured across all lesions, colored and labeled by cell type. Bar plots show cell-type proportions grouped by ICB treatment history. (B) Heatmap of scaled normalized expression for cell-type-defining genes as determined by two-sided Wilcoxon rank-sum test with Bonferroni FDR correction (q < 0.01). (C) Dotplot showing percentage of cells in each cell type expressing immune checkpoint and evasion genes. (D) Heatmap of scaled normalized expression for curated M1- and M2-associated genes within TAM subtypes. (E) Heatmap of normalized enrichment scores (NES) for gene sets significantly enriched (p < 0.05, q < 0.25) in TAM subtypes from ICB PR patients compared with ICB SD/PD patients. (F) Violin and boxplots comparing expression distributions of immune checkpoint and evasion genes between all TAM from ICB-exposed versus ICB-naive patients. Significance of differential expression (q value) was determined by two-sided Wilcoxon rank-sum test with Bonferroni FDR correction. Boxplots include centerline, median; box limits, upper and lower quartiles; and whiskers extending at most 1.5× the interquartile range past upper and lower quartiles. (G) Violin and boxplots comparing expression distributions of immune checkpoint and evasion genes between all TAM from ICB PR versus ICB SD/PD patients. Significance of differential expression (q value) was determined by two-sided Wilcoxon rank-sum test with Bonferroni FDR correction. Boxplots include centerline, median; box limits, upper and lower quartiles; and whiskers extending at most 1.5× the interquartile range past upper and lower quartiles. ∗∗∗q < 0.001, ns: not significant, two-sided Wilcoxon rank-sum test with Bonferroni FDR correction. See also Figure S4, Table S3.
Figure 4
Figure 4
Two malignant cell programs with distinct metabolic and immune-reactive characteristics are conserved across biopsy sites (A) UMAP of malignant cells captured across all lesions, colored and labeled by cluster. Bar plots show cluster proportions grouped by ICB treatment history. (B) Heatmap of scaled normalized expression for cluster-defining genes as determined by two-sided Wilcoxon rank-sum test with Bonferroni FDR correction (q < 0.01). (C) Violin and boxplots comparing single-cell signature score distributions between the two dominant malignant cell clusters, partitioned by biopsy site. Significance of differential signature enrichment (p value) was determined by two-sided Wilcoxon rank-sum test. Boxplots include centerline, median; box limits, upper and lower quartiles; and whiskers extending at most 1.5× the interquartile range past upper and lower quartiles. (D) GSEA of hallmark interferon-γ response and gene ontology antigen presentation and processing via MHC class I signatures in TP1 cells from ICB PR patients compared with ICB SD/PD patients (top) and TP2 cells from ICB PR patients compared with ICB SD/PD patients (bottom). (E) Heatmap of differential expression q values (two-sided Wilcoxon rank-sum test with Bonferroni FDR correction) for immune checkpoint and evasion genes in comparisons of cells within each cluster from ICB-exposed versus ICB-naive patients. (F) Heatmap of differential expression q values (two-sided Wilcoxon rank-sum test with Bonferroni FDR correction) for immune checkpoint and evasion genes in comparisons of cells within each cluster from ICB PR versus ICB SD/PD patients. ∗∗p < 0.01, ∗∗∗p < 0.001, two-sided Wilcoxon rank-sum test. See also Figure S5, Table S4.
Figure 5
Figure 5
Tumor program signatures are prognostic in the Checkmate 025 RCC cohort and associated with distinct genomic features (A) Kaplan-Meier analysis of overall survival (OS) in the Checkmate 025 RCC cohort, with patients separated by high and low TP1 score in bulk RNA-seq. plog-rank, log-rank test p value; pCox, p value determined via a multivariate Cox proportional hazard model using TP1 score dichotomized within treatment arm and incorporating age, sex, MSKCC risk group, prior lines of therapy (≤1 or ≥2), and days between biopsy collection and start of trial therapy as covariates. (B) Kaplan-Meier analysis of OS in the Checkmate 025 RCC cohort, with patients separated by high and low immune checkpoint/evasion score in bulk RNA-seq. plog-rank, log-rank test p value; pCox, p value determined via a multivariate Cox proportional hazard model using immune checkpoint/evasion score dichotomized within treatment arm and incorporating age, sex, MSKCC risk group, prior lines of therapy (≤1 or ≥2), and days between biopsy collection and start of trial therapy as covariates. (C) Bar plots comparing TP1 and TP2 score between mutant and wild-type samples for commonly mutated genes in the Checkmate 025 RCC cohort. Significance of differential score enrichment (q value) determined by two-sided Wilcoxon rank-sum test with Benjamini-Hochberg FDR correction. Gray dotted line corresponds to q = 0.05. (D) Bar plots comparing TP1 and TP2 score between mutant and wild-type samples for common copy number alterations in the Checkmate 025 RCC cohort. Significance of differential score enrichment (q value) determined by two-sided Wilcoxon rank-sum test with Benjamini-Hochberg FDR correction. Gray dotted line corresponds to q = 0.05. See also Figure S6, Table S5.
Figure 6
Figure 6
IFNG is associated with pro-inflammatory TAM and immune checkpoint/evasion phenotypes in the Checkmate 009 RCC cohort (A) Heatmap of cell-type-specific receptor-ligand interactions inferred by CellPhoneDB. Shown are inferred interactions between malignant cell clusters and all CD8+ T cells, malignant cell clusters and all TAMs, and all CD8+ T cells and all TAMs. Circle size indicates significance of interaction and circle color indicates mean expression of receptor and ligand genes for each pair. (B) Scatterplots of CXCL10-Hi TAM fraction (left) and ICB-exposed TAM signature score (right) versus IFNG gene expression normalized by total CD8+ T cell fraction in bulk RNA-seq of on-ICB samples in the Checkmate 009 RCC cohort. Cell-type fractions were inferred using CIBERSORTx. Pearson coefficient (R) and associated p value are reported for each correlation. (C) Scatterplots of immune checkpoint/evasion signature score versus IFNG expression normalized by total CD8+ T cell fraction (left) and immune checkpoint/evasion score versus hallmark interferon-γ response signature score (right) in bulk RNA-seq of on-ICB samples in the Checkmate 009 RCC cohort. Cell-type fractions were inferred using CIBERSORTx. Pearson coefficient (R) and associated p value are reported for each correlation. (D) Signature scores for the immune checkpoint/evasion signature and expression values for individual genes in paired pre-/on-ICB bulk RNA-seq samples in the Checkmate 009 RCC cohort. Significance of differential signature enrichment or expression (p value) was determined by paired two-sided Wilcoxon rank-sum test. Boxplots include centerline, median; box limits, upper and lower quartiles; and whiskers extending at most 1.5× the interquartile range past upper and lower quartiles.

Comment in

References

    1. Abiko K., Matsumura N., Hamanishi J., Horikawa N., Murakami R., Yamaguchi K., Yoshioka Y., Baba T., Konishi I., Mandai M. IFN- γ from lymphocytes induces PD-L1 expression and promotes progression of ovarian cancer. Br. J. Cancer. 2015;112:1501–1509. - PMC - PubMed
    1. Barkal A.A., Brewer R.E., Markovic M., Kowarsky M., Barkal S.A., Zaro B.W., Krishnan V., Hatakeyama J., Dorigo O., Barkal L.J. CD24 signalling through macrophage Siglec-10 is a new target for cancer immunotherapy. Nature. 2019;572:392–396. - PMC - PubMed
    1. Bell L.C.K., Pollara G., Pascoe M., Tomlinson G.S., Lehloenya R.J., Roe J., Meldau R., Miller R.F., Ramsay A., Chain B.M. In vivo molecular dissection of the effects of HIV-1 in active Tuberculosis. PLoS Pathog. 2016;12:e1005469. - PMC - PubMed
    1. Bellucci R., Martin A., Bommarito D., Wang K., Hansen S.H., Freeman G.J., Ritz J. Interferon-γ-induced activation of JAK1 and JAK2 suppresses tumor cell susceptibility to NK cells through upregulation of PD-L1 expression. OncoImmunology. 2015;4:e1008824. - PMC - PubMed
    1. Benjamini Y., Hochberg Y. Controlling the false discovery rate: a practical and powerful approach to multiple testing. J. R. Stat. Soc. B. 1995;57:289–300.

Publication types

MeSH terms