. 2021 Jul 1;28(7):1275-1290.e9.
doi: 10.1016/j.stem.2021.02.008. Epub 2021 Mar 11.

HectD1 controls hematopoietic stem cell regeneration by coordinating ribosome assembly and protein synthesis

Affiliations

HectD1 controls hematopoietic stem cell regeneration by coordinating ribosome assembly and protein synthesis

Kaosheng Lv et al. Cell Stem Cell. .

Abstract

Impaired ribosome function is the underlying etiology in a group of bone marrow failure syndromes called ribosomopathies. However, how ribosomes are regulated remains poorly understood, as are approaches to restore hematopoietic stem cell (HSC) function loss because of defective ribosome biogenesis. Here we reveal a role of the E3 ubiquitin ligase HectD1 in regulating HSC function via ribosome assembly and protein translation. Hectd1-deficient HSCs exhibit a striking defect in transplantation ability and ex vivo maintenance concomitant with reduced protein synthesis and growth rate under stress conditions. Mechanistically, HectD1 ubiquitinates and degrades ZNF622, an assembly factor for the ribosomal 60S subunit. Hectd1 loss leads to accumulation of ZNF622 and the anti-association factor eIF6 on 60S, resulting in 60S/40S joining defects. Importantly, Znf622 depletion in Hectd1-deficient HSCs restored ribosomal subunit joining, protein synthesis, and HSC reconstitution capacity. These findings highlight the importance of ubiquitin-coordinated ribosome assembly in HSC regeneration.

Keywords: HSC regeneration; HectD1; Polypeptide exit tunnel; ZNF622; hematopoietic stem cells; protein synthesis; ribosome assembly; ribosome biogenesis; signaling; ubiquitin.


Conflict of interest statement

Declaration of interests The authors declare no competing interests.

Figures

Figure 1.
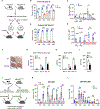
Figure 1.. Hectd1-deficient BMs display a defective reconstituting ability and reduced functional HSC frequency.
(A) Experimental scheme of serial BM transplantation assay. (B) Representative flow plots of donor/competitor/host chimerism in the peripheral blood (PB) of recipient mice after transplantation. (C) Donor chimerisms in the PB of recipient mice were measured every 4 weeks and the results are graphed. Hectd1f/f (n=11) and Hectd1f/f;Vav (n=11). (D) Lineage reconstitutions of donor-derived cells in primary recipients at 16 weeks post-transplantation are shown. Hectd1f/f (n=11) and Hectd1f/f;Vav (n=11). (E) Percentages of donor-derived HSPC subpopulation in the BM of primary transplanted mice at 16 weeks are shown. Hectd1f/f (n=6) and Hectd1f/f;Vav (n=6). (F) Donor percentages in the PB of secondary BMT recipients were analyzed every four weeks and the results are graphed. Hectd1f/f (n=10) and Hectd1f/f;Vav (n=11). (G) Experimental scheme of limiting dilution BMT to assess functional HSC frequency of Hectd1f/f and Hectd1 f/f;Vav BMs. (H) The results are presented as number of positively engrafted mice versus total number of mice analyzed for the indicated doses. Positive engraftment was defined as >1% donor-derived cells in the PB. CRU: competitive repopulating unit. 1SE: one standard deviation. (I) Donor chimerisms in the PB of recipient mice transplanted with different doses of BM cells at 16 weeks are shown. 100k: Hectd1f/f (n=5) and Hectd1f/f;Vav (n=6); 30k: Hectd1f/f (n=10) and Hectd1f/f;Vav (n=13); 10k: Hectd1f/f (n=9) and Hectd1f/f;Vav (n=7). In all relevant panels, each symbol represents an individual mouse; bars indicate mean frequencies; error bars indicate SE. *: p<0.05; **: p<0.01; ***: p<0.001; ns: not significant, as determined unpaired by two-tailed Student’s t-test. See also Figure S1, S2 and S3A–S3K.
Figure 2.
Figure 2.. HectD1 is required for HSC self-renewal in vivo and maintenance ex vivo.
(A) Experimental scheme of HSC transplantation assay. LT-HSCs (LSK CD150+CD48) from Hectd1f/f and Hectd1 f/f;Vav mice were purified by flow cytometric sorting and 100 HSCs were either injected with 500K Sca1-depleted competitor BMs into lethally irradiated recipient mice (Day0-BMT) or the resultant culture after 12 days was injected with 300K BMs into recipient mice (Day12-BMT). (B) Donor chimerisms in the PB of recipient mice transplanted with fresh HSCs (day0-BMT) were measured every 4 weeks and the results are shown in the graph. Hectd1f/f (n=8) and Hectd1f/f;Vav (n=8). (C) Percentages of donor-derived HSPC subpopulations in the BM of day0-BMT recipient mice 16 weeks post-transplant are shown. Hectd1f/f (n=6) and Hectd1f/f;Vav (n=5). (D) Donor chimerisms of day12 cultured HSC transplants (Day12-BMT) in the PB of recipient mice were measured every 4 weeks and the results are shown in the graph. Hectd1f/f (n=7) and Hectd1f/f;Vav (n=5). (E) Percentages of donor-derived HSPC subpopulations in the BM of day12-BMT recipient mice 16 weeks post-transplant are shown. Hectd1f/f (n=6) and Hectd1f/f;Vav (n=4). (F) Representative images of ex vivo cultured HSCs at day 8. (G-I) Cell numbers of ex vivo cultured HSCs at different time points in different combinations of cytokines are shown. n=3 in each group. (J) Experimental scheme of HSC versus MPP/HPC transplantation assay. HSCs (LSK CD150+CD48) or MPP/HPCs (LSK CD150CD48+) were sorted from Hectd1f/f and Hectd1 f/f;Vav mice. 500 HSCs or 5000 MPP/HPCs were transplanted into each sub-lethally irradiated recipient mice. (K-L) Donor chimerisms in the PB of recipient mice were measured by flow cytometry every week post-BMT. Donor chimerisms of HSC (K) and MPP/HPC (L) transplants are shown. Hectd1f/f (n=7–9) and Hectd1f/f;Vav (n=6–7). Data in (G-I) are represented by mean± SD. In all relevant panels, each symbol represents an individual mouse; bars indicate mean frequencies; error bars indicate SE. *: p<0.05; **: p<0.01; ***: p<0.001, as determined by unpaired two-tailed Student’s t-test. See also Figure S3L–S3M.
Figure 3.
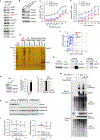
Figure 3.. HectD1 interacts with, ubiquitinates, and degrades ZNF622.
(A) Freshly purified LSKs from Hectd1f/f and Hectd1 f/f;Vav mice were used to examine various signaling molecules by WB using the indicated antibodies. (B) TF-1/hMPL cells stably depleted of HECTD1 using two different shRNAs were generated along with shRNA to Luciferase (Luc). Cell lysates were subjected to WB analysis using indicated antibodies. (C, D) TF-1/hMPL shLuc or shHECTD1 cells were cultured in triplicates in different concentrations of GM-CSF (D) or TPO (D). Cell growth after 3 days’ culture were determined by MTT absorbance. (E) Silver staining gel image of a representative large-scale protein purification result to evaluate the efficiency and specificity of affinity purification of HA-HectD1 interacting proteins. * indicates the HA-HectD1 bait. IgG-H: indicates the Immunoglobin heavy chain. (F) CRAPome analysis of Hectd1-intearacting proteins from three independent IP-MS results revealed the SAINT probability over fold changes. ZNF622 was identified as an Hectd1 interactor and highlighted in red. (G) co-IP/WB analysis confirmed the interaction between Flag-ZNF622 and endogenous HectD1 in Flag-ZNF622 reconstituted TF-1 cells. (H) ZNF622 protein levels were increased in Hectd1 f/f;Vav LSKs compared to that of Hectd1f/f LSKs. (I) Quantification of ZNF622 protein levels from three independent experiments as in (H) is plotted. (J) ZNF622 mRNA levels were not affected in Hectd1-deficient LSKs as shown by qRT-PCR analysis. n=3 in each group. (K) TF-1 cells stably depleted of HECTD1 using two different shRNAs were treated with cycloheximide (CHX) for indicated times. ZNF622 half-lives were determined by WB. Representative blots of 3 independent experiments are shown. S.E., short exposure; L.E., long exposure. (L) Relative ZNF622 levels normalized to Luc time 0 (left panel) and that normalized to respective time 0 (right panel) as shown in (J). (M) 293T cells were transfected with HA-HectD1 or E3-dead mutant HectD1, along with Flag-ZNF622 and His-Ub or Ub mutant constructs as indicated. Cells were subjected to lysis in denatured condition followed by Ni2+ beads-pulldown. Ubiquitinated proteins were detected by WB using indicated antibodies. In all relevant panels, data are represented by mean± SD. p-values are determined by unpaired two-tailed Students’ t-test. *: p<0.05; **: p<0.01; ***: p<0.001 See also Figure S4.
Figure 4.
Figure 4.. Hectd1 deficiency reduces HSC frequency and protein translational rate upon proliferative stress
(A-D) Hectd1 f/f and Hectd1 f/f;Vav mice were injected with 150mg/kg 5-FU, and euthanized at 10 days later for subsequent analysis. (A) HSC and MPP numbers in the BM of 5-FU challenged Hectd1 f/f (n=8) and Hectd1 f/f;Vav (n=8) mice are shown. (B) Representative histogram plot of protein synthesis rate in BM HSCs of 5-FU challenged mice as determined by in vivo OP-Puro assay. (C) Quantification of protein synthesis rate in HSCs and MPPs of 5-FU challenged Hectd1 f/f (n=6) and Hectd1 f/f;Vav (n=5) mice as shown in (B). (D) Percentages of BM HSCs and MPPs in the S phase of the cell cycle as determined by in vivo BrdU assay. Hectd1f/f (n=3) and Hectd1 f/f;Vav (n=3). (E-H) Hectd1 f/f and Hectd1 f/f;Vav mice were injected with cyclophosphamide (Cy) followed by two consecutive daily injections of G-CSF. Mice were euthanized one day after the last injection for subsequent analysis. (E) HSC and MPP numbers in the BM of Cy+2GCSF challenged Hectd1 f/f (n=7) and Hectd1 f/f;Vav (n=7)mice. Data are pooled from 4 independent experiments and unique symbols indicate mice from different experiments. (F) Representative histogram plot of protein synthesis rate in BM HSCs of Hectd1 f/f and Hectd1 f/f;Vav mice as determined by in vivo OP-Puro assay. (G) Quantification of protein synthesis rate in HSCs and MPPs of Hectd1f/f (n=4) and Hectd1 f/f;Vav (n=4) mice as shown in (F). (H) Percentages of BM HSCs and MPPs in the S phase of the cell cycle as determined by in vivo BrdU assay. Hectd1f/f (n=3) and Hectd1 f/f;Vav (n=4). (I) Protein synthesis rates of 2-day cultured LSKs from Hectd1f/f and Hectd1 f/f;Vav mice were determined by OP-puro incorporation of newly synthesized protein after 1hr labelling. Representative histogram plot is shown. (J) Quantification of relative protein synthesis rates of 2-day cultured LSKs from three independent experiments using OP-Puro assays as shown in (I). (K) Relative CFU-GM progenitors from Hectd1f/f (n=3) and Hectd1 f/f;Vav (n=3) BMs in the presence of various concentrations of the translation elongation inhibitor puromycin is shown. Data in (A, C, D, E, G and H) are represented by mean± SE. Data in (J, and K) are represented by mean± SD. p-value in (E) is determined by paired two-tailed Students’ t-test; p-values in other panels are determined by unpaired two-tailed Students’ t-test. *: p<0.05; **: p<0.01; ***: p<0.001; ns, not significant. See also Figure S5.
Figure 5.
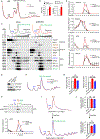
Figure 5.. Hectd1 deficiency results in an accumulation of ZNF622 and eIF6 in the 60S and a reduction in ribosomal subunit joining, which is restored by ZNF622 depletion.
(A) Polysome profiling analysis of 2 day-cultured LSKs from Hectd1f/f and Hectd1 f/f;Vav mice. (B) Quantifications of 60S:40S ratio (left panel) and 60S:80S ratio (right panel) from polysome profiling assay of TF-1 cells expressing shLuc or shHECTD1. Three independent experiments were performed. (C) Fractions from sucrose gradients (7%−45%) of TF-1 cell lysates stably expressing shLuc or shHECTD1 were collected and subjected to WB analysis. Representative result of three independent experiments is shown. Fractions 1–3 are cytoplasmic soluble proteins. 40S, 60S, 80S monosome and polysome fractions are indicated by colored lines, arrows, and fonts. Whole cell lysate (WCL). AF: assembly factor; RPL: ribosome protein large unit; RPS: ribosome protein small unit. WCL and sucrose fractions (shLuc and shHECTD1) were resolved in three SDS-PAGE gels in parallel. Sucrose fraction immunoblots were processed and developed in parallel, and images presented side-by-side. (D) Quantification of relative protein distribution in different polysome fractions as shown in (C). Relative protein levels in each fraction was normalized to the peak fraction of the indicated protein from the shLuc cells and plotted. n=3–4. (E-J) Knockdown of ZNF622 in HECTD1-deficient cells rescues ribosome composition, eIF6 release, as well as 60S/40S joining. (E) WB examination of knockdown efficiency in shLuc, HECTD1 single and HECTD1;ZNF622 double knockdown (DKD) cells. (F) Representative polysome profiles of TF-1 shLuc, HECTD1 and DKD cells. (G) Quantifications of 60S:40S ratio (left panel) and 60S:80S ratio (right panel) of polysome profiles as shown in (F). n=3. (H) Representative result of WB analysis with protein fractions from sucrose gradients (7%−45%) of TF-1 shLuc, HECTD1 and DKD cells (top panel). Quantification of eIF6 distribution in polysome fractions (bottom panel). N=3. (I) Ribosome dissociation/reassociation assay. Indicated TF-1 cell lines were lysed in 0.25mM low Mg2+ buffer to dissociate ribosomal subunits (Top graph). MgCl2 was subsequently added to a final concentration of 10mM for ribosomal subunit reassociation (Bottom graph). Resultant cell lysates were loaded on a 7–45% sucrose gradient profiled. Representative graphs from three independent experiments are shown. (J) Quantification of 60S:40S ratios in the dissociated profiles (Top panel) and 80S:40S ratios in the reassociated profiles (Bottom panel). N=3. Note that the black line (shLuc) and the blue line (DKD) in (F, H and I) superimpose. All data are represented by mean± SD. p-values are determined by unpaired two-tailed Students’ t-test. *: p<0.05; **: p<0.01; ***: p<0.001; ns, not significant. See also Figure S6A–S6F.
Figure 6.
Figure 6.. Knockdown of Znf622 in Hectd1-deficient cells restores protein synthesis rate and HSC reconstitution ability.
(A) TF-1 cells stably expressing control shLuc, single or double knockdown of HECTD1 and ZNF622 were generated by lentiviral infection and sorting. WB analysis with indicated antibodies is shown. (B) Global protein synthesis rates of various TF-1 cells as in (A) were measured using OP-Puro assay. (C) Knockdown efficiency of 3 different shRNAs to mouse Znf622 in BaF3 cells is shown. shRNA #1 and #2 are chosen for subsequent BMT. (D) Schematic illustration of HSC lentiviral transduction/BMT strategy. (E) mCherry+ donor fractions in the PB were analyzed every 4 weeks post-BMT. Quantifications of mCherry+ % within donor from each group are shown. f/f;Vav+shLuc, n=5; f/f;Vav+shZnf622#1, n=6; f/f;Vav+shZnf622#2, n=5. (F) Quantifications of mCherry+ donor% in the HSC and MPP fractions 16-weeks post BMT are shown. f/f;Vav+shLuc, n=5; f/f;Vav+shZnf622#1, n=3; f/f;Vav+shZnf622#2, n=4. (G) In a separate experiment, LSK cells were purified from Hectd1f/f and Hectd1 f/f;Vav mice, infected with lentivirus expressing shLuc or shZnf622#1, and subsequently transplanted. Quantifications of mCherry+ donor% in the PB from each group are shown. f/f +shLuc, n=8; f/f+shZnf622#1, n=8; f/f;Vav+shLuc, n=7; f/f;Vav+shZnf622#1, n=7. (H) Quantifications of mCherry+ donor percentages in the HSC and MPP fractions at the end of primary BMT are shown. f/f +shLuc, n=8; f/f+shZnf622#1, n=8; f/f;Vav+shLuc, n=7; f/f;Vav+shZnf622#1, n=7. (I) Two million BM cells from primary transplanted mice were harvested and transplanted into each secondary recipient. Quantifications of mCherry+ % within donor from each group in the secondary transplants are shown. f/f +shLuc, n=16; f/f+shZnf622#1, n=13; f/f;Vav+shLuc, n=14; f/f;Vav+shZnf622#1, n=9. In all relevant experiments, each symbol represents an individual mouse; horizontal lines indicate mean frequencies; error bars indicate SE. *: p<0.05; **: p<0.01; ***: p<0.001; ns, not significant, as determined by unpaired two-tailed Student’s t-test. See also Figure S6G.

Comment in

References

    1. Aleidi SM, Yang A, Sharpe LJ, Rao G, Cochran BJ, Rye KA, Kockx M, Brown AJ, and Gelissen IC (2018). The E3 ubiquitin ligase, HECTD1, is involved in ABCA1-mediated cholesterol export from macrophages. Biochim Biophys Acta Mol Cell Biol Lipids 1863, 359–368. - PubMed
    1. Balcerek J, Jiang J, Li Y, Jiang Q, Holdreith N, Singh B, Chandra V, Lv K, Ren JG, Rozenova K, et al. (2018). Lnk/Sh2b3 deficiency restores hematopoietic stem cell function and genome integrity in Fancd2 deficient Fanconi anemia. Nat Commun 9, 3915. - PMC - PubMed
    1. Barilari M, Bonfils G, Treins C, Koka V, De Villeneuve D, Fabrega S, and Pende M (2017). ZRF1 is a novel S6 kinase substrate that drives the senescence programme. EMBO J 36, 736–750. - PMC - PubMed
    1. Bersenev A, Wu C, Balcerek J, and Tong W (2008). Lnk controls mouse hematopoietic stem cell self-renewal and quiescence through direct interactions with JAK2. J Clin Invest 118, 2832–2844. - PMC - PubMed
    1. Boocock GR, Morrison JA, Popovic M, Richards N, Ellis L, Durie PR, and Rommens JM (2003). Mutations in SBDS are associated with Shwachman-Diamond syndrome. Nat Genet 33, 97–101. - PubMed

Publication types

MeSH terms