. 2021:62:100066.
doi: 10.1016/j.jlr.2021.100066. Epub 2021 Mar 10.

Simvastatin inhibits POVPC-mediated induction of endothelial-to-mesenchymal cell transition

Affiliations

Simvastatin inhibits POVPC-mediated induction of endothelial-to-mesenchymal cell transition

Yan Li et al. J Lipid Res. 2021.

Abstract

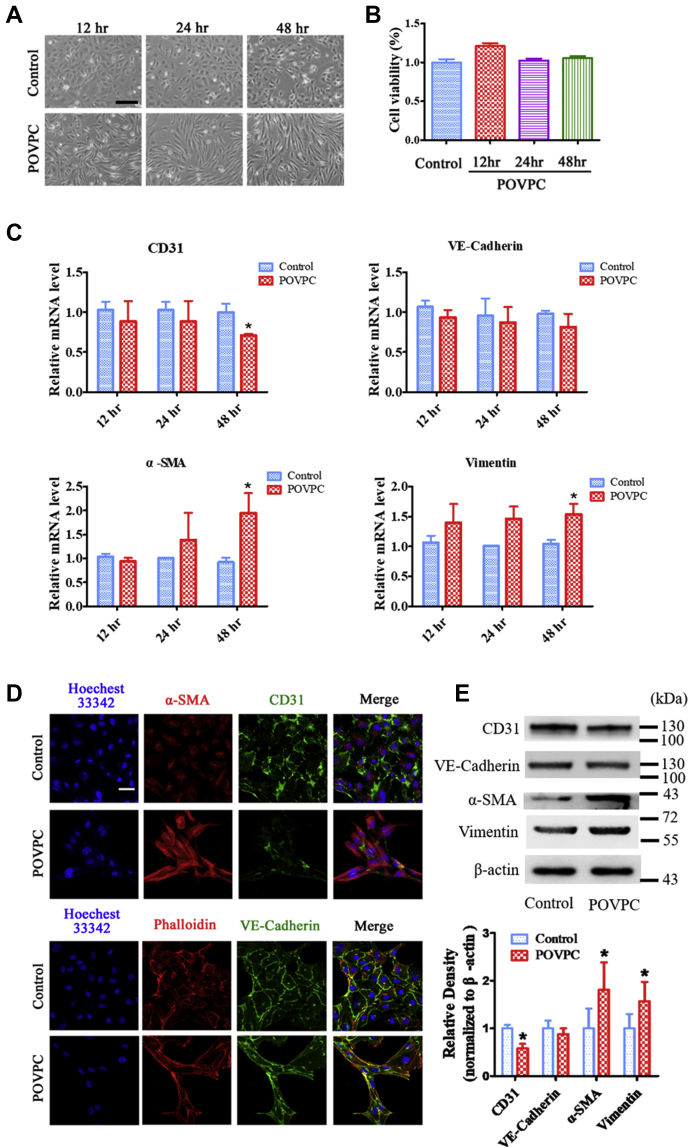
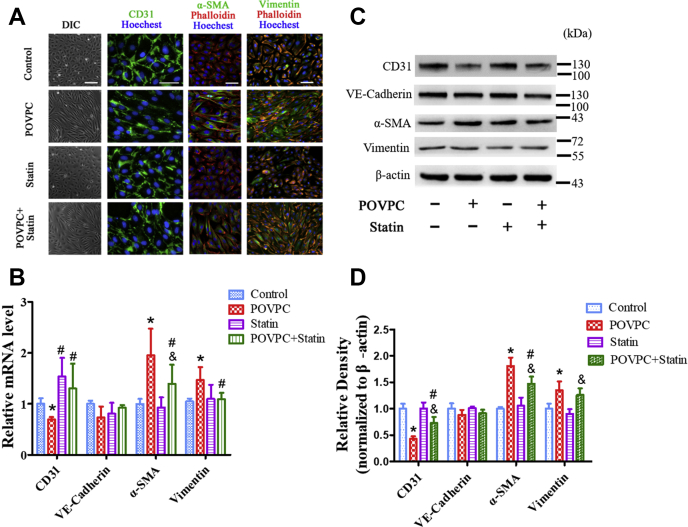
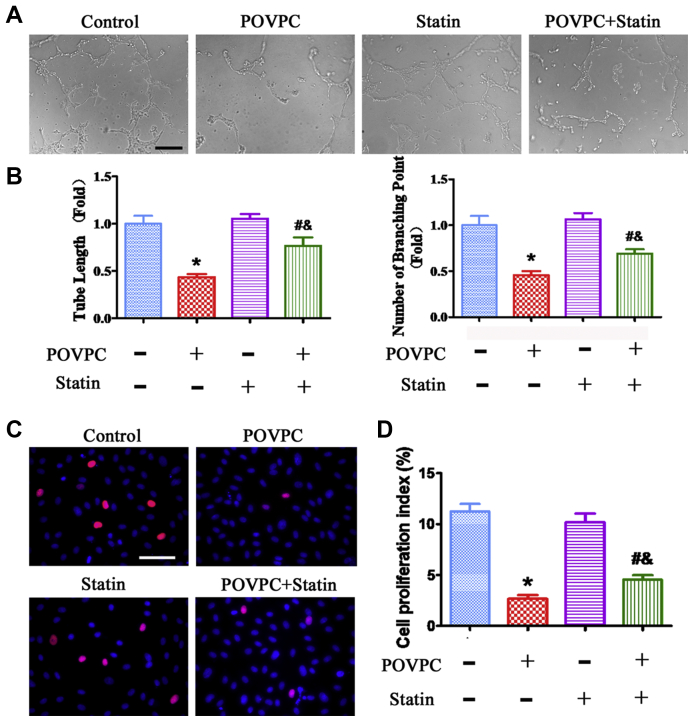
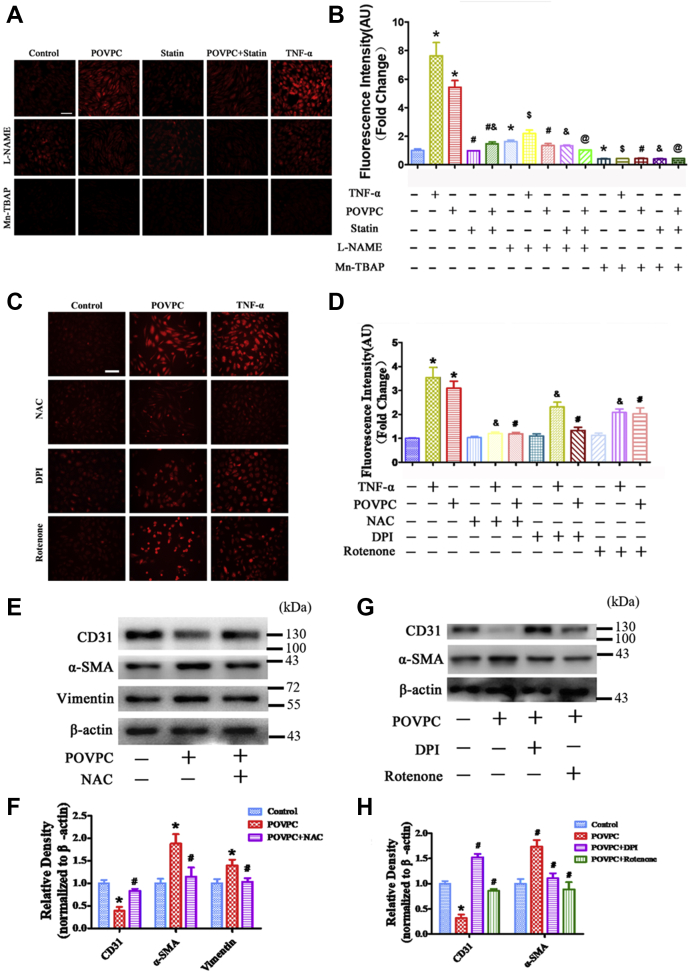
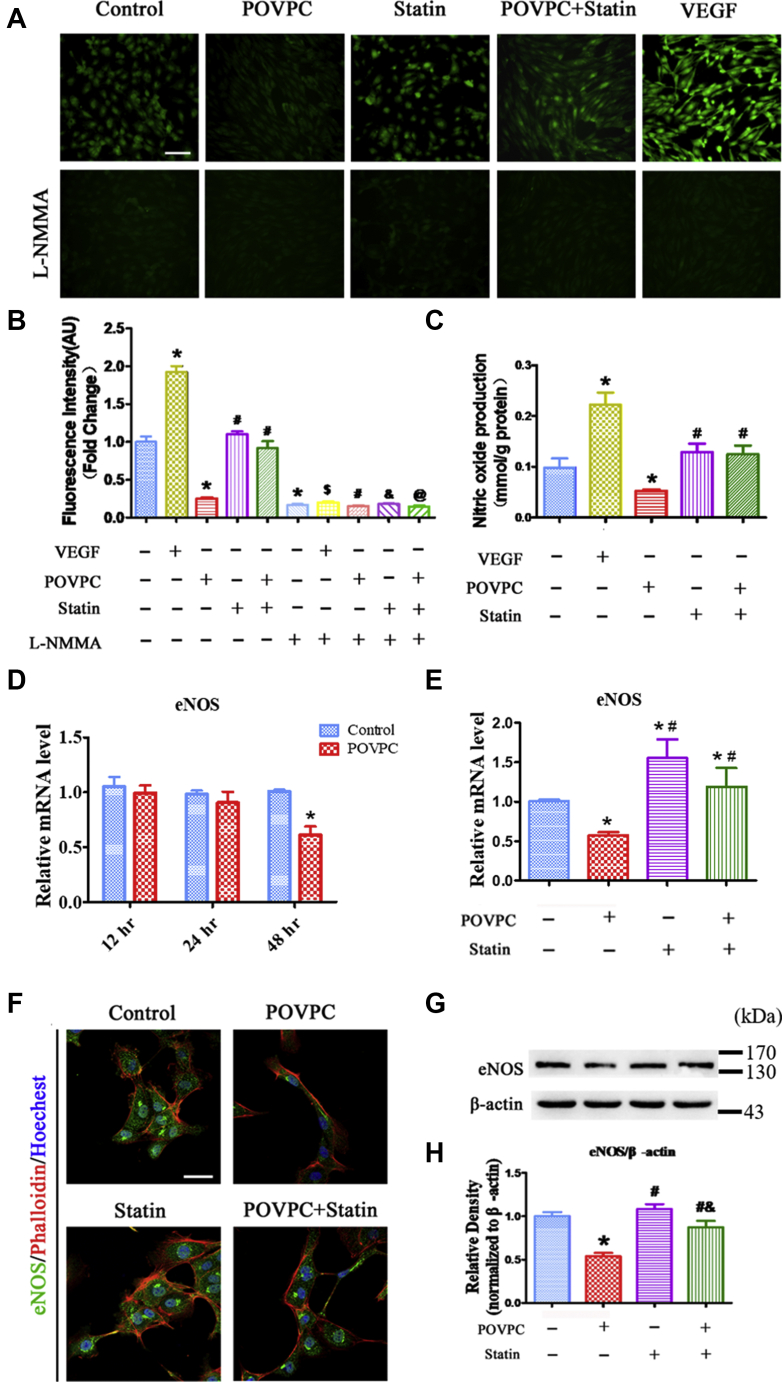
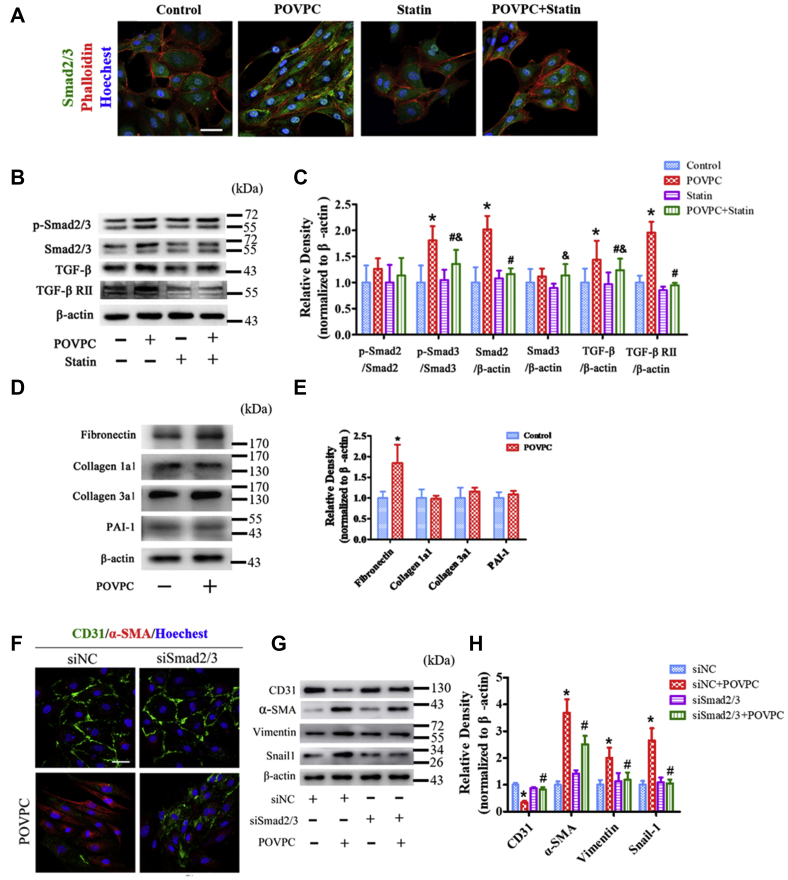
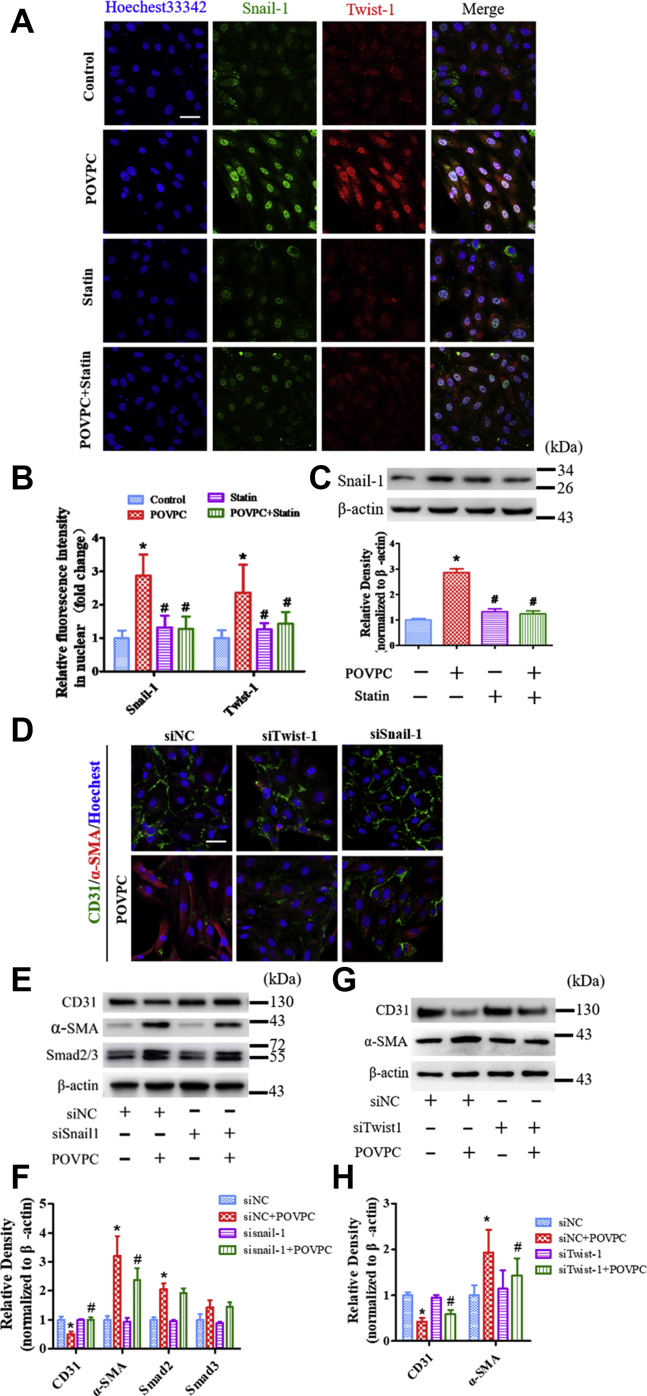
Endothelial-to-mesenchymal transition (EndMT), the process by which an endothelial cell (EC) undergoes a series of molecular events that result in a mesenchymal cell phenotype, plays an important role in atherosclerosis. 1-Palmitoyl-2-(5-oxovaleroyl)-sn-glycero-3-phosphocholine (POVPC), derived from the oxidation of 1-palmitoyl-2-arachidonoyl-sn-glycero-3-phosphatidylcholine, is a proinflammatory lipid found in atherosclerotic lesions. Whether POVPC promotes EndMT and how simvastatin influences POVPC-mediated EndMT remains unclear. Here, we treated human umbilical vein ECs with POVPC, simvastatin, or both, and determined their effect on EC viability, morphology, tube formation, proliferation, and generation of NO and superoxide anion (O2•-). Expression of specific endothelial and mesenchymal markers was detected by immunofluorescence and immunoblotting. POVPC did not affect EC viability but altered cellular morphology from cobblestone-like ECs to a spindle-like mesenchymal cell morphology. POVPC increased O2- generation and expression of alpha-smooth muscle actin, vimentin, Snail-1, Twist-1, transforming growth factor-beta (TGF-β), TGF-β receptor II, p-Smad2/3, and Smad2/3. POVPC also decreased NO production and expression of CD31 and endothelial NO synthase. Simvastatin inhibited POVPC-mediated effects on cellular morphology, production of O2•- and NO, and expression of specific endothelial and mesenchymal markers. These data demonstrate that POVPC induces EndMT by increasing oxidative stress, which stimulates TGF-β/Smad signaling, leading to Snail-1 and Twist-1 activation. Simvastatin inhibited POVPC-induced EndMT by decreasing oxidative stress, suppressing TGF-β/Smad signaling, and inactivating Snail-1 and Twist-1. Our findings reveal a novel mechanism of atherosclerosis that can be inhibited by simvastatin.

Keywords: CVD; LDL; NO; atherosclerosis; cell biology; endothelial cells; oxidized lipids; signal transduction; superoxide anion; vascular biology.


Conflict of interest statement

Conflict of interest The authors declare that they have no conflicts of interest with the contents of this article.

Figures

Fig. 1
Fig. 1
POVPC induces EndMT in cultured HUVECs. A: Representative light microscopic images showing cells with typical cobblestone morphology in control versus cells with a fibroblast-like phenotype in cultured HUVECs following exposure to POVPC for 12, 24, and 48 h. B: POVPC did not inhibit HUVEC survival rate. C: qRT-PCR showing the intracellular mRNA levels of CD31, VE-cadherin, α-SMA, and VIM (vimentin) after pretreated with POVPC for 12, 24, and 48 h in cultured HUVECs. D: Immunofluorescence microscopy shows a decrease in the fluorescent intensity of CD31 (green) and an increase in fluorescent intensity of α-SMA (red) after treatment of cultured HUVECs with POVPC for 48 h. There was no significant change in the fluorescent intensity of VE-cadherin (green). F-actin was stained with phalloidin (red). Nuclei were stained with Hoechst 33342 (blue). E: Western blots and bar charts showing the protein levels of CD31, VE-cadherin, α-SMA, and vimentin after pretreatment of cultured HUVECs with POVPC for 48 h (∗vs. corresponding control group; P < 0.05, n = 8). The scale bars represent 100 μm in A and 30 μm in D.
Fig. 2
Fig. 2
Simvastatin inhibited POVPC-induced EndMT in cultured HUVECs. A: HUVECs were analyzed by immunofluorescence for the expression of CD31 (green), α-SMA (green), and vimentin (green) after pretreatment with POVPC with or without simvastatin. F-actin was stained with phalloidin (red). The nuclei were stained with Hoechst 33342 (blue). B: qRT-PCR showing the intracellular mRNA levels of CD31, VE-cadherin, α-SMA, and VIM (vimentin) after pretreated with POVPC and/or simvastatin for 48 h in cultured HUVECs. C and D: The relative protein levels of CD31, VE-cadherin, α-SMA, and vimentin cultured HUVECs were assessed using Western blotting (∗ vs. corresponding control group; #vs. POVPC group, & vs. statin group; P < 0.05, n = 8). The scale bars represent 100 μm in A.
Fig. 3
Fig. 3
Effects of POVPC and simvastatin on EC tube formation and proliferation. A: EC tube formation was photographed using a microscope after pretreatment with POVPC and simvastatin. B: Quantitative analysis of EC tube formation. C: EdU assay showing EC proliferation after pretreatment with POVPC and simvastatin. D: Analysis of percentages of EdU-positive cells (∗ vs. corresponding control group; # vs. POVPC group; & vs. statin group; P < 0.05, n = 8). The scale bars represent 200 μm in A and 100 μm in C.
Fig. 4
Fig. 4
Effects of POVPC and simvastatin on superoxide anion (O2•−) production in cultured HUVECs. A and B: Intracellular levels of O2•− were detected using DHE after pretreatment of cultured HUVECs with POVPC with or without simvastatin. Only a small amount of O2•− was found in the control group (TNF-α treatment served as a positive control). POVPC treatment significantly increased O2•− generation. Mn-TBAP blocked the O2•− generation in both the TNF-α and POVPC groups. Simvastatin partly reduced O2•− generation induced by POVPC. L-NAME significantly reduced O2•− generation induced by POVPC and partially inhibited O2•− generation stimulated by TNF-α. C and D: Intracellular levels of O2•− was detected by DHE after pretreatment with NAC, DPI, and rotenone in cultured HUVECs. E and F: The Western blots and bar chart show the levels of CD31, α-SMA, and vimentin expression after NAC pretreated HUVECs. G and H: The Western blots and bar chart show the levels of CD31 and α-SMA expression after pretreated with DPI and rotenone in cultured HUVECs. (∗vs. control group; #vs. POVPC group; &vs. statin group; $vs. TNF-α group; @vs. POVPC + statin group; P < 0.05, n = 8). The scale bars represent 100 μm in A and C.
Fig. 5
Fig. 5
Effects of POVPC and simvastatin on NO production and eNOS expression in cultured HUVECs. A and B: Intracellular levels of NO were detected by DAF-2DA fluorescence after pretreatment of cultured HUVECs with POVPC with or without simvastatin. Some NO staining is visible in the control group. VEGF significantly increased NO production. POVPC reduced NO production. Simvastatin did not affect NO production but inhibited POVPC-reduced NO production. L-NMMA treatment blocked NO production in all groups. C: Bar chart showing that POVPC markedly inhibited NO production in HUVECs using Sievers NOA analyzer methods. D: qRT-PCR showing the intracellular mRNA levels of eNOS after pretreated with POVPC for 12, 24, and 48 h in cultured HUVECs. E: qRT-PCR showing the intracellular mRNA levels of eNOS after pretreated with POVPC and/or simvastatin for 48 h in cultured HUVECs. F: HUVECs were analyzed by immunofluorescence for the expression of eNOS (green) after pretreatment with POVPC with or without simvastatin. F-actin was stained with phalloidin (red). The nuclei were stained with Hoechst 33342 (blue). G and H: Western blots and bar charts showing eNOS levels after pretreatment of the cultured HUVECs with POVPC with or without simvastatin (∗vs. control group; #vs. POVPC group; &vs. statin group; $vs. VEGF group; @vs. POVPC + statin group; P < 0.05, n = 8). The scale bars represent 100 μm in A and 50 μm in F.
Fig. 6
Fig. 6
Effects of POVPC and simvastatin on the TGF-β/Smad pathway in cultured HUVECs. A: HUVECs were analyzed by immunofluorescence for the expression of Smad2/3 (green) after pretreatment with POVPC with or without simvastatin. F-actin was stained with phalloidin (red). The nuclei were stained with Hoechst 33342 (blue). B and C: Western blots and bar charts showing the levels of p-Smad2, p-Smad3, Smad2, Smad3, TGF-β, and TGF-β receptor II (TGF-βRII) after pretreatment of cultured HUVECs with POVPC with or without simvastatin. D and E: The relative protein levels of fibronectin, collagen 1a1, collagen3a1, and plasminogen-activated inhibitor-1 (PAI-1) were assessed by Western blots in cultured HUVECs. F: Immunofluorescence analyzed the expression of CD31 and α-SMA in HUVECs after knockdown of SMAD2/3 (siSmad2/3). G and H: The Wwestern blots and bar chart show the levels of CD31, α-SMA, vimentin and Snail-1 expression after knockdown SMAD2/3 (siSmad2/3) (∗ versus control group; #vs. POVPC group; &vs. statin group; P < 0.05; n = 8). Scale bars represent 50 μm in A and F.
Fig. 7
Fig. 7
Effects of POVPC and simvastatin on Snail-1 and Twist-1 expression in cultured HUVECs. A: HUVECs were analyzed by immunofluorescence for the expression of Snail-1 and Twist-1 after pretreatment with POVPC with or without simvastatin. B: Snail-1 nuclear localization was quantified by relative fluorescence intensity. C: The Western blots and bar charts showing the level of Snail-1 expression after pretreatment of cultured HUVECs with POVPC with or without simvastatin. D: Immunofluorescence analyzed the expression of CD31 and α-SMA in HUVECs after knockdown of SNAIL-1 and TWIST-1 (siSnail-1 and siTwist-1). E and F: The Western blots and bar chart show the levels of CD31, α-SMA, and Smad2/3 expression after knockdown of SNAIL-1 (siSnail-1). G and H: The Western blots and bar chart show the levels of CD31 and α-SMA expression after knockdown of TWIST-1 (siTwist-1) (∗vs. control group; #vs. POVPC group; P < 0.05, n = 8). The scale bars represent 50 μm in A and D.

Similar articles

Cited by

References

    1. Nguyen M.T., Fernando S., Schwarz N., Tan J.T., Bursill C.A., Psaltis P.J. Inflammation as a therapeutic target in atherosclerosis. J. Clin. Med. 2019;8:1109. - PMC - PubMed
    1. Nazarian-Samani Z., Sewell R.D.E., Rafieian-Kopaei M. Inflammasome signaling and other factors implicated in atherosclerosis development and progression. Curr. Pharm. Des. 2020;26:2583–2590. - PubMed
    1. Gimbrone M.A., Jr., Garcia-Cardena G. Endothelial cell dysfunction and the pathobiology of atherosclerosis. Circ. Res. 2016;118:620–636. - PMC - PubMed
    1. Piera-Velazquez S., Mendoza F.A., Jimenez S.A. Endothelial to mesenchymal transition (EndoMT) in the pathogenesis of human fibrotic diseases. J. Clin. Med. 2016;5:45. - PMC - PubMed
    1. Ranchoux B., Antigny F., Rucker-Martin C., Hautefort A., Pechoux C., Bogaard H.J., Dorfmuller P., Remy S., Lecerf F., Plante S., Chat S., Fadel E., Houssaini A., Anegon I., Adnot S. Endothelial-to-mesenchymal transition in pulmonary hypertension. Circulation. 2015;131:1006–1018. - PubMed

MeSH terms

Substances

LinkOut - more resources