. 2021 Mar 12;22(1):180.
doi: 10.1186/s12864-021-07495-4.

Strain-based and sex-biased differences in adrenal and pancreatic gene expression between KK/HlJ and C57BL/6 J mice

Affiliations

Strain-based and sex-biased differences in adrenal and pancreatic gene expression between KK/HlJ and C57BL/6 J mice

Angela Inglis et al. BMC Genomics. .

Abstract

Background: The ever-increasing prevalence of diabetes and associated comorbidities serves to highlight the necessity of biologically relevant small-animal models to investigate its etiology, pathology and treatment. Although the C57BL/6 J model is amongst the most widely used mouse model due to its susceptibility to diet-induced obesity (DIO), there are a number of limitations namely [1] that unambiguous fasting hyperglycemia can only be achieved via dietary manipulation and/or chemical ablation of the pancreatic beta cells. [2] Heterogeneity in the obesogenic effects of hypercaloric feeding has been noted, together with sex-dependent differences, with males being more responsive. The KK mouse strain has been used to study aspects of the metabolic syndrome and prediabetes. We recently conducted a study which characterized the differences in male and female glucocentric parameters between the KK/HlJ and C57BL/6 J strains as well as diabetes-related behavioral differences (Inglis et al. 2019). In the present study, we further characterize these models by examining strain- and sex-dependent differences in pancreatic and adrenal gene expression using Affymetrix microarray together with endocrine-associated serum analysis.

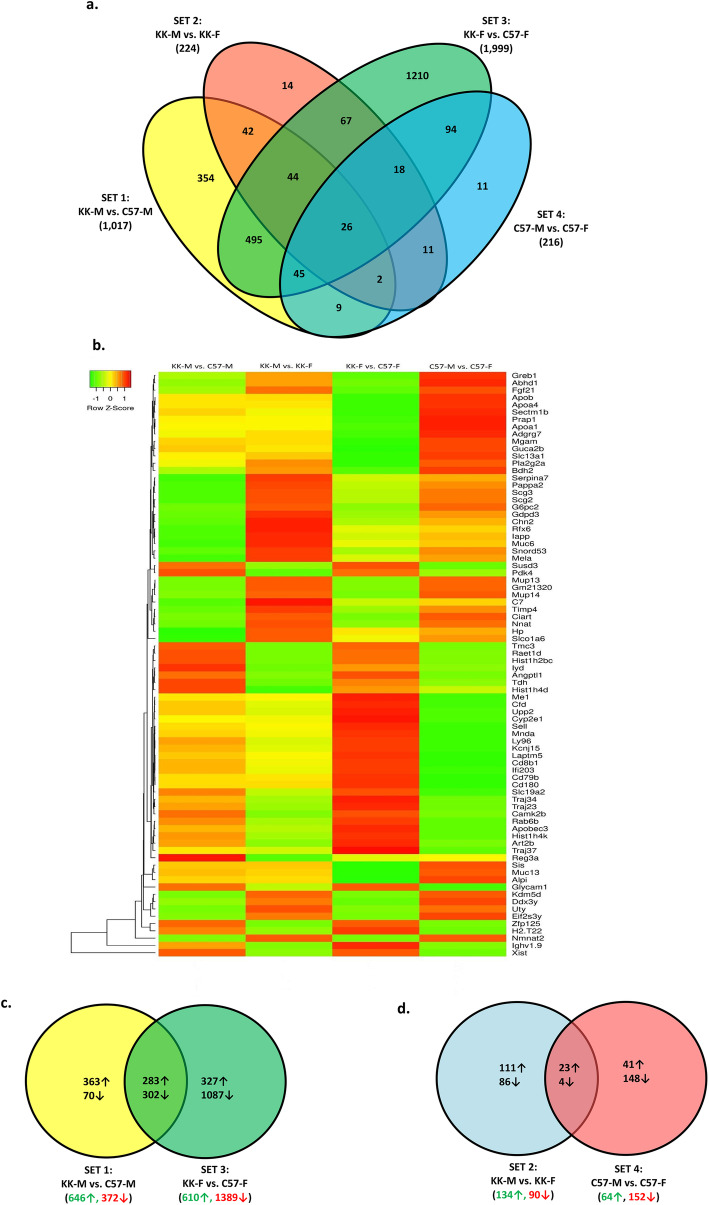
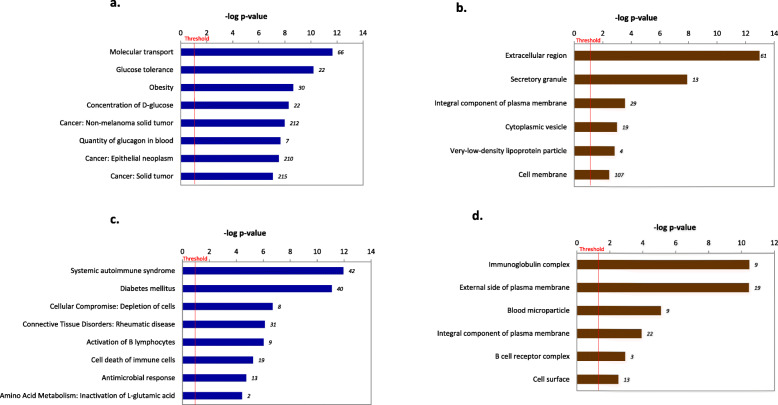
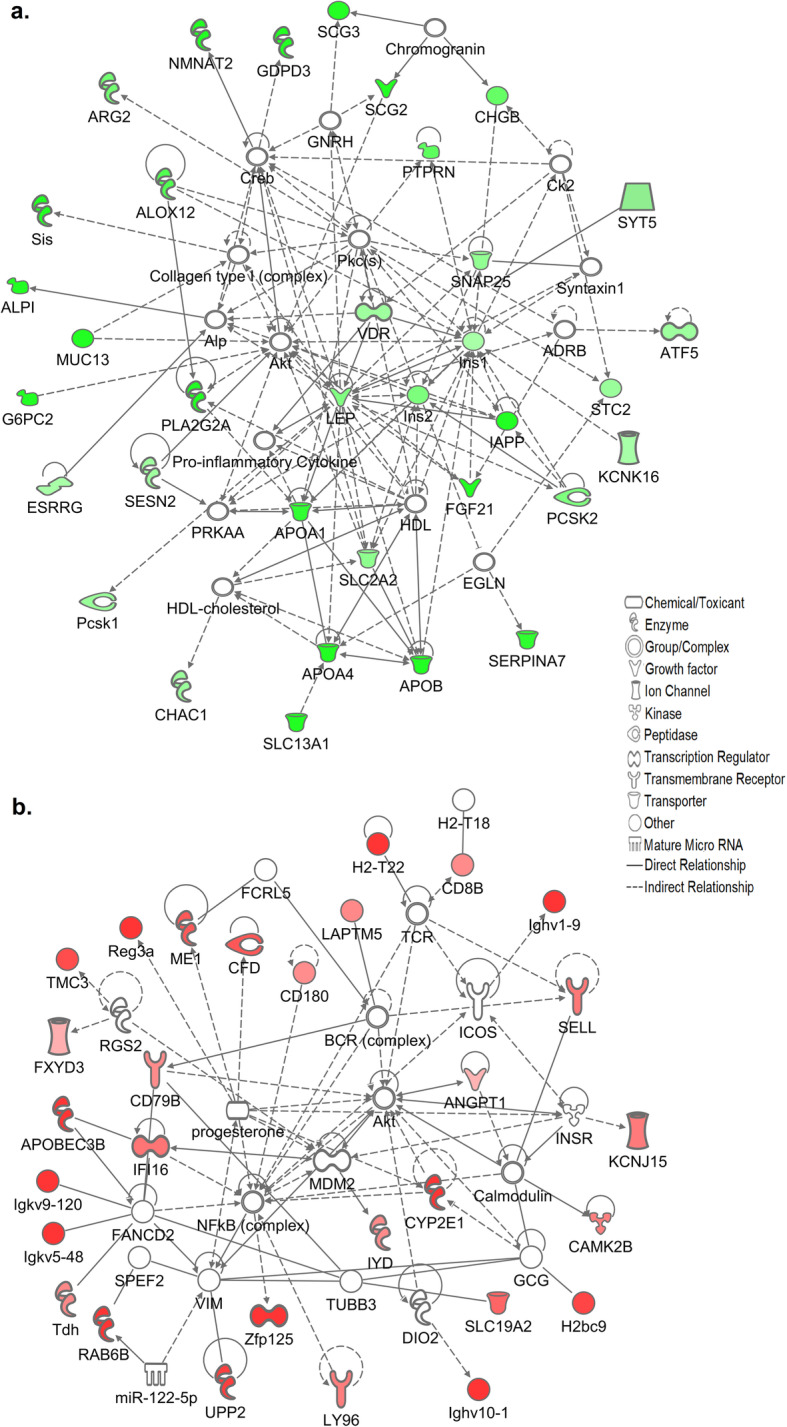
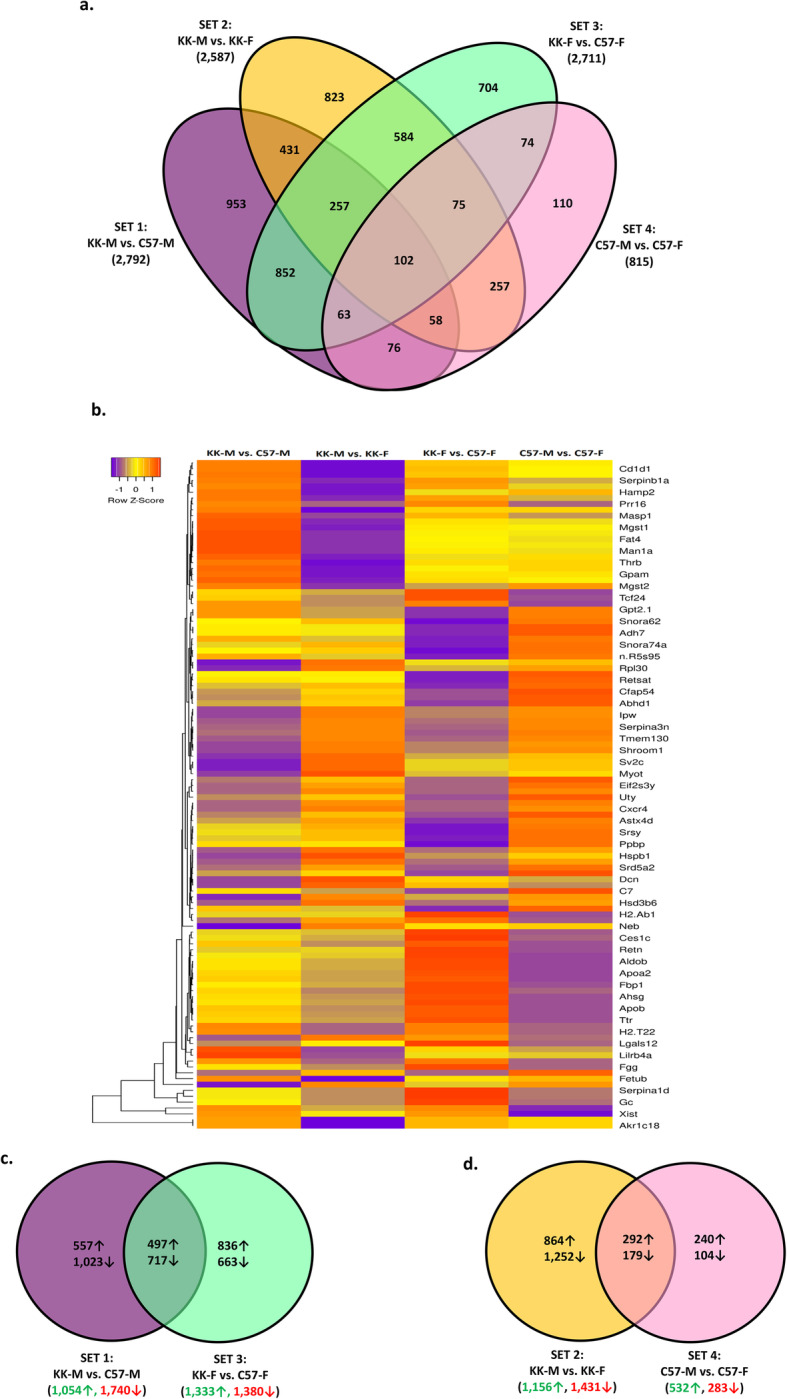
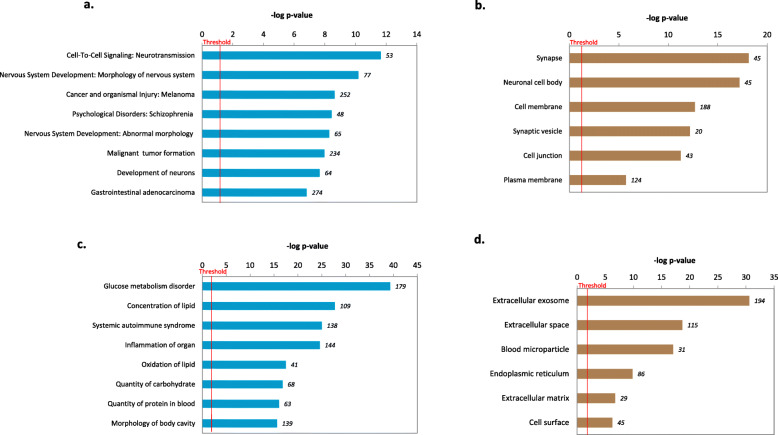
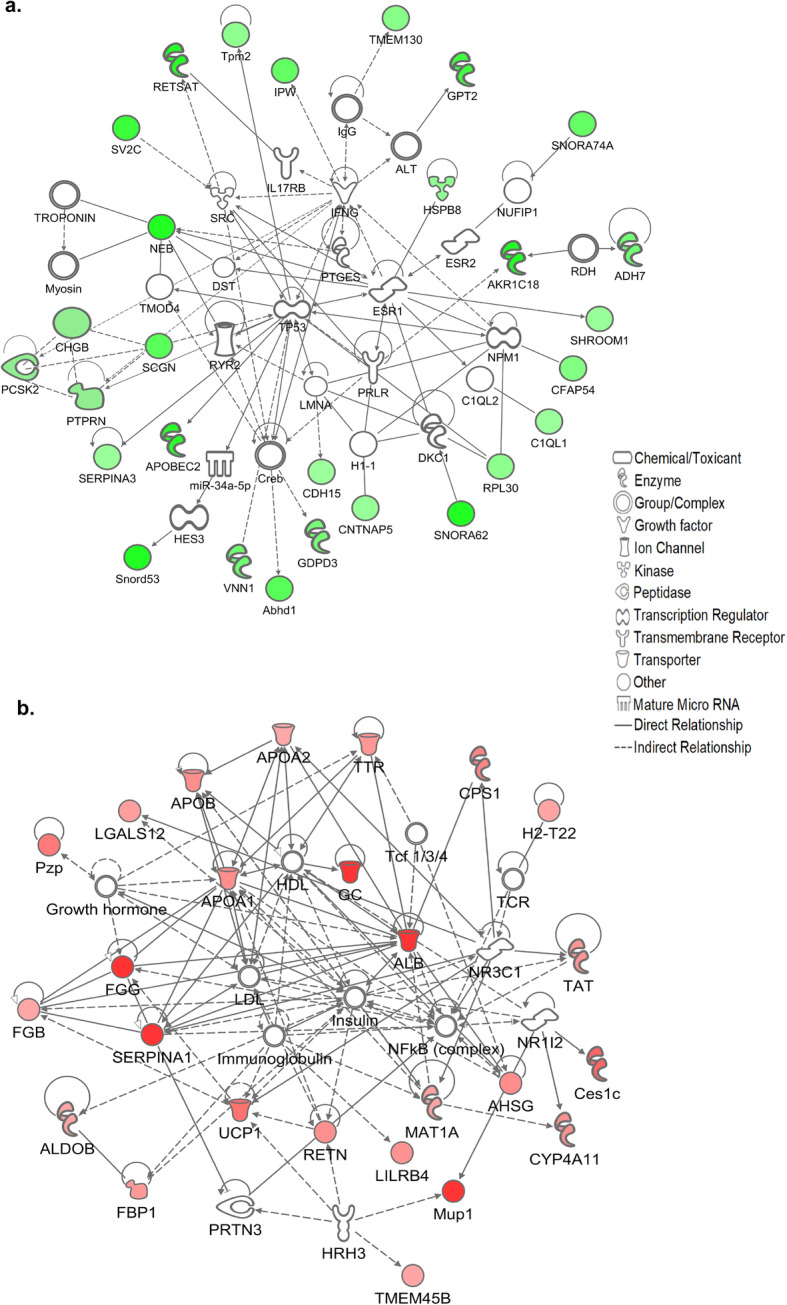
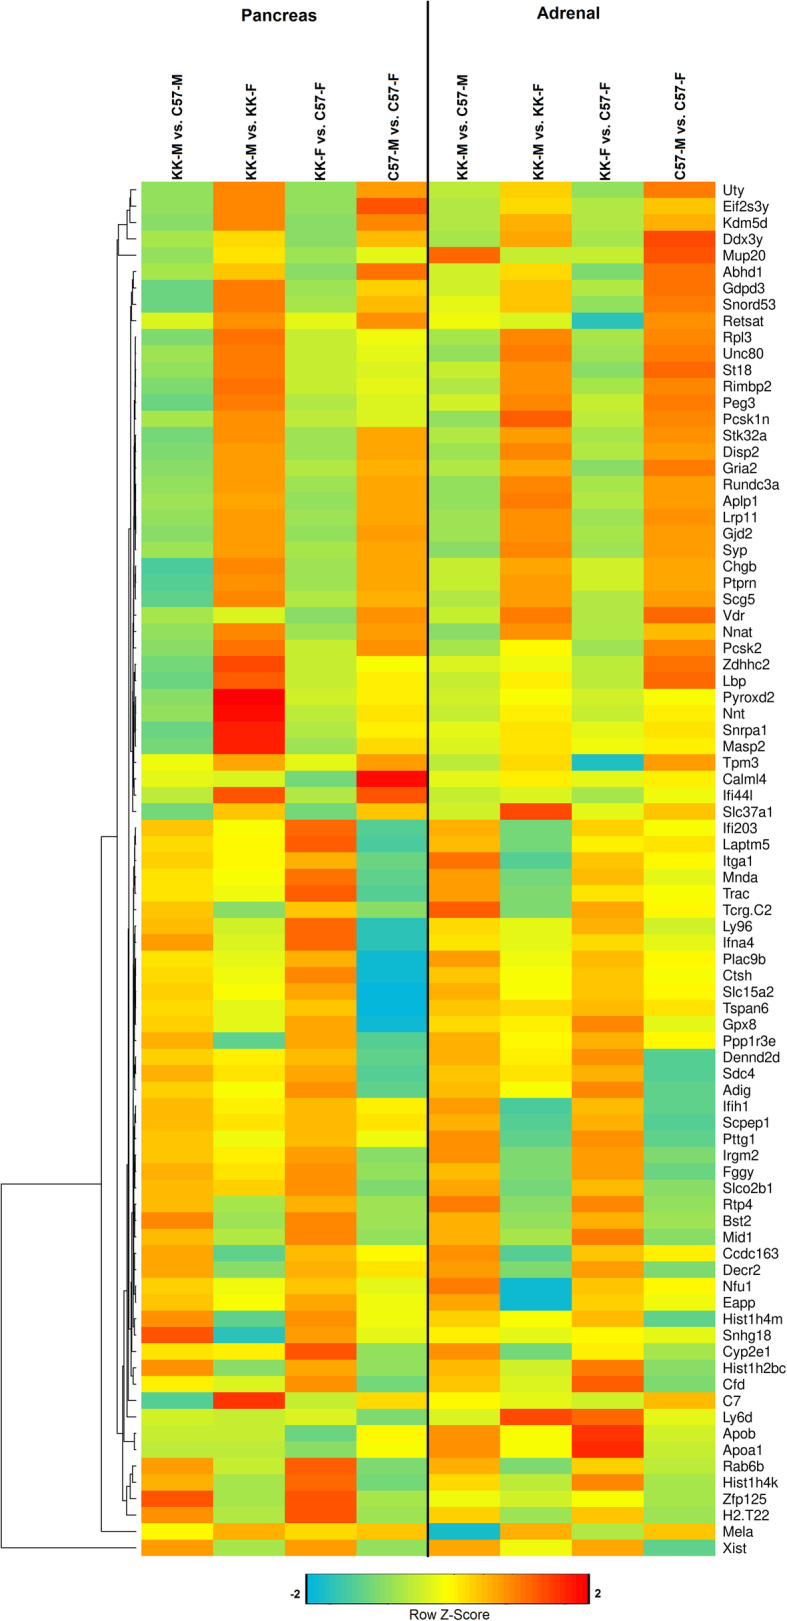
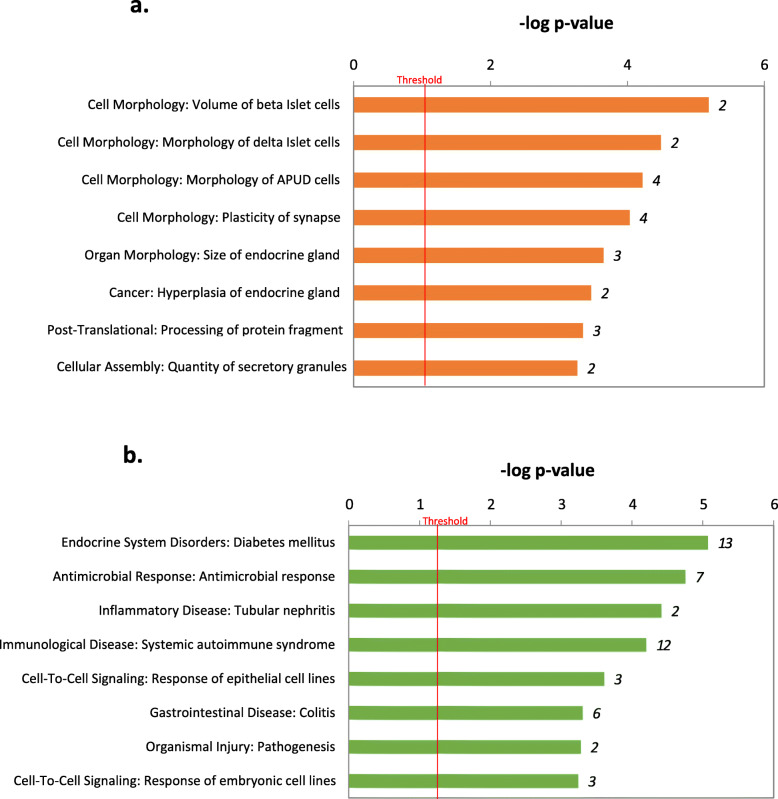
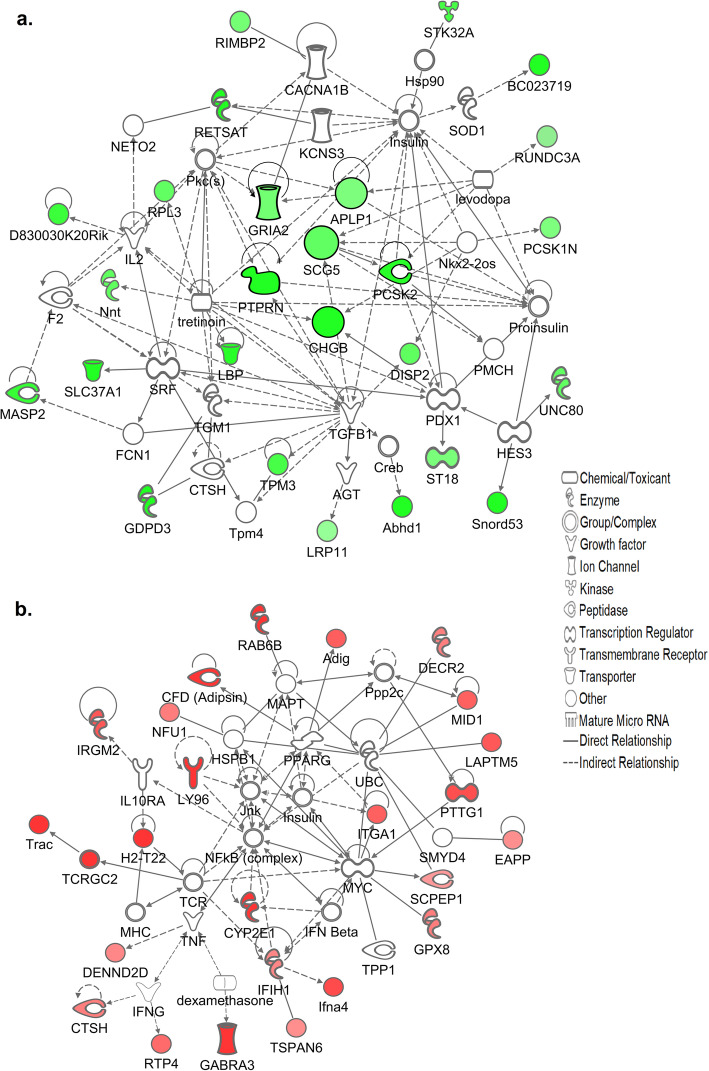
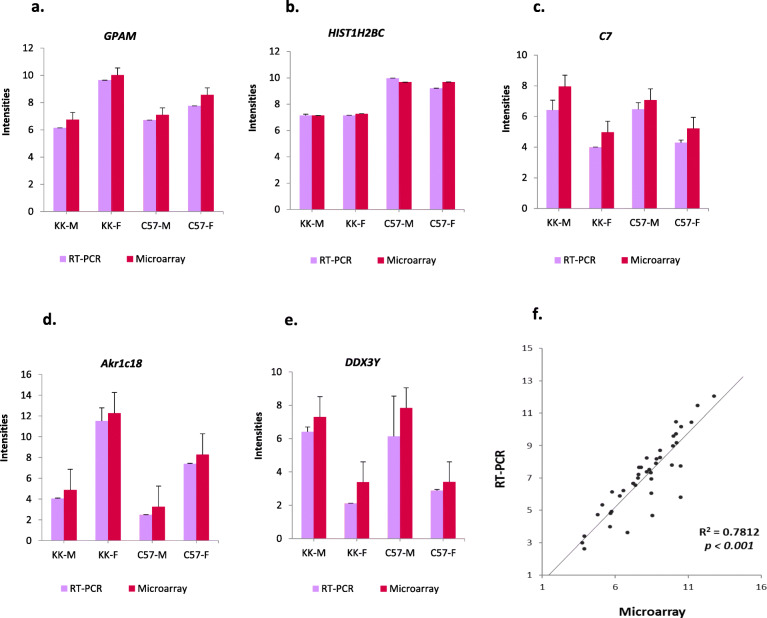
Results: In addition to strain-associated differences in insulin tolerance, we found significant elevations in KK/HlJ mouse serum leptin, insulin and aldosterone. Additionally, glucagon and corticosterone were elevated in female mice of both strains. Using 2-factor ANOVA and a significance level set at 0.05, we identified 10,269 pancreatic and 10,338 adrenal genes with an intensity cut-off of ≥2.0 for all 4 experimental groups. In the pancreas, gene expression upregulated in the KK/HlJ strain related to increased insulin secretory granule biofunction and pancreatic hyperplasia, whereas ontology of upregulated adrenal differentially expressed genes (DEGs) related to cell signaling and neurotransmission. We established a network of functionally related DEGs commonly upregulated in both endocrine tissues of KK/HlJ mice which included the genes coding for endocrine secretory vesicle biogenesis and regulation: PCSK2, PCSK1N, SCG5, PTPRN, CHGB and APLP1. We also identified genes with sex-biased expression common to both strains and tissues including the paternally expressed imprint gene neuronatin.

Conclusion: Our novel results have further characterized the commonalities and diversities of pancreatic and adrenal gene expression between the KK/HlJ and C57BL/6 J strains as well as differences in serum markers of endocrine physiology.

Keywords: C57BL/6 J; Gene expression; Glucose homeostasis; Insulin tolerance test; KK/HlJ; Microarray; Sex-dependent; Strain.


Conflict of interest statement

The authors declare that they have no competing interests.

Figures

Fig. 1
Fig. 1
a 4-way Venn diagram analysis shows numbers of significant pancreatic differentially expressed genes (DEGs) and their overlapping categorization using multiple comparisons with fold-changes (FC≥± 1.4, FDR < 0.05) for Set 1: male KK/HlJ versus male C57BL/6 J (KK-M vs. C57-M, yellow); Set 2: male KK/HlJ versus female KK/HlJ (KK-M vs. KK-F, red), Set 3: female KK/HlJ versus female C57BL/6 J (KK-F vs. C57-F, green), and Set 4: male C57BL/6 J versus female C57BL/6 J (C57-M vs. C57-F, blue). b Heatmap with hierarchical clustering of differentially expressed pancreatic genes (FDR < 0.05) between the 4 Sets. Z-scores denote the relative gene expression levels with red and green representing high and low expression, respectively. c 2-way Venn diagram analysis of numbers of strain-biased pancreatic DEGs identified from the comparisons of Set 1 (KK-M vs. C57-M: yellow) and Set 3 (KK-F vs. C57-F: green), (FC≥± 1.4, FDR < 0.05). Green arrows represent up-regulated in KK-HlJ compared to C57BL/6 J, and red arrows represent down-regulated. d 2-way Venn diagram analysis of numbers of sex-biased pancreatic DEGs identified from the comparisons of Set 2 (KK-M vs. KK-F: blue) and Set 4 (C57-M vs. C57-F: red), (FC≥± 1.4, FDR < 0.05)
Fig. 2
Fig. 2
Gene Ontology Enrichment analysis of strain-associated pancreatic DEGs between the contrast groups (Set 1: KK-M vs. C57-M) and (Set 3: KK-F vs. C57-F) DEGs ≥± 1.4-fold expression differences (P≤0.05) ranked according to (a) Biological function and Disease category and (b) Cellular Compartments analysis of DEGs upregulated in KK/HlJ mice and (c) Biological function and Disease (d) Cellular Compartments analysis of DEGs upregulated in C57BL/6 J mice. Significance level is scored as –log(p-value) from Fischers exact test
Fig. 3
Fig. 3
(a) Ingenuity pathway analysis (IPA) analysis of functional associations between the top scoring adrenal genes upregulated in the KK/HlJ strain according to magnitude of fold changes between the contrast groups: Set 1 (KK-M vs. C57-M) and Set 3 (KK-F vs. C57-F) ≥± 1.4-fold (P≤0.05). The shapes represent the molecular classes of the proteins and the intensity of the green-colored nodes represent the extent of upregulated expression, with dark green representing higher fold changes. Direct and indirect interactions are indicated by solid and dashed lines, respectively. (b) Top pancreatic network of genes upregulated in the C57BL/6 J strain, in which the intensity of the red-colored nodes represent the extent of upregulated expression
Fig. 4
Fig. 4
(a) 4-way Venn diagram analysis shows numbers of significant adrenal differentially expressed genes (DEGs) and their overlapping categorization using multiple comparisons with fold-changes (FC≥± 1.4, FDR < 0.05) for Set 1: male KK/HlJ versus male C57BL/6 J (KK-M vs. C57-M, violet); Set 2: male KK/HlJ versus female KK/HlJ (KK-M vs. KK-F, yellow), Set 3: female KK/HlJ versus female C57BL/6 J (KK-F vs. C57-F, green), and Set 4: male C57BL/6 J versus female C57BL/6 J (C57-M vs. C57-F, pink). (b) Heatmap with hierarchical clustering of differentially expressed adrenal genes (FDR < 0.05) between the 4 Sets. Z-scores denote the relative gene expression levels with red and violet representing high and low expression, respectively. (c) 2-way Venn diagram analysis of numbers of strain-biased adrenal DEGs identified from the comparisons of Set 1 (KK-M vs. C57-M: violet) and Set 3 (KK-F vs. C57-F: green), (FC≥± 1.4, FDR < 0.05). Green arrows represent up-regulated in KK-HlJ compared to C57Bl-6 J, and red arrows represent down-regulated. (d) 2-way Venn diagram analysis of numbers of sex-biased adrenal DEGs identified from the comparisons of Set 2 (KK-M vs. KK-F: yellow) and Set 4 (C57-M vs. C57-F: pink), (FC≥± 1.4, FDR < 0.05)
Fig. 5
Fig. 5
Gene Ontology Enrichment analysis of strain-associated adrenal DEGs between the contrast groups (Set 1: KK-M vs. C57-M) and (Set 3: KK-F vs. C57-F) DEGs ≥± 1.4-fold expression differences (P≤0.05) ranked according to (a) Biological function and Disease category and (b) Cellular Compartments analysis of DEGs upregulated in KK/HlJ mice and (c) Biological function and Disease category and (d) Cellular Compartments analysis of DEGs upregulated in C57BL/6 J mice. Significance level is scored as –log(p-value) from Fischers exact test
Fig. 6
Fig. 6
(a) Ingenuity pathway analysis (IPA) analysis of functional associations between the top scoring adrenal genes upregulated in the KK/HlJ strain according to magnitude of fold changes between the contrast groups: Set 1 (KK-M vs. C57-M) and Set 3 (KK-F vs. C57-F) ≥± 1.4-fold (P≤0.05). The shapes represent the molecular classes of the proteins and the intensity of the green-colored nodes represent the extent of upregulated expression, with dark green representing higher fold changes. Direct and indirect interactions are indicated by solid and dashed lines, respectively. (b) Top adrenal network of genes upregulated in the C57BL/6 J strain, in which the intensity of the red-colored nodes represent the extent of upregulated expression
Fig. 7
Fig. 7
Heatmap with hierarchical clustering of differentially expressed genes common to both adrenal and pancreatic endocrine tissues which exhibited significant strain- or sex-biased expression (FDR < 0.05). Z-scores denote the relative gene expression levels with red and blue representing high and low expression, respectively
Fig. 8
Fig. 8
Gene Ontology Enrichment analysis of Biological function and Diseases associated with DEGs common to both pancreatic and adrenal tissues ranked according to significance. (a) Upregulated in the KK/HlJ strain; (b) Upregulated in the C57BL/6 J strain
Fig. 9
Fig. 9
Functional network associations between the top scoring genes shared by both pancreatic and adrenal tissues (a) upregulated in the KK/HlJ strain; b upregulated in the C57BL/6 J strain, in which the intensity of the colored nodes represent the extent of upregulated expression
Fig. 10
Fig. 10
Expression plots of selected genes between qRT-PCR and Microarray. (a) GPAM: Glycerol-3-Phosphate Acyltransferase; (b) HIST1H2BC (Histone cluster 1, H2bc); (c) C7 (Complement factor 7); (d) Akr1C18 (Aldo-Keto Reductase Family 1, Member C18); (e) DDX3Y (DEAD-Box Helicase 3 Y-Linked). Significance between the four groups is represented as * at P value of ≤0.05. (f) Scatter-plot presentation of changes in expression of 16 selected genes as measured by qRT-PCR and microarray

Similar articles

Cited by

References

    1. King A. The use of animal models in diabetes research. Br J Pharmacol. 2012;166:877–894. doi: 10.1111/j.1476-5381.2012.01911.x. - DOI - PMC - PubMed
    1. NCD Risk Factor Collaboration (NCD-RisC). Worldwide trends in diabetes since 1980: a pooled analysis of 751 population-based studies with 4.4 million participants. Lancet. 2016;387(10027):1513–30. 10.1016/S0140-6736(16)00618-8. - PMC - PubMed
    1. Kautzky-Willer A, Harreiter J, Pacini G. Sex and gender differences in risk, pathophysiology and complications of type 2 diabetes mellitus. Endocr Rev. 2016;37(3):278–316. doi: 10.1210/er.2015-1137. - DOI - PMC - PubMed
    1. Mauvais-Jarvis F. Epidemiology of gender differences in diabetes and obesity. Adv Exp Med Biol. 2017;1043:3–8. doi: 10.1007/978-3-319-70178-3_1. - DOI - PubMed
    1. Maric-Bilkan C. Sex differences in micro- and macro-vascular complications of diabetes mellitus. Clin Sci. 2017;131(9):833–846. doi: 10.1042/CS20160998. - DOI - PubMed