. 2021 Apr;31(4):564-575.
doi: 10.1101/gr.272468.120. Epub 2021 Mar 12.

A flexible repertoire of transcription factor binding sites and a diversity threshold determines enhancer activity in embryonic stem cells

Affiliations

A flexible repertoire of transcription factor binding sites and a diversity threshold determines enhancer activity in embryonic stem cells

Gurdeep Singh et al. Genome Res. 2021 Apr.

Abstract

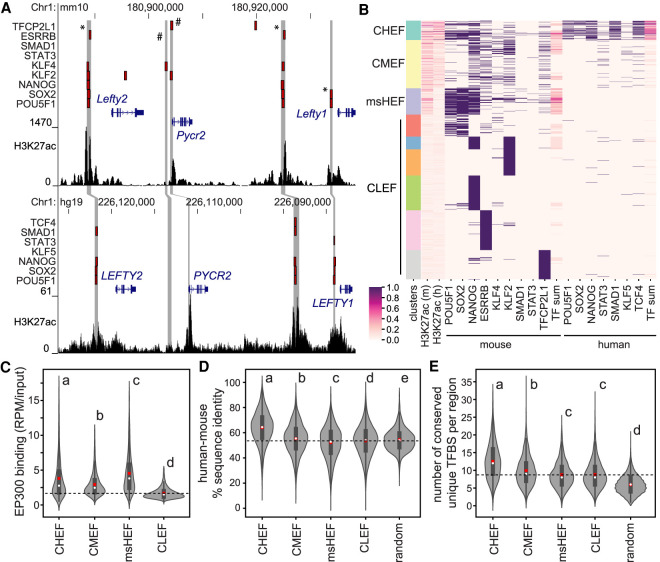
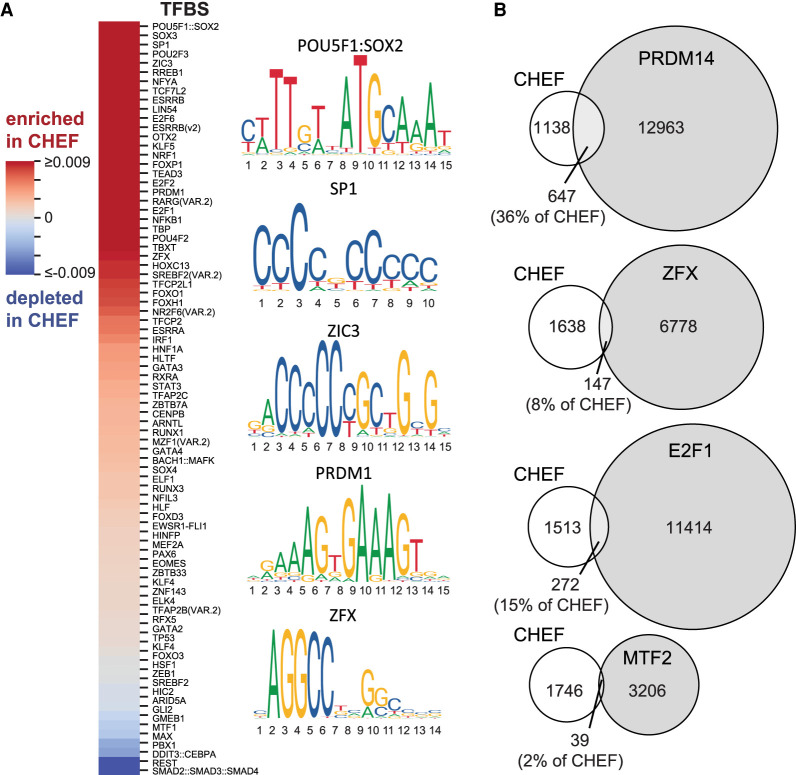
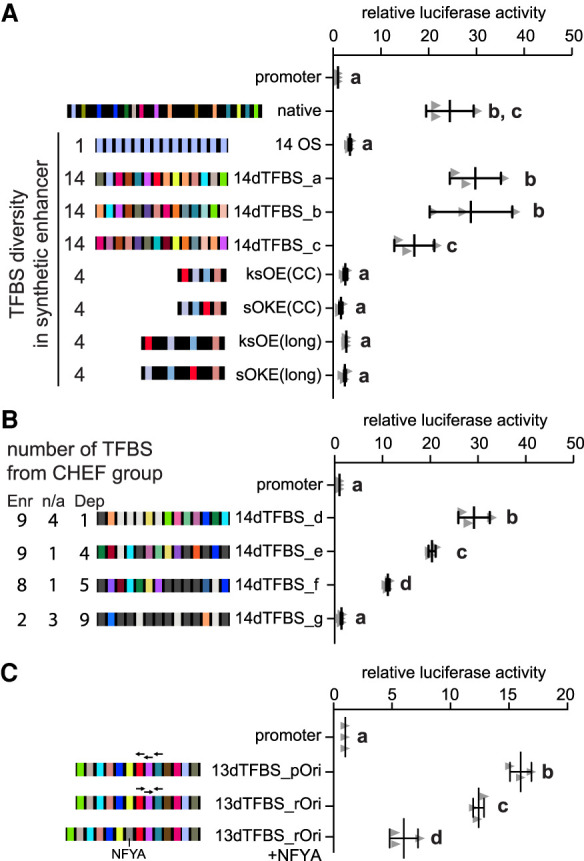
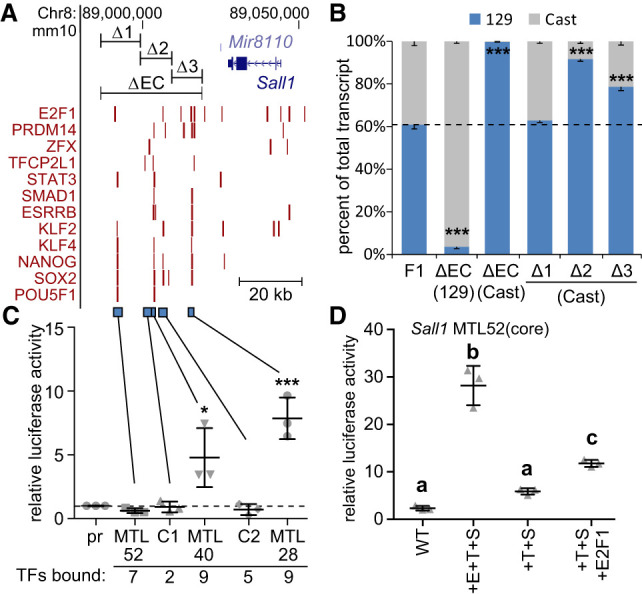
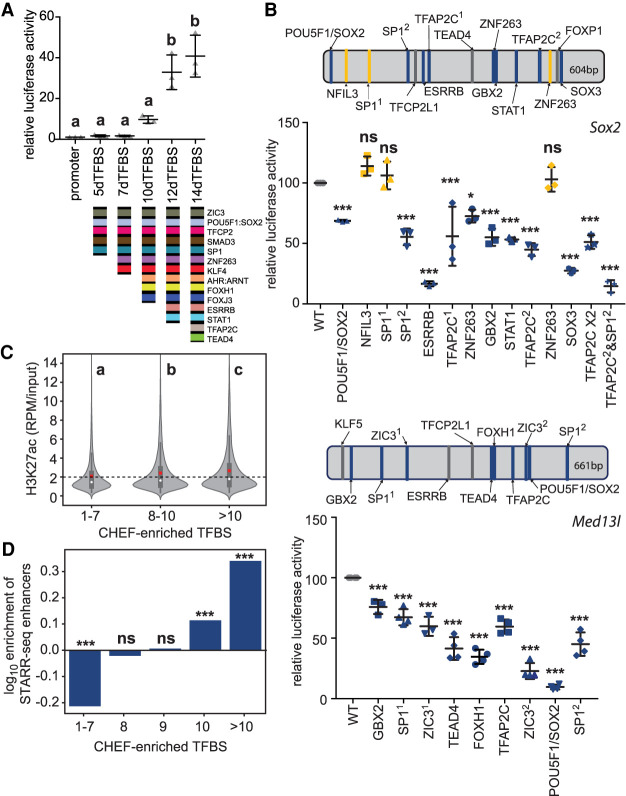
Transcriptional enhancers are critical for development and phenotype evolution and are often mutated in disease contexts; however, even in well-studied cell types, the sequence code conferring enhancer activity remains unknown. To examine the enhancer regulatory code for pluripotent stem cells, we identified genomic regions with conserved binding of multiple transcription factors in mouse and human embryonic stem cells (ESCs). Examination of these regions revealed that they contain on average 12.6 conserved transcription factor binding site (TFBS) sequences. Enriched TFBSs are a diverse repertoire of 70 different sequences representing the binding sequences of both known and novel ESC regulators. Using a diverse set of TFBSs from this repertoire was sufficient to construct short synthetic enhancers with activity comparable to native enhancers. Site-directed mutagenesis of conserved TFBSs in endogenous enhancers or TFBS deletion from synthetic sequences revealed a requirement for 10 or more different TFBSs. Furthermore, specific TFBSs, including the POU5F1:SOX2 comotif, are dispensable, despite cobinding the POU5F1 (also known as OCT4), SOX2, and NANOG master regulators of pluripotency. These findings reveal that a TFBS sequence diversity threshold overrides the need for optimized regulatory grammar and individual TFBSs that recruit specific master regulators.


Figures

Figure 1.
Figure 1.
Conserved high enhancer feature (CHEF) regions contain a conserved regulatory code. (A) The Lefty1/Lefty2 locus in the mouse (top) and human (bottom) genomes. Transcription factor–bound regions from ChIP-seq (red bars), mouse and human syntenic regions (gray bars), and H3K27ac ChIP-seq data are displayed on the mm10 and hg19 assemblies of the University of California at Santa Cruz (UCSC) Genome Browser. * indicates regions with conserved binding of multiple transcription factors in mouse and human; # indicates regions with binding only in mouse ESCs. (B) Clustering of transcription factor–bound regions in mouse ESCs, using H3K27ac, transcription factor binding, and the number of transcription factors bound in a region (TF sum) at associated mouse and human regions. (C–E) Groups determined by one-way ANOVA to be significantly different (P < 0.05) are labeled with different letters; to indicate P > 0.05, groups are labeled with the same letter. In the violin plots, the white dot indicates the median; the red box indicates the mean; the dashed line indicates the mean for the CLEF cluster. (C) CHEF, CMEF, and msHEF regions display significantly increased EP300 association compared to CLEF regions. (D) CHEF regions display the highest overall percentage of sequence identity between mouse and human compared to other clusters and random regions not bound by transcription factors. (E) CHEF regions contain an increased number of unique TFBS sequences for ESC-expressed TFs compared to other clusters and random regions not bound by transcription factors. This was identified using MotEvo based on TFBS sequence conservation across six species.
Figure 2.
Figure 2.
A large repertoire of transcription factor binding sequences contributes to enhancer activity. (A) Heat map indicating the TFBS sequences enriched (red) or depleted (blue) in conserved high enhancer feature regions (CHEF) compared to the NANOG-bound low enhancer feature regions. (B) Overlap between conserved high enhancer feature (CHEF) regions and ChIP-seq peaks for transcription factors predicted to bind these regions based on TFBS sequence enrichment in CHEF regions (PRDM14, E2F1, ZFX) or predicted not to bind CHEF regions based on TFBS sequence depletion (MTF2).
Figure 3.
Figure 3.
Synthetic sequences reveal that transcription factor binding site diversity is required and sufficient for robust enhancer activity. In panels AC, error bars represent the standard deviation; groups determined by one-way ANOVA to be significantly different (P < 0.05) are labeled with different letters; to indicate P > 0.05, groups are labeled with the same letter. n ≥ 3 biological replicates. (A) Synthetic enhancers were evaluated in reporter assays and compared to the activity of the Sox2 enhancer (native). A sequence containing 14 POU5F1:SOX2 TFBS (14OS), 14 different TFBSs (14dTFBS_a, _b, _c) from the CHEF-enriched TFBS were evaluated. Optimized 4 TFBS sequences (ksOE, sOKE), with either CC or long spacers between motifs were also evaluated. (B) Enhancer activity is reduced when sequences contain fewer CHEF-enriched (Enr) and more CHEF-depleted (Dep) TFBSs. The number of TFBSs that are neither enriched or depleted is indicated by n/a. (C) The effect of motif orientation and repressor binding on enhancer activity. 13dTFBS_pOri contains the preferred orientation, 13dTFBS_rOri contains reversed TFBS. Addition of the repressor NFYA to 13dTFBS_rOri affects but does not abolish enhancer activity.
Figure 4.
Figure 4.
Addition of three different transcription factor binding sequences confers activity to an inactive region bound by six transcription factors. (A) Transcription factor–bound regions in the Sall1 locus from ChIP-seq (red bars) are displayed on the mm10 assembly of the UCSC Genome Browser. At the top, CRISPR deleted regions (ΔEC, Δ1, Δ2, Δ3) are displayed. At the bottom, regions tested for enhancer activity are displayed (blue bars). (B) Sall1 expression in wild-type F1 clones (F1) compared to clones with the indicated deletion. Allele-specific primers detect 129 or Cast RNA in RT-qPCR. Expression for each allele is shown relative to the total. Error bars represent SEM. n ≥ 3 biological replicates. (***) P < 0.001; significant differences from the F1 values. In C,D, error bars represent the standard deviation. n ≥ 3 biological replicates. (C) Luciferase activity at control (C1, C2) regions and multiple transcription factor–bound loci (MTL) 52, 40, and 28 kb downstream from Sall1. Significant differences from pr (promoter only) were determined by t-test and are indicated by (*) P < 0.05, (***) P < 0.001. (D) Luciferase activity for wild-type (WT) MTL52 core transcription factor–bound region, MTL52 core with ESRRB, TFCP2L1, and SMAD3 (+E+T+S) motifs mutated to the consensus TFBS sequence. From +E+T+S, ESRRB (+T+S) was removed. E2F1 was added to +T+S (+T+S+E2F1). Groups determined by one-way ANOVA to be significantly different (P < 0.05) are labeled with different letters.
Figure 5.
Figure 5.
Ten or more different transcription factor binding sequences are required for enhancer activity. (A) Sequential removal of TFBS to form 14dTFBS_a revealed the importance of multiple TFBS sequences for enhancer activity and a threshold requirement of 10 TFBSs. Error bars represent the standard deviation; groups determined by one-way ANOVA to be significantly different (P < 0.05) are labeled with different letters. (B) Enhancers that regulate Sox2 or Med13l contain multiple conserved TFBSs (top) which are required for activity as demonstrated by TFBS mutagenesis (bottom). TFBSs indicated in blue were required for enhancer activity; TFBSs indicated in gray were not modified; yellow indicates TFBSs found not to be required for activity. Significant differences compared to the wild-type (WT) sequence are indicated by (*) P < 0.05, (***) P < 0.001, (ns) = not significant. Error bars represent the standard deviation. (C) Transcription factor–bound regions in mouse ESCs with >10 TFBSs have significantly higher enrichment of H3K27ac compared to transcription factor–bound regions with 8–10 and 1–7 TFBSs in the 700-bp sequence window. Groups determined by one-way ANOVA to be significantly different (P < 0.0001) are labeled with different letters. In the violin plots, the white dot indicates the median, the red box indicates the mean, and the dashed line indicates the average for the 1–7 TFBSs group. (D) Regions containing 10 or >10 CHEF-enriched TFBS sequences have significant enrichment of STARR-seq enhancers as indicated by (***) (P < 0.001, hypergeometric test). Regions containing 1–7 CHEF-enriched TFBS sequences are depleted in STARR-seq enhancers; (ns) indicates no significant enrichment of STARR-seq enhancers.

Similar articles

Cited by

References

    1. Arnold P, Erb I, Pachkov M, Molina N, van Nimwegen E. 2012. MotEvo: integrated Bayesian probabilistic methods for inferring regulatory sites and motifs on multiple alignments of DNA sequences. Bioinformatics 28: 487–494. 10.1093/bioinformatics/btr695 - DOI - PubMed
    1. Ballester B, Medina-Rivera A, Schmidt D, Gonzàlez-Porta M, Carlucci M, Chen X, Chessman K, Faure AJ, Funnell APPW, Goncalves A, et al. 2014. Multi-species, multi-transcription factor binding highlights conserved control of tissue-specific biological pathways. eLife 3: e02626. 10.7554/eLife.02626 - DOI - PMC - PubMed
    1. Barakat TS, Halbritter F, Zhang M, Rendeiro AF, Perenthaler E, Bock C, Chambers I. 2018. Functional dissection of the enhancer repertoire in human embryonic stem cells. Cell Stem Cell 23: 276–288.e8. 10.1016/j.stem.2018.06.014 - DOI - PMC - PubMed
    1. Chaudhri VK, Dienger-Stambaugh K, Wu Z, Shrestha M, Singh H. 2020. Charting the cis-regulome of activated B cells by coupling structural and functional genomics. Nat Immunol 21: 210–220. 10.1038/s41590-019-0565-0 - DOI - PubMed
    1. Chen X, Xu H, Yuan P, Fang F, Huss M, Vega VB, Wong E, Orlov YL, Zhang W, Jiang J, et al. 2008. Integration of external signaling pathways with the core transcriptional network in embryonic stem cells. Cell 133: 1106–1117. 10.1016/j.cell.2008.04.043 - DOI - PubMed

Publication types

Substances

Grants and funding