. 2021 Mar;9(3):e001966.
doi: 10.1136/jitc-2020-001966.

Extracellular HMGB1 blockade inhibits tumor growth through profoundly remodeling immune microenvironment and enhances checkpoint inhibitor-based immunotherapy

Affiliations

Extracellular HMGB1 blockade inhibits tumor growth through profoundly remodeling immune microenvironment and enhances checkpoint inhibitor-based immunotherapy

Pascale Hubert et al. J Immunother Cancer. 2021 Mar.

Abstract

Background: High-mobility group box 1 (HMGB1) is a multifunctional redox-sensitive protein involved in various intracellular (eg, chromatin remodeling, transcription, autophagy) and extracellular (inflammation, autoimmunity) processes. Regarding its role in cancer development/progression, paradoxical results exist in the literature and it is still unclear whether HMGB1 mainly acts as an oncogene or a tumor suppressor.

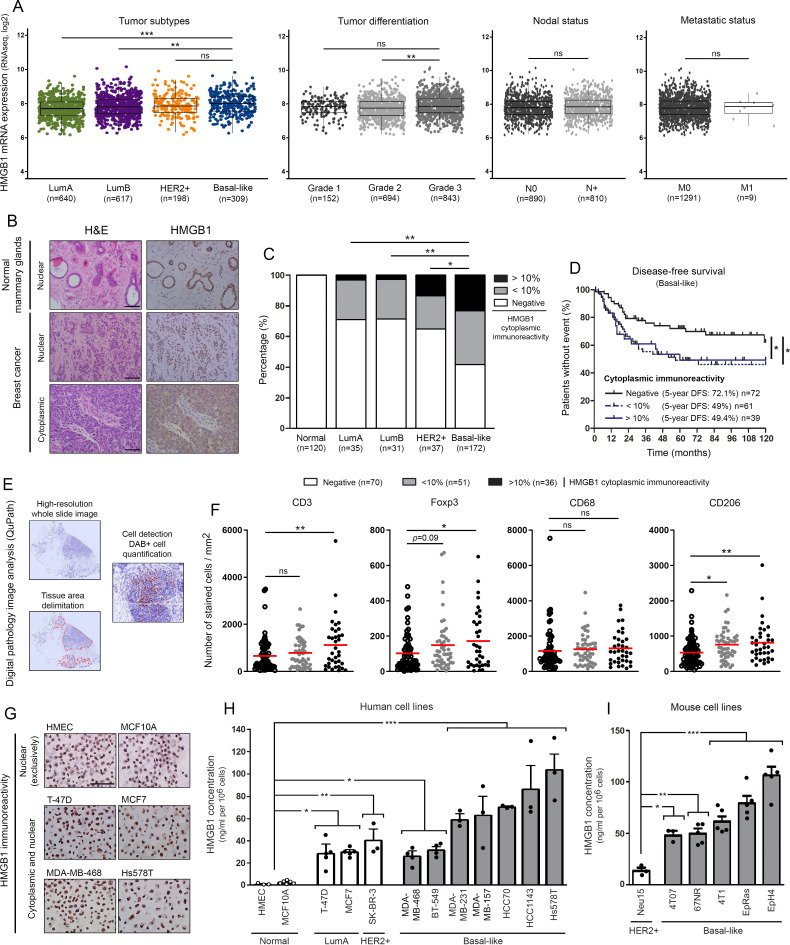
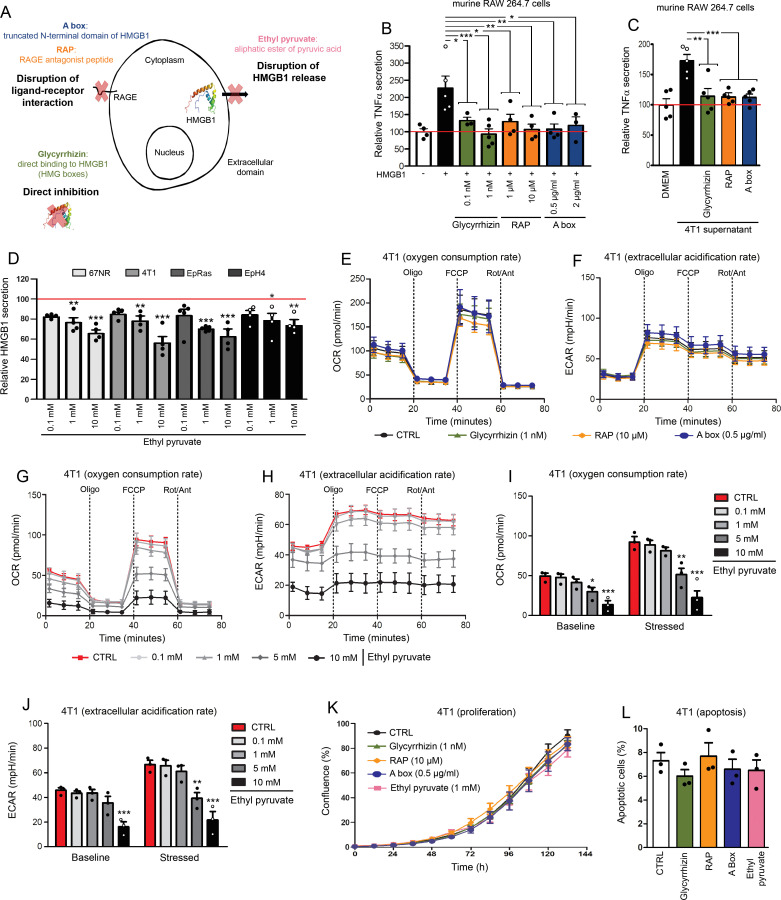
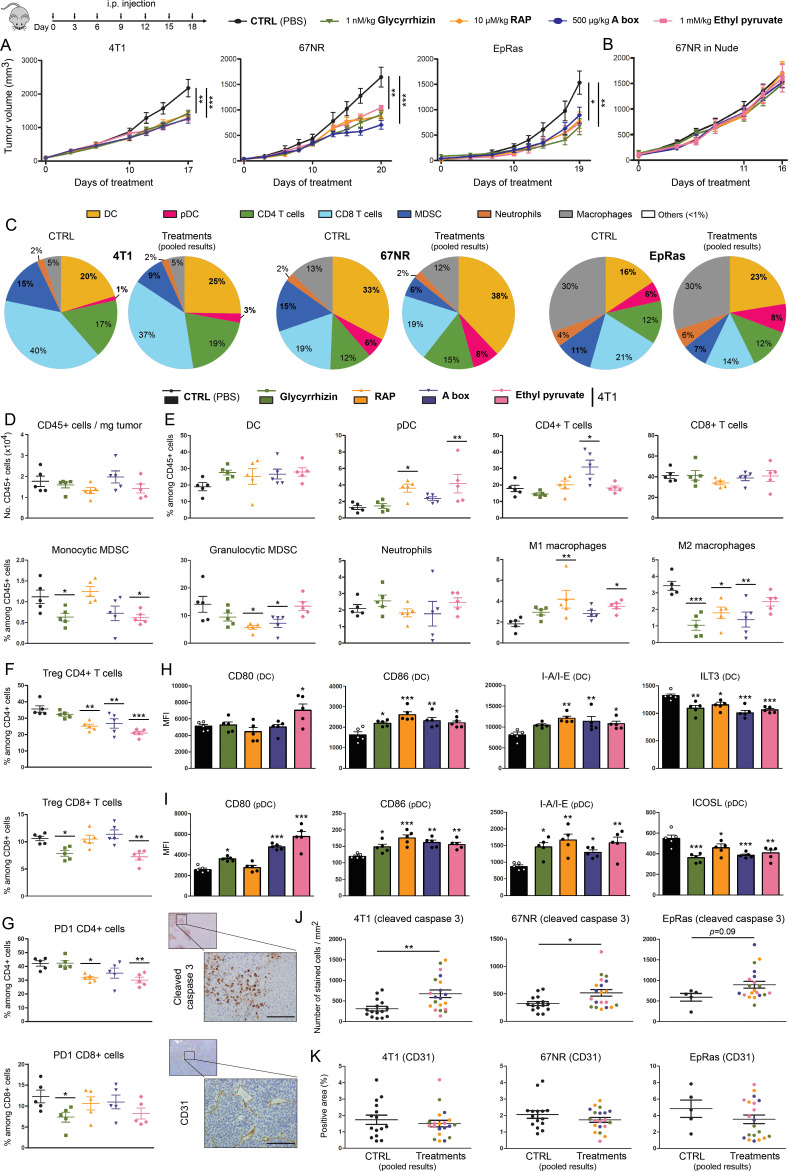
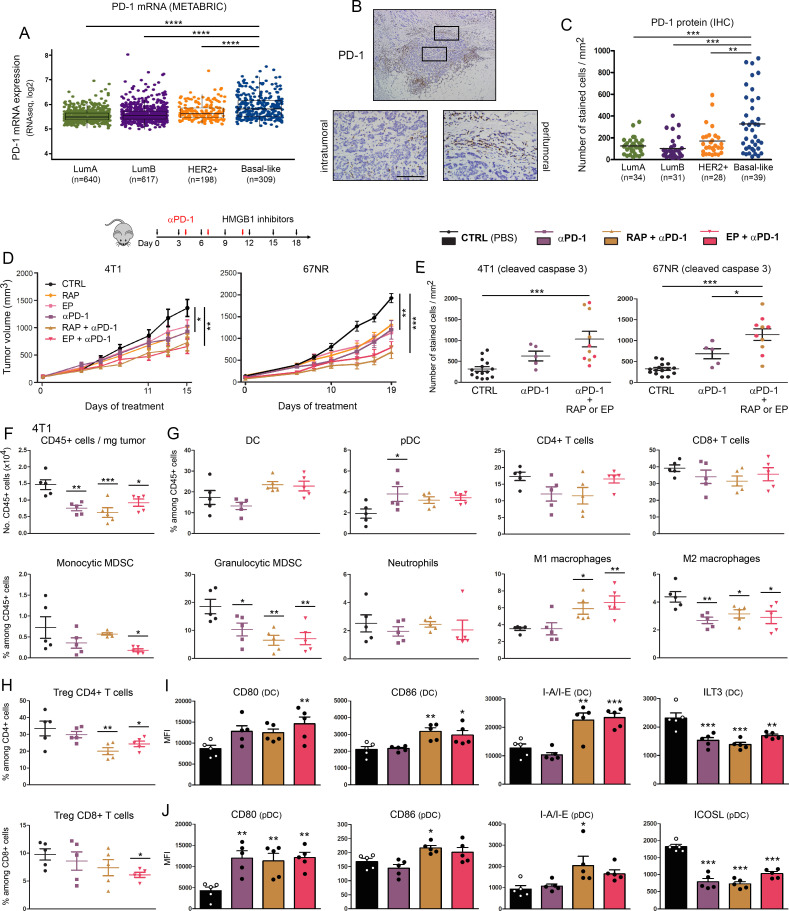
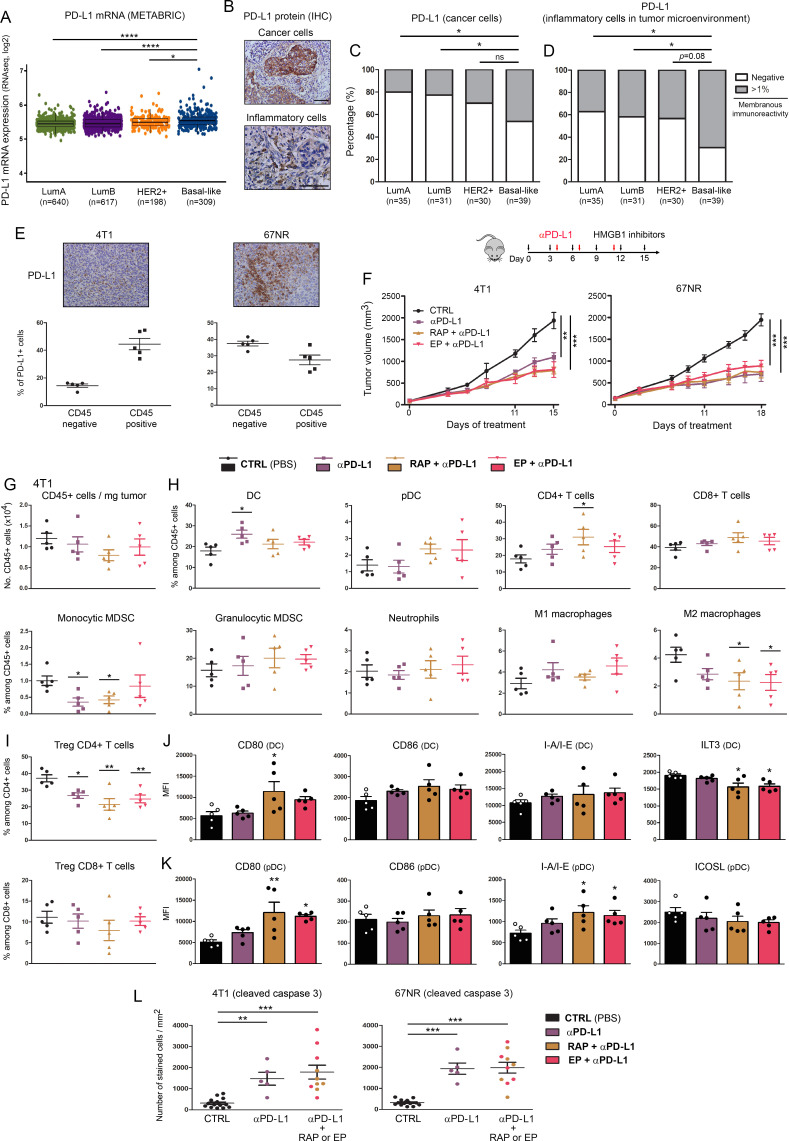
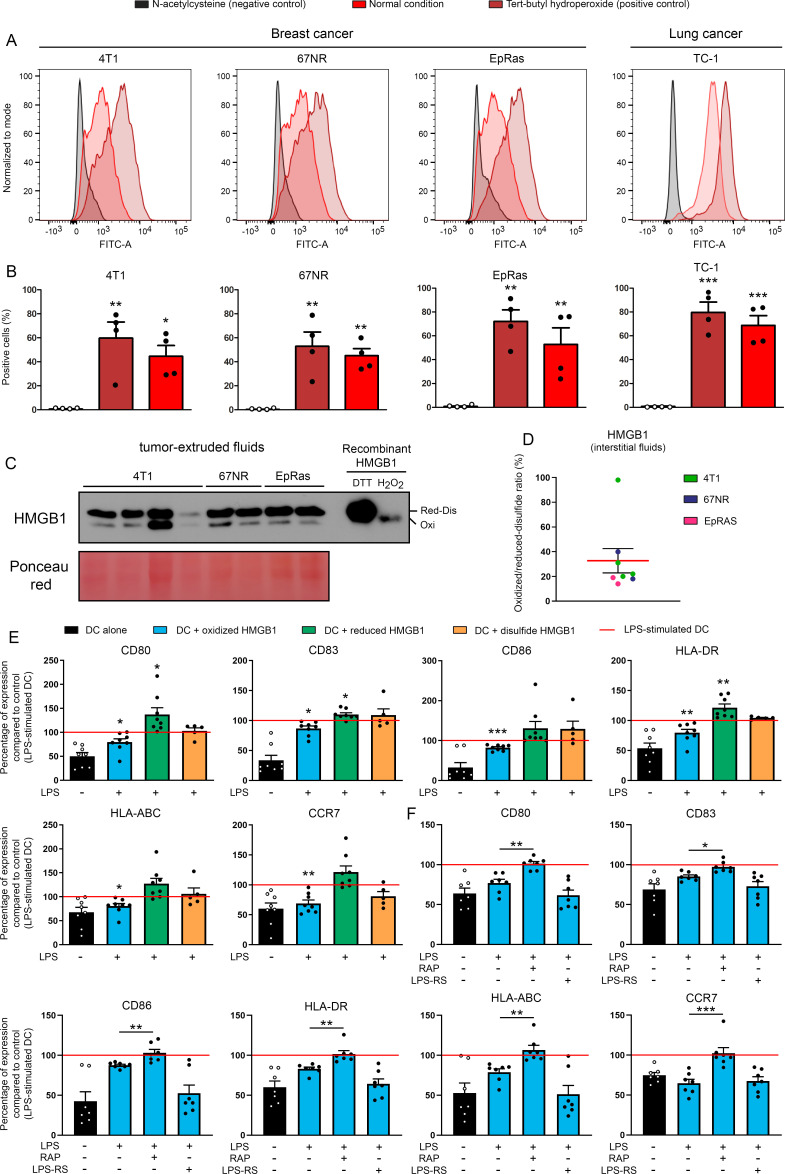
Methods: HMGB1 expression was first assessed in tissue specimens (n=359) of invasive breast, lung and cervical cancer and the two distinct staining patterns detected (nuclear vs cytoplasmic) were correlated to the secretion profile of malignant cells, patient outcomes and the presence of infiltrating immune cells within tumor microenvironment. Using several orthotopic, syngeneic mouse models of basal-like breast (4T1, 67NR and EpRas) or non-small cell lung (TC-1) cancer, the efficacy of several HMGB1 inhibitors alone and in combination with immune checkpoint blockade antibodies (anti-PD-1/PD-L1) was then investigated. Isolated from retrieved tumors, 14 immune cell (sub)populations as well as the activation status of antigen-presenting cells were extensively analyzed in each condition. Finally, the redox state of HMGB1 in tumor-extruded fluids and the influence of different forms (oxidized, reduced or disulfide) on both dendritic cell (DC) and plasmacytoid DC (pDC) activation were determined.

Results: Associated with an unfavorable prognosis in human patients, we clearly demonstrated that targeting extracellular HMGB1 elicits a profound remodeling of tumor immune microenvironment for efficient cancer therapy. Indeed, without affecting the global number of (CD45+) immune cells, drastic reductions of monocytic/granulocytic myeloid-derived suppressor cells (MDSC) and regulatory T lymphocytes, a higher M1/M2 ratio of macrophages as well as an increased activation of both DC and pDC were continually observed following HMGB1 inhibition. Moreover, blocking HMGB1 improved the efficacy of anti-PD-1 cancer monoimmunotherapy. We also reported that a significant fraction of HMGB1 encountered within cancer microenvironment (interstitial fluids) is oxidized and, in opposite to its reduced isoform, oxidized HMGB1 acts as a tolerogenic signal in a receptor for advanced glycation endproducts-dependent manner.

Conclusion: Collectively, we present evidence that extracellular HMGB1 blockade may complement first-generation cancer immunotherapies by remobilizing antitumor immune response.

Keywords: breast neoplasms; translational medical research; tumor microenvironment.


Conflict of interest statement

Competing interests: None declared.

Figures

Figure 1
Figure 1
HMGB1 is highly secreted by basal-like breast cancer cells and its tumor-specific cytoplasmic expression is associated with immune tolerance and poor outcome. (A) The METABRIC dataset was used for analyzing HMGB1 expression level in breast cancers according to molecular subtypes, histologic grades, nodal and metastatic statuses. (B) Representative pictures of normal mammary glands and breast cancers stained for HMGB1. Note the two distinct HMGB1 staining patterns detected in tumor specimens: nuclear versus cytoplasmic. (C) Semiquantitative evaluation of cytoplasmic HMGB1 immunoreactivity (negative, 0%–10% or >10% positive cells) in both normal mammary glands (n=120) and neoplasms (LumA, n=35; LumB, n=31; HER2+, n=37; basal-like, n=172). (D) Disease-free survival of patients treated for basal-like breast cancer according to cytoplasmic HMGB1 expression (negative, n=72; 0%–10%, n=61; >10%, n=39). This latter parameter was clearly found to be an independent prognostic factor. (E) Illustration of the different steps for DAB-positive cell quantification using computerized image analysis (QuPath). (F) CD3+, Foxp3+, CD68+ and CD206+ cell infiltrations in microenvironment of basal-like breast tumors. Whereas the global number (CD68+) did not significantly change, an increased density of CD206+ M2 macrophages was detected in cytoplasmic HMGB1-positive cancers. A similar increase was also reported with Foxp3+ Treg lymphocytes. the number of positive cells was reported to tumor area (mm2). (G) Representative examples of normal (HMEC and MCF10A) and malignant cells (LumA: T-47D and MCF7; basal-like: MDA-MB-468 and Hs578T) stained for HMGB1. Note the exclusive nuclear immunoreactivity displayed by normal mammary cells. Secretion/release of HMGB1 analyzed by ELISA in (H) human and (I) mouse cell culture supernatants. High concentrations were especially detected in cell cultures derived from triple negative/basal-like tumors. The means±SEM (plus each individual data point) for at least three independent experiments are represented. The scale bar represents 100 µm. Asterisks indicate statistically significant differences (*p<0.05; **p<0.01; ***p<0.001). P values were determined using one-way ANOVA followed by Bonferroni post-test (A), unpaired t-test (A), χ2 test (C), log-rank (Mantel-Cox) test (D) and one-way ANOVA followed by Dunnett’s multiple comparison post-test (F, H, I). ANOVA, analysis of variance; HMGB1, high-mobility group box 1; METABRIC, Molecular Taxonomy of Breast Cancer International Consortium.
Figure 2
Figure 2
Glycyrrhizin, RAP, A box and EP exert efficient neutralizing effects on extracellular HMGB1 without altering tumor cell proliferation and apoptosis/necrosis. (A) Schematic representation of different modes of inhibition for extracellular HMGB1. Mouse RAW 264.7 cells were stimulated with recombinant HMGB1 (B) or conditioned media from 4T1 basal-like breast cancer cells (C) in the absence or presence of glycyrrhizin, RAP or a box (several concentrations were tested). Note the significant decrease of HMGB1-induced TNFα secretion when HMGB1 inhibitors were added in the cell cultures, indicating their efficient neutralizing effect. (D) EP was directly added in the culture medium of 4 different mouse basal-like breast cancer cell lines (4T1, 67NR, EpRas and EpH4). Forty-eight hours later, HMGB1 concentrations were determined by ELISA and the ability of EP to inhibit HMGB1 release in a dose-dependent manner was highlighted. (E) Oxygen consumption rate (OCR) and (F) extracellular acidification rate (ECAR) in 4T1 cells in the absence or presence of glycyrrhizin (1 nM), RAP (10 µM) and a box (0.5 µg/mL) were determined using Seahorse extracellular flux analyzer. No modification of OCR/ECAR was detected with these three HMGB1 inhibitors. (G) OCR and (H) ECAR in 4T1 cells following EP addition (concentration range: 0.1–10 mM). Histograms representing OCR (I) and ECAR (J) before (baseline) and after (stressed) oligomycin and FCCP addition in the absence or presence of EP. Both OCR and ECAR were strongly decreased with 5 and 10 mM EP. No significant change was detected with lower concentrations (0.1–1 mM). (K) Cell proliferation and (L) apoptosis of mouse 4T1 cells cultured without or with HMGB1 inhibitors (glycyrrhizin (1 nM), RAP (10 µM), a box (0.5 µg/mL) and EP (1 mM)) were determined using IncuCyte live cell analyzing system and annexin V-propidium iodide staining assay, respectively. No significant change was reported. The means±SEM (plus each individual data point) for at least three independent experiments are represented. Asterisks indicate statistically significant differences (*p<0.05; **p<0.01; ***p<0.001). P values were determined using one-way ANOVA, followed by Dunnett’s multiple comparison post-test (B, C, D, I, J, K, L). ANOVA, analysis of variance; ECAR, extracellular acidification rate; EP, ethyl pyruvate; HMGB1, high-mobility group box 1; RAGE, receptor for advanced glycation endproducts; RAP, RAGE antagonist peptide; TNFα, tumor necrosis factor-α.
Figure 3
Figure 3
Extracellular HMGB1 blockade inhibits the growth of pre-established solid tumors in immunocompetent mice through activating anticancer immune responses. (A) Mouse basal-like breast cancer cells (4T1, 67NR and EpRas) were orthotopically injected into the mammary fat pad of immunocompetent BALB/c mice. Tumor-bearing mice were then treated at 3-day intervals with PBS (control) or HMGB1 inhibitors (glycyrrhizin (1 nM/kg), RAP (10 µM/kg), a box (500 µg/kg) and EP (1 mM/kg)). The mean tumor volumes±SEM are represented. (B) HMGB1 inhibitors were tested in nude mice implanted with 67NR cells. Note the absence of beneficial effect in these latter immunocompromised mice, indicating the dependence on the adaptive immune responses. (C) At day 17, 19 or 20 (depending on the analyzed cell line), tumors were harvested, CD45+ immune cells were isolated and analyzed by flow cytometry. The proportions of each analyzed immune cell population in both control and treated groups (pooled results) are shown. Note the drastic reduction of MDSC following extracellular HMGB1 blockade. (D) Total number of (CD45+) immune cells per milligram of tumor in both control and treated groups. (E) Scatter dot plots showing the percentage of each individual immune cell population (DC, PDC, CD4+ and CD8+ T cells, monocytic and granulocytic MDSC, neutrophils, M1 and M2 macrophages) among CD45+ cells in the different treatment groups. an increased M1/M2 ratio of macrophages was observed in most HMGB1 inhibitor-treated tumors. The intratumoral immune cells were analyzed in five mice per condition. (F) Scatter dot plots illustrating the percentage of tumor-infiltrating Treg (Foxp3+) CD4+ and CD8+ cells among total CD4+ and CD8+ populations in the different treatment groups. (G) Scatter dot plots illustrating the percentage of tumor-infiltrating PD-1+ CD4+ and PD-1+ CD8+ cells among total CD4+ and CD8+ populations in the treatment groups. The activation status of both DC (H) and PDC (I) in the different treatment groups was also determined by analyzing the expression of several cell surface markers (CD80, CD86, I-A/I-E, ILT3 and ICOSL). Data represent the mean fluorescent intensity (MFI)±SEM of 5 independent experiments in each group (each individual data point is shown). The number of apoptotic cancer cells (cleaved caspase 3+) (J) as well as the density of blood vessels within tumor microenvironment (CD31+) (K) were determined by computerized counting (using QuPath software). The number of cleaved caspase 3+ cells and the percentage of CD31+ pixels were reported to tumor area. The scale bar represents 100 µm. Asterisks indicate statistically significant differences (*p<0.05; **p<0.01; ***p<0.001). P values were determined using one-way ANOVA followed by Dunnett’s multiple comparison post-test (A, B, D, E, F, G, H, I) and (Welch-corrected) unpaired t-test (J, K). ANOVA, analysis of variance; DC, dendritic cell; EP, ethyl pyruvate; HMGB1, high-mobility group box 1; i.p, intraperitoneal; MDSC, myeloid-derived suppressor cells; pDC, plasmacytoid DC; RAP, RAGE antagonist peptide.
Figure 4
Figure 4
Extracellular HMGB1 blockade enhances anti-PD-1-induced inhibition of tumor growth in vivo. (A) PD-1 mRNA expression (PDCD1 gene) in the four major molecular subtypes of breast cancer was determined using the METABRIC public dataset. (B) Representative example of breast cancer stained for PD-1. Positive cells were observed in the epithelial component of the tumor as well as in the stroma surrounding cancer cells. (C) PD-1+ cell infiltration within tumor microenvironment was determined by computerized counting. Each point represents the number of positive cells/mm2 for one independent tumor specimen. (D) Mouse breast cancer cells (4T1 and 67NR) were orthotopically injected into the mammary fat pad of immunocompetent BALB/c mice. Anti-PD-1 antibody was tested alone (i.p. injection of 200 µg at days 4, 7 and 11) and in combination with HMGB1 inhibitors (RAP (10 µM/kg) and EP (1 mM/kg), treatment at 3 day intervals). In parallel, the anticancer efficacy of these combination regimens was also compared with that displayed by each individual HMGB1 inhibitor used in monotherapy. The mean tumor volumes±SEM are represented. (E) The apoptotic cancer cells (cleaved caspase 3+) were detected by immunohistochemistry and quantified using QuPath software. The number of positive cells was reported to tumor area (mm2). (F) The total number of (CD45+) immune cells per milligram of tumor was determined in the different treatment groups. (G) Scatter dot plots illustrating the percentage of each individual immune cell population (DC, PDC, CD4+ and CD8+ T cells, monocytic and granulocytic MDSC, neutrophils, M1 and M2 macrophages) among CD45+ cells in both control and treated groups. Reduced densities of granulocytic MDSC as well as an increase of M1 macrophages were especially observed in case of combination therapy. The intratumoral immune cells were analyzed in five mice per condition. (H) Scatter dot plots showing the percentage of tumor-infiltrating Treg (Foxp3+) CD4+ and CD8+ cells among total CD4+ and CD8+ populations in the different treatment groups. the activation status of DC (I) and pDC (J) was determined by flow cytometry. the expression of several surface markers (CD80, CD86, I-A/I-E, ILT3 and ICOSL) was analyzed. Data represent the mean fluorescent intensity (MFI)±SEM of 5 independent experiments in each group (each individual data point is shown). The scale bar represents 100 µm. Asterisks indicate statistically significant differences (*p<0.05; **p<0.01; ***p<0.001; ****p<0.0001). P values were determined using one-way ANOVA followed by Bonferroni post-test (A, C, E) or Dunnett’s multiple comparison post-test (D, F, G, H, I, J). ANOVA, analysis of variance; DC, dendritic cell; HMGB1, high-mobility group box 1; METABRIC, Molecular Taxonomy of Breast Cancer International Consortium; MDSC, myeloid-derived suppressor cells; pDC, plasmacytoid DC; RAP, RAGE antagonist peptide.
Figure 5
Figure 5
Combination of anti-PD-L1 with HMGB1 inhibitors strongly inhibits tumor growth in syngeneic mouse models of basal-like breast cancer. (A) mRNA level of PD-L1 (CD274 gene) in the four major molecular subtypes of breast cancer was determined using the METABRIC public dataset. (B) Representative example of breast cancer stained for PD-L1. Positive signals were detected on cancer cells and/or on inflammatory cells within tumor microenvironment. Semiquantitative evaluation of PD-L1 immunoreactivity (negative or >1% membrane staining) displayed by cancer cells (C) or inflammatory cells infiltrating the tumor microenvironment (D). The analyzed cancer specimens were categorized into the four molecular subtypes of breast cancer (LumA, LumB, HER2+ and basal-like). (E) The percentage of PD-L1+ cells in both epithelial/cancer (CD45-) and inflammatory (CD45+) components of untreated harvested 4T1/67NR tumors was determined by flow cytometry. Note the distinct profile displayed by these two cell lines. (F) Mouse breast cancer cells (4T1 and 67NR) were orthotopically injected into the mammary fat pad of immunocompetent BALB/c mice. Anti-PD-L1 antibody was tested alone (i.p. injection of 100 µg at days 4, 7 and 11) and in combination with HMGB1 inhibitors (RAP (10 µM/kg) and EP (1 mM/kg), treatment at 3-day intervals). The mean tumor volumes±SEM are represented. (G) The total number of (CD45+) immune cells per milligram of tumor was determined in the different treatment groups by flow cytometry. (H) Scatter dot plots illustrating the percentage of each individual immune cell population (DC, PDC, CD4+ and CD8+ T cells, monocytic and granulocytic MDSC, neutrophils, M1 and M2 macrophages) among CD45+ cells in both control and treated groups. The intratumoral immune cell infiltration was analyzed in five mice per condition. (I) scatter dot plots showing the percentage of tumor-infiltrating Treg (Foxp3+) CD4+ and CD8+ cells among total CD4+ and CD8+ populations in the different treatment groups. The activation status of DC (J) and pDC (K) was determined by flow cytometry. the expression of several surface markers (CD80, CD86, I-A/I-E, ILT3 and ICOSL) was assessed. Data represent the mean fluorescent intensity (MFI)±SEM of five independent experiments in each group (each individual data point is shown). (L) The apoptotic cancer cells (cleaved caspase 3+) were detected by immunohistochemistry and quantified using QuPath software. The number of positive cells was reported to tumor area (mm2). The scale bar represents 100 µm. Asterisks indicate statistically significant differences (*p<0.05; **p<0.01; ***p<0.001; ****p<0.0001). P values were determined using one-way ANOVA, followed by Bonferroni post-test (A, L), Fisher’s exact test (C, D) and one-way ANOVA followed by Dunnett’s multiple comparison post-test (F, G, H, I, J, K). ANOVA, analysis of variance; DC, dendritic cell; EP, ethyl pyruvate; HMGB1, high-mobility group box 1; i.p, intraperitoneal; METABRIC, Molecular Taxonomy of Breast Cancer International Consortium; pDC, plasmacytoid DC; RAP, RAGE antagonist peptide.
Figure 6
Figure 6
A significant fraction of HMGB1 contained in tumor-extruded fluids is in its oxidized form and displays RAGE-dependent tolerogenic properties. (A, B) The ROS accumulation in both breast (4T1, 67NR, EpRas) and lung (TC-1) cancer cells used in the present study was assessed by flow cytometry. N-acetylcysteine (5 mM) and tert-butyl hydroperoxide (100 µM) were used as negative and positive controls, respectively. Results represent the means±SEM of four independent experiments (each individual data point is shown). (C) The redox state of extracellular HMGB1 contained in tumor-extruded fluids was analyzed by Western blot. All samples were directly alkylated in order to ‘freeze’ the redox state of HMGB1 molecules. Recombinant HMGB1 (0.5 µg) incubated with either H2O2 or DTT (and then alkylated) were used as controls. (D) Oxidized/reduced-disulfide HMGB1 ratio (%) was calculated from the Western blot bands using ImageJ software. (E) DCs were incubated with terminally oxidized, fully reduced or disulfide HMGB1 for 24 hours before being stimulated with LPS for 24 hours. The expression of cell-surface molecules (CD80, CD83, CD86, HLA-DR, HLA-ABC and CCR7) was then measured by flow cytometry. All data were normalized to LPS-stimulated DC. Data represent the relative mean fluorescent intensity (MFI)±SEM of at least five independent experiments (each individual data point is shown). (F) DCs were incubated with terminally oxidized HMGB1 for 24 hours before being stimulated with LPS for 24 hours. When indicated, an inhibitor of RAGE (10 µM RAP) or TLR4 (2 µM LPS-RS) was added in the cell culture. The expression of DC activation markers was determined by flow cytometry. All data were normalized to LPS-stimulated DC. The relative MFI±SEM of 7 independent experiments are shown. Asterisks indicate statistically significant differences (*p<0.05, **p<0.01, ***p<0.001). P values were determined using one-way ANOVA, followed by Dunnett’s multiple comparison post-test (A, B, E, F). ANOVA, analysis of variance; DC, dendritic cell; HMGB1, high-mobility group box 1.

References

    1. Goodwin GH, Sanders C, Johns EW. A new group of chromatin-associated proteins with a high content of acidic and basic amino acids. Eur J Biochem 1973;38:14–19. 10.1111/j.1432-1033.1973.tb03026.x - DOI - PubMed
    1. Wang H, Bloom O, Zhang M, et al. . HMG-1 as a late mediator of endotoxin lethality in mice. Science 1999;285:248–51. 10.1126/science.285.5425.248 - DOI - PubMed
    1. Pullerits R, Jonsson I-M, Verdrengh M, et al. . High mobility group box chromosomal protein 1, a DNA binding cytokine, induces arthritis. Arthritis Rheum 2003;48:1693–700. 10.1002/art.11028 - DOI - PubMed
    1. Popovic K, Ek M, Espinosa A, et al. . Increased expression of the novel proinflammatory cytokine high mobility group box chromosomal protein 1 in skin lesions of patients with lupus erythematosus. Arthritis Rheum 2005;52:3639–45. 10.1002/art.21398 - DOI - PubMed
    1. Zong M, Bruton JD, Grundtman C, et al. . TLR4 as receptor for HMGB1 induced muscle dysfunction in myositis. Ann Rheum Dis 2013;72:1390–9. 10.1136/annrheumdis-2012-202207 - DOI - PubMed

Publication types

MeSH terms

Substances