. 2021 Mar 12;7(11):eabe7920.
doi: 10.1126/sciadv.abe7920. Print 2021 Mar.

Interplay between Pds5 and Rec8 in regulating chromosome axis length and crossover frequency

Affiliations

Interplay between Pds5 and Rec8 in regulating chromosome axis length and crossover frequency

Meihui Song et al. Sci Adv. .

Abstract

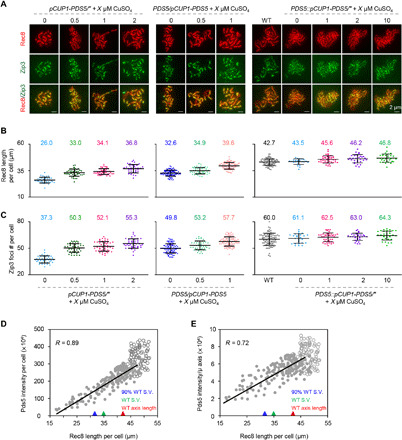
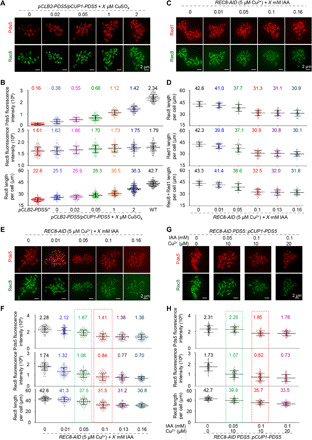
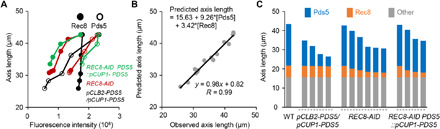
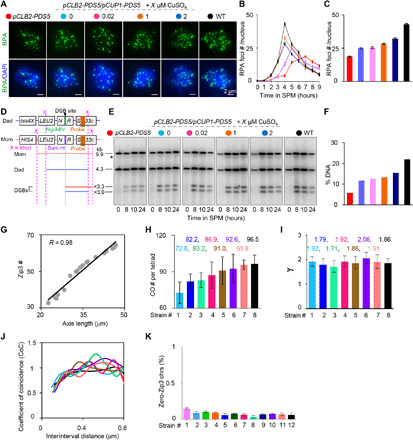
Meiotic chromosomes have a loop/axis architecture, with axis length determining crossover frequency. Meiosis-specific Pds5 depletion mutants have shorter chromosome axes and lower homologous chromosome pairing and recombination frequency. However, it is poorly understood how Pds5 coordinately regulates these processes. In this study, we show that only ~20% of wild-type level of Pds5 is required for homolog pairing and that higher levels of Pds5 dosage-dependently regulate axis length and crossover frequency. Moderate changes in Pds5 protein levels do not explicitly impair the basic recombination process. Further investigations show that Pds5 does not regulate chromosome axes by altering Rec8 abundance. Conversely, Rec8 regulates chromosome axis length by modulating Pds5. These findings highlight the important role of Pds5 in regulating meiosis and its relationship with Rec8 to regulate chromosome axis length and crossover frequency with implications for evolutionary adaptation.


Figures

Fig. 1
Fig. 1. Pds5 removal disrupts homolog pairing during meiosis.
(A) Representative images of Rec8 staining. Scale bar, 4 μm. (B to E) Quantification of the numbers of Rec8 lines (B), the total length of Rec8 lines per cell and corrected length with unpaired homologs (numbers in parentheses) (C), the average length of each Rec8 line per cell (D), and Pds5 fluorescence intensity (E) in WT and mutants. The numbers of nuclei measured from left to right, n = 105, 103, 104, 102, and 101, separately (B to E). pCLB2-PDS5-AID with 2 or 10 mM IAA compared with 0 mM IAA, P < 0.0001 (B, C, and E), P > 0.05 (D), t test. (F and G) Illustration of the tetO/TetR-GFP (F) and lacO/LacI-GFP (G) assays. (H) Representative images of the assay for homolog pairing and sister cohesion in the ndt80Δ background. A single GFP spot and two GFP spots indicate homologs are paired and unpaired, respectively. Sister cohesion defects are reflected by three or four GFP spots. (I and J) Quantification of homolog pairing and sister cohesion detected by tetO/TetR-GFP (H; n = 200, 203, 202, 205, and 200, separately) or LacO/LacI-GFP assay (I; n = 204, 200, 205, 201, and 201, separately). (K to N) Quantification of the number of Rec8 lines per cell (K), the corrected (in parentheses) and uncorrected total length of Rec8 lines per cell (L), the average length of each Rec8 line in individual cells (M), and the axis length of chromosome II (N), in cells with paired (one GFP focus) and unpaired (two GFP foci) chromosome II. Sample size, n = 58 (one GFP focus) and 68 (two GFP foci) (K to N). Error bar, means ± SD (B to E and K to N). P < 0.0001, t test (K to N).
Fig. 2
Fig. 2. Higher Pds5 levels are required for proper axis length and CO level than for homolog pairing.
(A) Representative images of Rec8 and Zip3 staining. Scale bar, 2 μm. (B to F) Quantification of the number of Rec8 lines per cell (B), the corrected (in parentheses) and uncorrected total length of Rec8 lines per cell (C), the total number of Zip3 foci per cell (D), the average length of each Rec8 line in individual cells (E), and the average number of Zip3 foci per Rec8 line from individual cells (F). Sample size, n = 103, 103, 103, 103, 101, 145, and 105, separately. Error bar, means ± SD (B to F).
Fig. 3
Fig. 3. Pds5 dosage-dependently regulates axis length.
(A) Representative images of Rec8 and Zip3 staining. Scale bar, 2 μm. (B and C) Quantification of the total length of Rec8 lines per cell (B) and the total number of Zip3 foci per cell (C). Sample size, n = 39, 44, 49, 41, 97, 47, 84, 105, 25, 41, 31, and 32, separately. Error bar, means ± SD (B and C). (D and E) Nuclei with longer axis have more Pds5 per nucleus (D) and per micrometer of the axis (E) as shown by Pearson’s correlation analysis. The trend lines and correlation coefficient were calculated on the basis of presented data (n = 268), except for data points from the strain with overexpressed Pds5 (circles). Triangles indicate the axis length and Pds5 intensity per nucleus (D) and per micrometer of the axis (E) in strains with 90% of WT level of spore viability (S.V.) (blue triangle), WT level of spore viability (green triangle), and WT axis length (red triangle).
Fig. 4
Fig. 4. The interplay between Pds5 and Rec8 in regulating axis length.
(A and B) The representative images (A) and quantifications (B) to show alterations in Pds5 abundance alter axis length in the same direction but only slightly alter Rec8 abundance. n = 80, 61, 62, 70, 67, 65, and 73, separately. (C and D) The representative images (C) and quantifications (D) showing chromosome axis can be reliably labeled and measured by either Rec8 or Red1 in Rec8 depletion mutants (Rec8 abundance is >40% of WT level) used in this study. n = 32, 30, 31, 44, 37, and 31, separately. (E and F) The representative images (E) and quantifications (F) show that decreasing Rec8 results in decreased Pds5 and axis length. n = 66, 66, 71, 67, 70, and 73, separately. (G and H) The representative images (G) and quantifications (H) show that increases in Pds5 increase axis length in Rec8 depletion mutants. n = 59, 60, 59, and 59, separately. Error bar, means ± SD (B, D, F, and H).
Fig. 5
Fig. 5. Quantification of the respective contributions of Pds5 and Rec8 abundance to axis length.
(A) Summary of Pds5 and Rec8 abundance and corresponding axis lengths in WT and various mutants. Data from pCLB2-PDS5/pCUP1-PDS5 strain without copper induction were excluded in this analysis to avoid the influence of homolog pairing defects. (B) Contributions of Pds5 and Rec8 abundance to axis length and correlation between observed and predicted axis lengths. (C) Contributions of Pds5 and Rec8 abundance to axis length in WT and various mutants.
Fig. 6
Fig. 6. Pds5 regulates recombination frequencies but does not impair the recombination process per se.
(A to C) Alterations in Pds5 protein levels alter RPA focus number. (A) Photos from the time point with maximal RPA focus number in each strain. Scale bar, 2 μm. (B) Quantification of RPA foci. (C) Maximal RPA focus number. Bar, SE (n = 3). SPM, sporulation medium. (D) Map of HIS4LEU2 hotspot locus. (E) Southern blot images for DSB assay at HIS4LEU2 locus. The asterisk, a possible DSB fragment from an additional DSB site. (F) Quantification of DSBs at 10 hours in SPM (DSBs accumulated to maximum levels in rad50S). % DNA is the percentage of total hybridizing DNA signal. (G) Zip3 focus number is highly correlated with axis length (data from Figs. 2 and 3). (H) Average CO number. Strains: pCUP1-PDS5/” with 0 μM (#1), 10 μM (#4), and 25 μM (#6) copper; PDS5/pCUP1-PDS5 with 0 μM (#2), 1 μM (#3), 5 μM (#5), and 10 μM (#7) copper; WT (#8). Bar, SD. n = 8, 6, 5, 7, 5, 7, 4, and 10 tetrads for strains #1 to #8, respectively. (I) γ values obtained from best-fit gamma distributions. Bar, 95% confidence interval. Strains and sample sizes are as in (H). (J) CoC analysis of CO interference. Data are from (H). (K) Frequencies of chromosomes absence of Zip3 focus. Strains: pCLB2-PDS5/pCUP1-PDS5 with 0.02 μM (#1), 0.05 μM (#3), 1 μM (#4), and 2 μM (#9) CuSO4; pCUP1-PDS5/” with 0 μM (#2), 0.5 μM (#6), 1 μM (#7), and 2 μM (#10) CuSO4; #5, #8, and 11# are PDS5/pCUP1-PDS5 with 0 μM (#5), 0.5 μM (#8), and 1 μM (#11) CuSO4; WT (#12). n = 100, 123, 112, 104, 98, 108, 95, 117, 104, 119, 103, and 115 nuclei, respectively. Bar, SE (n = 3). Compared with WT, P > 0.05, two-proportions test.

Similar articles

Cited by

References

    1. Hunter N., Meiotic recombination: The essence of heredity. Cold Spring Harb. Perspect. Biol. 7, a016618 (2015). - PMC - PubMed
    1. Zickler D., Kleckner N., Recombination, pairing, and synapsis of homologs during meiosis. Cold Spring Harb. Perspect. Biol. 7, a016626 (2015). - PMC - PubMed
    1. Cole F., Keeney S., Jasin M., Preaching about the converted: How meiotic gene conversion influences genomic diversity. Ann. N. Y. Acad. Sci. 1267, 95–102 (2012). - PMC - PubMed
    1. Bomblies K., Jones G., Franklin C., Zickler D., Kleckner N., The challenge of evolving stable polyploidy: Could an increase in “crossover interference distance” play a central role? Chromosoma 125, 287–300 (2016). - PMC - PubMed
    1. Veller C., Kleckner N., Nowak M. A., A rigorous measure of genome-wide genetic shuffling that takes into account crossover positions and Mendel’s second law. Proc. Natl. Acad. Sci. U.S.A. 116, 1659–1668 (2019). - PMC - PubMed

Publication types

LinkOut - more resources