. 2021 Mar 12;6(57):eabc9801.
doi: 10.1126/sciimmunol.abc9801.

The transcription factor Bcl11b promotes both canonical and adaptive NK cell differentiation

Affiliations

The transcription factor Bcl11b promotes both canonical and adaptive NK cell differentiation

Tim D Holmes et al. Sci Immunol. .

Abstract

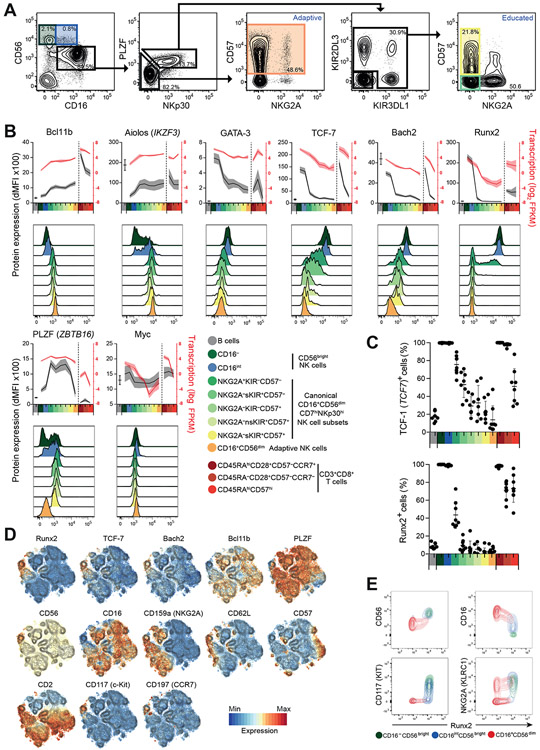
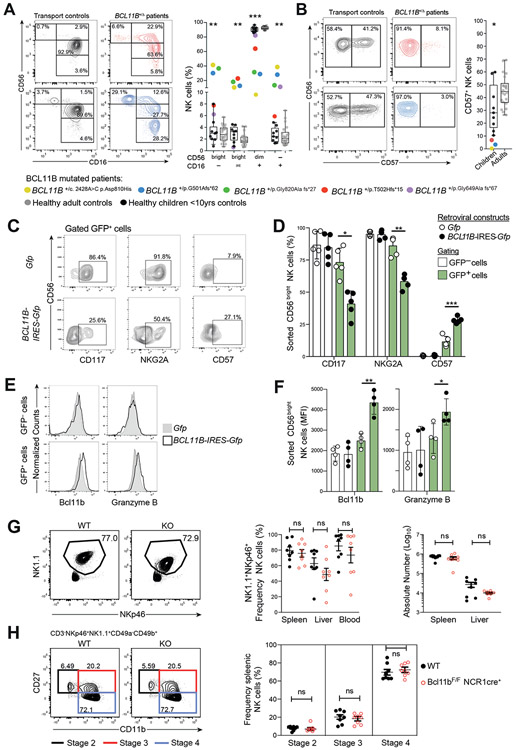
Epigenetic landscapes can provide insight into regulation of gene expression and cellular diversity. Here, we examined the transcriptional and epigenetic profiles of seven human blood natural killer (NK) cell populations, including adaptive NK cells. The BCL11B gene, encoding a transcription factor (TF) essential for T cell development and function, was the most extensively regulated, with expression increasing throughout NK cell differentiation. Several Bcl11b-regulated genes associated with T cell signaling were specifically expressed in adaptive NK cell subsets. Regulatory networks revealed reciprocal regulation at distinct stages of NK cell differentiation, with Bcl11b repressing RUNX2 and ZBTB16 in canonical and adaptive NK cells, respectively. A critical role for Bcl11b in driving NK cell differentiation was corroborated in BCL11B-mutated patients and by ectopic Bcl11b expression. Moreover, Bcl11b was required for adaptive NK cell responses in a murine cytomegalovirus model, supporting expansion of these cells. Together, we define the TF regulatory circuitry of human NK cells and uncover a critical role for Bcl11b in promoting NK cell differentiation and function.


Figures

Figure 1.
Figure 1.. Transcriptional profiling of human blood NK cell and CD8+ T cell subset
Ten distinct NK and CD8+ T cell subsets from five healthy adult volunteers were sorted for RNA-seq analyses. (A) Sorting strategy of a representative donor. NK or CD8+ T cells were enriched prior to FACS. Adaptive NK cells were sorted as CD57+NKp30loNKG2C+ (donors 1, 3 and 5) or CD57+NKp30loCD7lo (donors 2 and 4). (B) Principal component analysis and (C) dendrogram of the top 500 highly variable transcripts among all ten cytotoxic lymphocyte subsets. (D-F) 2,233 NK cell differentially expressed (DE genes (FDR < 0.05) were defined based on major NK cell subset comparisons: CD16D56bright versus CD56dimNKG2A+KIRCD57 NK cells; CD56dimNKG2A+KIRCD57 versus CD56dimNKG2Aself-KIR+CD57+ NK cells; or CD56dimNKG2Aself-KIR+CD57+ versus adaptive NK cells. The DE genes were stratified into 10 clusters based on expression profiles across all subsets. (D) Expression profiles and heatmaps of each cluster. (E) KEGG pathway analysis of clusters. (F) Variance in gene expression versus average gene expression levels of each cluster across CD16CD56bright, canonical early and late CD56dim, and adaptive NK cell subsets. Genes with FDR < 0.01 or < 0.05 in ≥1 comparison are marked with filled or open circles, respectively. TFs are in red.
Figure 2.
Figure 2.. Epigenetic landscapes of human NK cell subsets
NK and CD8+ T cell subsets were sorted for ATAC-seq analysis. Adaptive NK cells were sorted as CD57+NKp30loNKG2C+ (donors 1 and 3) or CD57+NKp30loCD7lo (donors 2 and 6). (A) Summary of unique, variable, or common ATAC-seq peaks in NK cell subsets (n=4 donors, average 56,383 peaks per subset). (B) Principal component analysis and (C) dendrogram of the top 500 highly variable ATAC-seq peaks among all nine lymphocyte subsets. (D) Genomic distribution of all NK cell ATAC-seq peaks. (E-G) Genomic classifications of differentially accessible (DA) ATAC-seq peaks (FDR < 0.05) within selected NK cell (E) major (>3000) and (F) minor (<3000) comparisons, and (G) comparisons of adaptive NK cells versus CD8+ T cells. (H-J) Plots show promoter specific fold change (FC) for DA ATAC-seq peaks (FDR < 0.05) versus FC in RNA-seq expression in comparisons of (H) CD16CD56bright (dark green) versus canonical CD56dimNKG2A+KIRCD57 (early; light green), (I) early versus canonical CD56dimNKG2AsKIRCD57+ (late; yellow), and (J) late versus adaptive CD56dimNKp30lowCD57+ (orange) NK cell subsets. DE genes with FDR < 0.01 or < 0.05 in at least one pairwise comparison are marked with black filled or open circles, respectively. TF-encoding genes are red.
Figure 3.
Figure 3.. Correlation of regulated active enhancers to gene transcription during NK cell differentiation
(A) Summary of DA ATAC-seq peaks (FDR <0.05) residing within active enhancers (AE). (B-D) SE identified from density of H3K27ac signal versus rank (716-1270 SE identified) detected using ChIP-seq (n=2 donors). (B) Hockey stick plots indicate inflection point and examples of unique SE. (C) Venn diagram depicting common and unique SE. (D) Variation of enhancer rank across all NK cell subsets. Dotted line represents number of in all NK cell subsets, shaded area marking non-SEs, with ranking ≥1300 assigned as 1300. (E-G) AE signals relative to chromatin accessibility and gene expression in (E) CD16CD56bright versus early, (F) early versus late, and (G) late versus adaptive NK cell subset comparisons. Absolute highest FC DA ATAC-seq peak (FDR < 0.05) assigned to a single gene. Large circles indicate RNA-seq FC > 1.5 log2. (H) Individual DA ATAC-seq peaks (FDR < 0.05) assigned to DE TF genes (FDR < 0.05) with FC > 2 in CD56bright to early, and FC > 1.5 in early to late as well as late to adaptive NK cell transitions. (I) TF motif enrichment within DA ATAC-seq peaks (FDR < 0.05) in AE across NK and T cell subsets normalized to peak length, average NK cell frequency with maximum/minimum score > 2 (n=60) then grouped by similarity according to fixed Euclidean distance (n=26).
Figure 4.
Figure 4.. Continuum of transcription factor expression in NK cell differentiation
(A-E) Intracellular flow cytometric evaluation of selected TFs. (A) Representative gating of NK cell subsets with inclusion of additional CD16intCD56bright cell subset (blue). (B) Graphs depict dMFI values, B-cell values added for comparison, n=8 healthy donors. Histograms from one representative donor. (C) Frequencies of cells expressing specific TFs within B, NK and CD8+ T cell subsets. (D) t-SNE analysis of gated CD3CD56+ NK cells. (E) Plots depict expression in gated CD16CD56bright CD16intCD56bright or CD56dim NK cell subsets from a representative donor.
Figure 5.
Figure 5.. Reciprocal transcription factor regulation of NK cell differentiation
ChIP-seq for TFs GATA-3, Runx2, Bach2, Bcl11b, PLZF, and Helios were performed on isolated human NK cells from individual representative donors. (A-C) Network analysis representing TF downstream targets identified from TF ChIP-seq experiments combined with RNA-seq and ATAC-seq data in (A) CD16CD56bright versus early, (B) early versus late, and (C) canonical late versus adaptive NK cells. Edge color represents log2 FC in chromatin accessiblity at TF ChIP-seq locus with respect to pairwise subset comparisons (FDR < 0.05) and where multiple ChIP-seq peaks mapped to different DA ATAC-seq peaks, an average value is shown. Edge thickness represents number of ChIP-seq peaks associated with each gene. Node color represents log2 FC of proximally associated genes (< 60 kb) within pairwise subset comparisons (DE RNA-seq FC > 1 and RNA-seq log2 FPKM expression > −11).
Figure 6.
Figure 6.. Bcl11b regulates canonical NK cell differentiation
(A) NK cells from Bcl11b+/Δ patients (colored) compared to healthy, age-matched children (grey circles) or adult (black circles) controls gated on CD3 lymphocytes or (B) the frequency of CD16+CD56dim cells expressing CD57. Two-tailed paired Student’s t-test between Bcl11b+/Δ patients and age-matched children. (C-F) Frequency NK cells expressing CD117, NKG2A CD57, Bcl11b and Granzyme B following ectopic expression of Bcl11b. Sorted CD56bright NK cells were transduced with retrovirus encoding either GFP (Gfp) or Bcl11b and GFP (BCL11B-IRES-Gfp), and cultured for 7 days with IL-15 and irradiated EL08-1D2 feeder cells. (C) Protein expression after culture in a representative donor. (D) Summary of frequency of GFP or GFP+ cells. Bars indicate mean and lines SD, n=5 independent donors. (E) Flow cytometry expression of Bcl11b and Granzyme B from a example donor. (F) Summary of Bcl11b and Granzyme B expression. Two-tailed paired Student’s t-test, (n=4 donors). (G) Frequency and absolute numbers of NK cells from either WT or Bcl11b floxed KO NCR1+ cells assessed in murine spleen, liver and blood. Two-tailed Student’s t test applied, n=8 mice per group. (H) Mouse late stages of NK cell development compared between WT and Bcl11b KO mice. Two-tailed Student’s t test applied, n=8 mice per group.
Figure 7.
Figure 7.. Bcl11b is associated with classical and T-cell associated phenotypes of adaptive NK cells
(A) Bcl11b-target genes correlating adaptive NK cell and effector CD8+ T cell differentiation. (B) GSEA of Bcl11b target genes over-represented during adaptive NK cell differentiation (FDR < 0.1). Bcl11b-induced or repressed gene sets based on human orthologues of target genes identified in Bcl11b knock-out mice, from Hosokawa et al. (31), and assessed in canonical late CD56dim to adaptive NK cells. Examples listed. (C) Bcl11b ChIP-qPCR of sort purified canonical CD56dimCD57+NKG2C and adaptive CD56dimCD57+NKG2C+ NK cells. PCR targets reside within indicated DA chromatin loci. Expression normalized to ChIP input. Paired Student’s t-test, n=3. Induction of LAG-3 in NKG2C+ adaptive NK cells after stimulation for 24 hours with plate-bound anti-CD16 or anti-NKG2C antibody. (D-E) Representative flow cytometry plots (D) and summary of LAG-3 induction at 24 hours of stimulation (n=6). (E) NK cells gated as PLZF and CD56dimCD16+. Paired Student’s t-test. (F) Protein expression of intracellular CD3ε in 196 healthy donors with CMV seropositive donors (filled) and seronegative (open). Positive expression determined from 3x SD of mean CMV seronegative donors (red line). (G) Frequencies of expression in canonical CD56dimPLZFhigh (yellow) and adaptive CD56dimPLZFlow (orange) NK cells. Summary of intracellular CD3ε+ adaptive NK cell populations. Paired Student’s t-test.
Figure 8.
Figure 8.. Bcl11b is critical to adaptive NK cell responses to MCMV
(A) Relative transcripts of Bcl11b following RNA-seq performed on mouse Ly49H+ NK cell population throughout the course of murine CMV infection. (B) WT Ncr1+Cre+ CD45.1+CD45.2+ or KO NK cells from Bcl11bF/F Ncr1+Cre+ CD45.1CD45.2+ were isolated from mouse spleen and adoptively co-transferred in equal numbers into Ly49H-deficient (Klra8−/−) recipient mice. Ly49H+ NK cells were compared at 7 and 28 days post-infection (DPI), n=13 and n=4 mice respectively, Representative flow cytometry plot shown from blood harvested NK cells. (C) Comparison of Ly49H+ transferred cells in blood, spleen and liver. Two-tailed paired Student’s t-test. (D-G) RNA-seq of WT and KO NK cells isolated after adoptively transferred into Ly49H mice infected with MCMV. Splenic Ly49H+ WT and KO NK cells were sorted for RNA-seq 7 days post infection, n=3 mice. (D) Heatmap of the top 100 DEGs. (E) Gene set enrichment analysis showing enrichment of cell cycle associated genes in WT NK cells. (F) Heatmap of selected NK receptors or effector genes (G) that were dependent on Bcl11b. FDR-adjusted P values were calculated using the Benjamini-Hochberg method, significance cutoff adjusted to p < 0.10.

Comment in

References

    1. Vivier E, Raulet DH, Moretta A, Caligiuri MA, Zitvogel L, Lanier LL, Yokoyama WM, Ugolini S, Innate or adaptive immunity? The example of natural killer cells. Science 331, 44–49 (2011). - PMC - PubMed
    1. Spits H, Artis D, Colonna M, Diefenbach A, Di Santo JP, Eberl G, Koyasu S, Locksley RM, McKenzie AN, Mebius RE, Powrie F, Vivier E, Innate lymphoid cells--a proposal for uniform nomenclature. Nature reviews. Immunology 13, 145–149 (2013). - PubMed
    1. Lanier LL, Evolutionary struggles between NK cells and viruses. Nat Rev Immunol 8, 259–268 (2008). - PMC - PubMed
    1. Parham P, Moffett A, Variable NK cell receptors and their MHC class I ligands in immunity, reproduction and human evolution. Nature reviews. Immunology 13, 133–144 (2013). - PMC - PubMed
    1. Cannon MJ, Congenital cytomegalovirus (CMV) epidemiology and awareness. J Clin Virol 46 Suppl 4, S6–10 (2009). - PubMed

Publication types

MeSH terms