. 2021 Apr 14;41(15):3366-3385.
doi: 10.1523/JNEUROSCI.1948-20.2021. Epub 2021 Mar 12.

Harnessing the Benefits of Neuroinflammation: Generation of Macrophages/Microglia with Prominent Remyelinating Properties

Affiliations

Harnessing the Benefits of Neuroinflammation: Generation of Macrophages/Microglia with Prominent Remyelinating Properties

Manoj Kumar Mishra et al. J Neurosci. .

Abstract

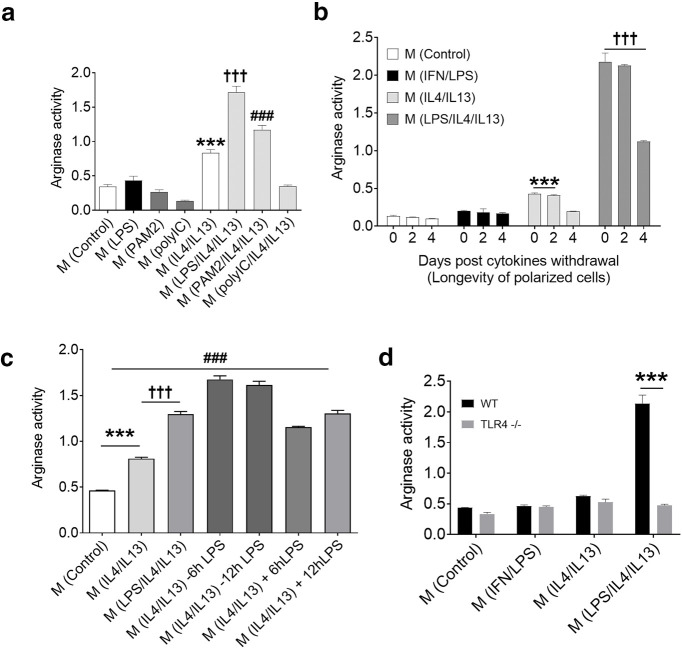
Excessive inflammation within the CNS is injurious, but an immune response is also required for regeneration. Macrophages and microglia adopt different properties depending on their microenvironment, and exposure to IL4 and IL13 has been used to elicit repair. Unexpectedly, while LPS-exposed macrophages and microglia killed neural cells in culture, the addition of LPS to IL4/IL13-treated macrophages and microglia profoundly elevated IL10, repair metabolites, heparin binding epidermal growth factor trophic factor, antioxidants, and matrix-remodeling proteases. In C57BL/6 female mice, the generation of M(LPS/IL4/IL13) macrophages required TLR4 and MyD88 signaling, downstream activation of phosphatidylinositol-3 kinase/mTOR and MAP kinases, and convergence on phospho-CREB, STAT6, and NFE2. Following mouse spinal cord demyelination, local LPS/IL4/IL13 deposition markedly increased lesional phagocytic macrophages/microglia, lactate and heparin binding epidermal growth factor, matrix remodeling, oligodendrogenesis, and remyelination. Our data show that a prominent reparative state of macrophages/microglia is generated by the unexpected integration of pro- and anti-inflammatory activation cues. The results have translational potential, as the LPS/IL4/IL13 mixture could be locally applied to a focal CNS injury to enhance neural regeneration and recovery.SIGNIFICANCE STATEMENT The combination of LPS and regulatory IL4 and IL13 signaling in macrophages and microglia produces a previously unknown and particularly reparative phenotype devoid of pro-inflammatory neurotoxic features. The local administration of LPS/IL4/IL13 into spinal cord lesion elicits profound oligodendrogenesis and remyelination. The careful use of LPS and IL4/IL13 mixture could harness the known benefits of neuroinflammation to enable repair in neurologic insults.

Keywords: macrophages; microglia; neuroinflammation; oligodendrocyte; remyelination.


Figures

Figure 1.
Figure 1.
Features of M(LPS/IL4/IL13) macrophages. a, Mouse M(LPS/IL4/IL13) macrophages after 24 h did not secrete detectable ELISA levels of IL12 (n = 4; F(3,11) = 2.92; ***p = 0.0001; one-way ANOVA) and had substantially elevated IL10 (n = 4; F(3,12) = 2303; ***p < 0.0001; ###p < 0.0001; †††p < 0.0001; one-way ANOVA, post hoc Tukey). Alterations of other cytokines and chemokines in M(LPS/IL4/IL13) are displayed in Extended Data Figure 1-1, as are transcripts encoding markers of regulatory cells (Extended Data Figure 1-2). Microglia (Mi) are similarly altered by the LPS/IL4/IL13 mixture (Extended Data Figure 1-3). b, M(LPS/IL4/IL13) at 24 h had higher Arg-1 level (Western blot) than M(IL4/IL13), whereas iNOS was not induced. c, Nitrite production was highest in M(IFN/LPS) (n = 4; F(3,8) = 249.9; ***p = 0.0001; *p = 0.0212 compared with control; **p = 0.0094; one-way ANOVA, post hoc Tukey). d, Arg-1 enzyme activity was most elevated by M(LPS/IL4/IL13); n = 4; F(3,8) = 228.1; ***p = 0.0001; ###p = 0.0001 compared with control; †††p = 0.0001; one-way ANOVA, post hoc Tukey). e, Immunostaining showed upregulation of iNOS and CD204 in all F4/80-positive BMDM after 24 h in M(IFN/LPS) and M(LPS/IL4/IL13) conditions, respectively. Scale bar, 100 µm. f, M(LPS/IL4/IL13) macrophages were highly motile in a chemotaxis assay (n = 4; F(3,12) = 73.7; ***p = 0.0001; †††p = 0.0001; one-way ANOVA, post hoc Tukey) and very phagocytic (g) (n = 3; F(3,8) = 32; ***p = 0.0003; †††p = 0.0006; one-way ANOVA, post hoc Tukey). h-j, Cocultures of mouse neurons (microtubule-associated protein-2 [MAP2]) and BMDM (h, and top panels in j), or microglia and OPCs (i, bottom panels in j, O4 staining) were exposed to the respective stimuli for 24 h, and toxicity was measured by the number of remaining neurons (h; n = 4; F(3,12) = 27.01; *p = 0.0109; **p = 0.0094; †p = 0.0144; one-way ANOVA, post hoc Tukey), or (i) oligodendrocytes (n = 4; F(3,8) = 20.13; ***p = 0.0004; one-way ANOVA, post hoc Tukey). Scale bar, 100 µm. All histograms are mean ± SEM and reproduced in at least another experiment.
Figure 2.
Figure 2.
Macrophages were treated with TLR agonists in the presence or absence of IL4/IL13; then arginase activity was measured (a). TLR2 (PAM2) and TLR4 (LPS) agonists were able to significantly increase arginase activity while a TLR3 agonist (polyIC) did not have this response (n = 3; F(7,16) = 116.6; ***p = 0.0001; ###p = 0.0001; †††p = 0.0001; one-way ANOVA). We assessed the longevity of M(LPS/IL4/IL13) cells (b). These cells lived longer and generated high level of arginase activity even after removal of cytokines (n = 3; ***p = 0.001; ###p = 0.0001; †††p = 0.0001; two-way ANOVA, Tukey's multiple comparison). We also evaluated the pretreatment or post-treatment or cotreatment of LPS with IL4/IL13 exposure to BMDMs (c). We observed that, in all conditions (pretreatment or post-treatment or cotreatment of LPS), arginase activities were higher than control or of M(IL4/IL13) (n = 3; F(6,14) = 236.1; ***p = 0.0001; ###p = 0.0001; †††p = 0.0001; one-way ANOVA). Next, we compared the arginase activity in WT and TLR4−/− mice (d). M(LPS/IL4/IL13) response was abrogated in TLR4−/− mice (n = 3; ***p = 0.0001; two-way ANOVA, Sidak's multiple comparison).
Figure 3.
Figure 3.
Signaling pathways that generate the M(LPS/IL4/IL13) phenotype. Differential expression of genes (log2 fold change) in macrophages revealed by (a) hierarchical clustering (GSE138263) between treatments (6 h exposure, n = 2). Levels of particular transcripts are displayed in Extended Data Figure 3-1. b, Pathway analyses highlighted the central role of CREB signaling in generation of the M(LPS/IL4/IL13) phenotype. c, Immunoblot confirmed the elevated phosphorylation of CREB protein in BMDM after 10 or 30 min exposure to IFN/LPS or LPS/IL4/IL13. d, Inhibiting CREB signaling reduced Arg-1 enzyme activity in M(LPS/IL4/IL13) (n = 4; F(2,9) = 17.52; *p = 0.0180; ***p = 0.0006; one-way ANOVA, post hoc Tukey). e, KEGG pathway analysis displayed the prominent signaling pathways from proteomics of M(LPS/IL4/IL13). f, Inhibition of upstream kinases that can influence activation of CREB or STAT signaling prevented the elevation of Arg-1 enzyme activity in M(LPS/IL4/IL13) (g; n = 4; F(6,14) = 513.8; *p = 0.0268; ***p = 0.0001 compared with M(LPS/IL4/IL13; one-way ANOVA, post hoc Tukey). g, The importance for MyD88 pathway in generating M(LPS/IL4/IL13), as the elevation of Arg-1 enzyme activity after stimulation was lost in MyD88−/− but not TRIF−/− BMDM (n = 4; **p = 0.0042; ***p = 0.0001; #p = 0.0308; †p = 0.0463; †††p = 0.0001; two-way ANOVA). h, Representative immunoblot demonstrated the differential activation profile of phosphorylated STATs, where STAT1 and 3 were elevated in M(IFN/LPS), whereas STAT6 was activated in either M(IL4/IL13) or M(LPS/IL4/IL13).
Figure 4.
Figure 4.
a-e, ChIP-seq analyses reveal stimulus-dependent gain of H3K27 acetylation at genomic regions. UCSC data visualization depicting acetylation levels at regions that are (a) insensitive to macrophage polarization (i.e., control region), (b) responsive to macrophage stimulations, (c) responsive to LPS, (d) responsive to IL4/IL13, and (e) responsive to LPS/IL4/IL13. f, Dominant DNA motifs enriched at regions responsive to LPS/IL4/IL13 compared with other polarization mode.
Figure 5.
Figure 5.
The omics signature of M(LPS/IL4/IL13) suggests a phenotype conducive for repair responses. a, Selected transcripts from microarray that were highly elevated in M(LPS/IL4/IL13). b, The fold change of transcripts of proteases elevated in M(LPS/IL4/IL13) versus M(IL4/IL13). c, The high amount of MMP-9 in M(LPS/IL4/IL13) was corroborated by gelatin zymogram and (d) by quantitative PCR for Adamts4 (n = 3; F(3,8) = 18.2; **p = 0.0038; ***p = 0.0005; one-way ANOVA, post hoc Tukey). e, Transcripts for several regulatory cytokines and receptors for IL4 and IL13 were upregulated in M(LPS/IL4/IL13), as are many enzymes and growth factors (f). As the microarray analyses that resulted in a, e, f were from two samples per group and where the results represent the mean of two samples, statistical comparisons have not been conducted as the n of 2 per group would lack statistical validity. g, M(LPS/IL4/IL13) produced the highest amount of HBEGF (n = 3; F(3,8) = 48.86; ***p = 0.0001; †††p = 0.0001; one-way ANOVA, post hoc Tukey). Conditioned media from BMDMs were evaluated by GC-MS (h) and NMR spectroscopy (i,j). Cells activated with LPS, regardless of the presence or absence of IL4/IL13, had high amounts of (h,i) lactate (n = 3; F(3,8) = 741.8; ***p = 0.0001; †††p = 0.0001; ###p = 0.0001; one-way ANOVA, post hoc Tukey), whereas (j) ornithine is elevated only in M(LPS/IL4/IL13) (n = 3; F(3,134) = 571.8; ***p = 0.0001; †††p = 0.0001; one-way ANOVA, post hoc Tukey). The ornithine elevation in M(LPS/IL4/IL13) is emphasized in Extended Data Figure 5-1. M(LPS/IL4/IL13) and M(IL4/IL13) showed high OCR reflecting mitochondrial activity (k,l). m, O4 staining for OPCs in growth-deficient medium at two different magnifications. Scale bar, 100 µm. n, The combination of HBEGF and lactate for 24 h was very permissive for mean outgrowth of OPCs (n = 4; F(2,9) = 13.84; *p = 0.0368; ***p = 0.0014; one-way ANOVA, post hoc Tukey) and also contributed to differentiation of OPC into MBP+ oligodendrocytes (m,o) (n = 4; *p = 0.046; **p = 0.0024; Kruskal–Wallis test).
Figure 6.
Figure 6.
a, Proteomics workflow. Macrophages were activated for 24 h; then cells were lysed and processed for proteomics (n = 4, for each condition). Data were obtained from LC/MS/MS and were analyzed on MaxQuant. b, Network analysis by STRING (https://string-db.org/) demonstrated the enrichment of molecules involve in tricarboxylic acid (TCA) cycle (red), metabolic pathway (blue), and amino acid biosynthesis (green) in M(LPS/IL4/IL13) group compared with M(IL4/IL13). c, Network analysis revealed the enrichment in antioxidant molecules (red) and proteins involve in glutathione metabolism (blue). d, Further analysis determined increase in proteins involved in phagocytic machinery, such as phagosome formation (red) and lysosome increase (blue). Western blot detected changes to selected proteins are displayed in Extended Data Figure 6-1.
Figure 7.
Figure 7.
Experimental design and activation of macrophages/microglia in vivo. a, The demyelination model whereby lysolecithin was locally deposited between T3 and T4 vertebrae in the dorsal column of the spinal cord of mice on day 0. On day 3, after reopening of the suture, 1 µl of test solutions was locally deposited at the same place. b, The day 3 time point was selected because the macrophage/microglia representation was increased at the lesion site as suggested by the presence of red/green cells (i.e., CCR2-RFP and CX3CR1-GFP, indicating mainly, but not exclusively, monocyte-derived macrophages and microglia, respectively). c, The experimental timeline for the in vivo experiment. Mice were killed 7 d following lysolecithin demyelination (and 4 d after local deposition of test solutions). d, Representative images of 5 mice per group are displayed for eriochrome cyanine and neutral red-stained section where demyelination at 7 d is comparable across all the groups by one-way ANOVA (e). f, Mice had similar extent of macrophages/microglia representation (Iba1) at the lesion site. g, The staining within the lesioned dorsal column. IFN/LPS-treated mice had iNOS representation while more CD204 (but not iNOS) was found in LPS/IL4/13-treated animals. Scale bar, 100 µm. h, i, Colocalization analyses were performed across the treatment group for iNOS and F4/80 (n = 3-5; F(3,12) = 34.08; ****p = 0.0001; one-way ANOVA, post hoc Tukey) and also for CD204 and Iba1 (n = 3-5; F(3,11) = 25.4; *p <0.05; ***p < 0.001; ****p = 0.0001; one-way ANOVA, post hoc Tukey). j, The staining of Arg-1 within the lesion area of CX3CR1CreER/+:Rosa26tdTom/+ mice; Arg-1+ cells were more numerous in LPS/IL4/IL13-treated group and localized to (k) microglia (n = 3 or 4; df = 5; *p = 0.0117; two-tailed t test) and (l) monocyte-derived macrophages (n = 3 or 4; df = 5; *p = 0.0121; two-tailed t test). Other examples of high-magnification images with IMARIS rendering to present iNOS and Arg-1 within macrophages and microglia in the lesioned spinal cord are displayed in Extended Data Figure 7-1.
Figure 8.
Figure 8.
The application of the LPS/IL4/IL13 mixture to a demyelinating lesion in mice promotes oligodendrogenesis. a, Cells of the oligodendrocyte lineage were quantified at lesion site 7 d after demyelination using immunohistochemistry for olig2 (red) and nuclear yellow (blue). a, c, Number of olig2-positive cells was quantified across the different treatment groups at the lesion site in the dorsal column (n = 3; F(3,8) = 17.14, *p = 0.0487; †p = 0.0190; one-way ANOVA, post hoc Tukey). Scale bar, 100 µm. b, d, The triple staining of olig2 (green), PDGFR α (marker of precursor cells, gray), and CC1 (mature oligodendrocytes, red) shows that the CC1 representation was highest in LPS/IL4/13 group (n = 4; *p = 0.0126; ***p = 0.0001; †††p = 0.0001; one-way ANOVA, post hoc Tukey). Scale bar, 100 µm.
Figure 9.
Figure 9.
Characteristics of the lesion microenvironment following LPS/IL4/IL13 treatment. a, Ex vivo real-time imaging of the spinal cord of Cx3cr1GFP/+:Thy1YFP+ mice with myelin labeled by Nile Red. b, CX3CR1GFP/+ macrophages in lesions have high- or low-intensity signal, and these were quantitated within lesions. Scale bar, 20 µm. Only demyelinated mice administered saline or LPS/IL4/IL13 within lesions were examined because of the complexities of these experiments. There was a trend toward an increase in the mean number of macrophages/microglia (c) following LPS/IL4/IL13 treatment, and the latter elicited GFP+ cells that were larger (d,e) and were more migratory (f,g), depicting surveillance activity (Plemel et al., 2018), within the area of demyelination (n = 38-100, t test stats). *p < 0.05; **p < 0.01; ***p < 0.001; #p < 0.05. Imaris surface rendering and analysis of Nile Red within cells as an index of phagocytosis (scale bars: 20 µm; zoomed in image, 5 µm for) (h) shows that the percentage of macrophages/microglia that have engulfed myelin debris is similar (i) between saline and LPS/IL4/IL13 treatment, but that the latter promoted the extent of myelin engulfment/phagocytosis (j) within macrophages/microglia (n = 3; t = 3.242, df = 4, F(2,2) = 4.117; *p = 0.0316; unpaired t test, two-tailed). k, Staining for versican V1 2 d after treatment (d 5 after demyelination) shows deposition of this inhibitor of OPCs (Keough et al., 2016) within lesions in all groups, but expression was least in the LPS/IL4/IL13 group, indicating either reduced deposition or enhanced removal. Scale bar, 100 µm. l, The mean fluorescence intensity was quantified across the treatment group for versican V1 (n = 3-5; F(3,11) = 9.36; **p < 0.01; one-way ANOVA, post hoc Tukey). The dorsal half of a 3 mm coronal block of spinal cord containing the demyelinated dorsal column from saline or LPS/IL4/IL13 groups was homogenized for GC-MS analysis (m); OPLS-DA score scatter plot shows the two groups to be different (red represents LPS/IL4/IL13; blue represents saline; each circle represents a different mouse, R2 = 0.801, Q2 = 0.667) (n). The differential metabolites displayed in l show elevation (right shift) or reduction (left). Finally, tissue homogenates subjected to HBEGF ELISA showed that LPS/IL4/IL13 increased this growth factor (o) within lesions (n = 5; F(2,11) = 4.73; *p = 0.0265; one-way ANOVA, post hoc Tukey). All histograms are mean ± SEM.
Figure 10.
Figure 10.
The LPS/IL4/IL13 treatment promotes remyelination. a, A cross-sectional toluidine blue-stained semithin section of the dorsal column of white matter (scale bar, 10 µm) at d 21 following lysolecithin injury shows more remyelinated profile in LPS/IL4/IL13-treated group, and this was corroborated by electron micrographs. Scale bar, 1 µm. b, c, Blinded rank order analysis (n = 4, one-way ANOVA, Kruskal–Wallis test; *p = 0.0481) of toluidine blue-stained semithin sections document semiquantitatively the highest degree of remyelination in LPS/IL4/IL13 treatment group. d, 200 axons were counted per treatment group to confirm remyelination. The most abundant remyelination was found in electron micrographs of LPS/IL4/IL13 treatment where the % axons remaining demyelinated was least, and this was verified by g-ratio analyses of remyelinated axons where in linear regression, the lower the y intercept, the thicker the myelin sheath (linear regression, F(3,795) = 79.66, p < 0.0001). e, We further analyzed the g-ratio based on binning of the axon diameters in three categories (<1, 1-2, and >2 µm). The effect of LPS/IL4/IL13 on g-ratio (myelin thickness) was significant across axons of all diameters. *p < 0.05; **p = 0.01; ****p < 0.00001; Tukey's multiple comparisons test.

Similar articles

Cited by

References

    1. Bieber AJ, Kerr S, Rodriguez M (2003) Efficient central nervous system remyelination requires T cells. Ann Neurol 53:680–684. 10.1002/ana.10578 - DOI - PubMed
    1. Bligh EG, Dyer WJ (1959) A rapid method of total lipid extraction and purification. Can J Biochem Physiol 37:911–917. 10.1139/o59-099 - DOI - PubMed
    1. Bogie JF, Grajchen E, Wouters E, Garcia Corrales A, Dierckx T, Vanherle S, Mailleux J, Gervois P, Wolfs E, Dehairs J, Van Broeckhoven J, Bowman AP, Lambrichts I, Gustafsson JA, Remaley AT, Mulder M, Swinnen JV, Haidar M, Ellis SR, Ntambi JM, et al. . (2020) Stearoyl-CoA desaturase-1 impairs the reparative properties of macrophages and microglia in the brain. J Exp Med 217:e20191660. - PMC - PubMed
    1. Burgess M, Wicks K, Gardasevic M, Mace KA (2019) Cx3CR1 expression identifies distinct macrophage populations that contribute differentially to inflammation and repair. Immunohorizons 3:262–273. 10.4049/immunohorizons.1900038 - DOI - PubMed
    1. Church JS, Milich LM, Lerch JK, Popovich PG, McTigue DM (2017) E6020, a synthetic TLR4 agonist, accelerates myelin debris clearance, Schwann cell infiltration, and remyelination in the rat spinal cord. Glia 65:883–899. 10.1002/glia.23132 - DOI - PMC - PubMed

Publication types

MeSH terms

Grants and funding

LinkOut - more resources