. 2021 Mar 12;12(3):262.
doi: 10.1038/s41419-021-03552-8.

Transcriptional profiling reveals the transcription factor networks regulating the survival of striatal neurons

Affiliations

Transcriptional profiling reveals the transcription factor networks regulating the survival of striatal neurons

Lin Yang et al. Cell Death Dis. .

Abstract

The striatum is structurally highly diverse, and its organ functionality critically depends on normal embryonic development. Although several studies have been conducted on the gene functional changes that occur during striatal development, a system-wide analysis of the underlying molecular changes is lacking. Here, we present a comprehensive transcriptome profile that allows us to explore the trajectory of striatal development and identify the correlation between the striatal development and Huntington's disease (HD). Furthermore, we applied an integrative transcriptomic profiling approach based on machine learning to systematically map a global landscape of 277 transcription factor (TF) networks. Most of these TF networks are linked to biological processes, and some unannotated genes provide information about the corresponding mechanisms. For example, we found that the Meis2 and Six3 were crucial for the survival of striatal neurons, which were verified using conditional knockout (CKO) mice. Finally, we used RNA-Seq to speculate their downstream targets.


Conflict of interest statement

The authors declare no competing interests.

Figures

Fig. 1
Fig. 1. Overview of the experimental design.
Firstly, five time points of mRNA in the striatum or LGE of developing mice were measured using RNA-Seq. Then, the raw transcriptome data were pre-processed to obtain the DEGs, which were divided into two parts (see ‘Methods’): PEGs and CEGs. Secondarily, the functional TF networks of CEGs were predicted based on co-expression analysis and machine learning. We annotate the homologous and disease genes from existing databases and test the functional significance of these TF networks. Finally, the hub TFs in the related TF networks were predicted based on the ARACNE algorithm and CKO mice were constructed to further verify the hub TFs and infer their GRN.
Fig. 2
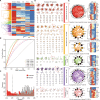
Fig. 2. Striatal development and correlation analysis with HD.
A Expression patterns of DEGs between two adjacent time points. The number of genes and TFs are shown on the right. B The patterning of striatal development in mice. C Histogram of DEGs (FDR < 0.05) in the striatum from P14 to P60. The top ten significant KEGG pathways of these DEGs are displayed. D Two-tailed hypergeometric tests were conducted to determine whether there is a significant overlap of altered genes on a specific pathway between striatal development and HD. Correlations on seven pathways between striatal development and HD. E The number of significantly altered and overlapping genes on seven signaling pathways in striatal development and HD. The genes (FDR < 0.05) differentially expressed in striatal development and HD (adjusted P < 0.05). F Temporal expression patterns of 57 overlapping genes across five time points.
Fig. 3
Fig. 3. Co-expression analysis of differentially expressed continuous genes.
A Hierarchical clustering dendrogram based on the dynamic hybrid tree cut algorithm shows co-expression modules of continuous genes that are color coded. The co-expressed genes are rearranged, and fuzzy c-means clustering identifies two distinct temporal patterns of each co-expression module. The x-axis represents five developmental points, while the y-axis represents log2-transformed, normalized intensity ratios. The number of genes and TFs in each module is shown on the right. B Expression pattern of reported striatal development genes at five time points. C The expression patterns of striatal development genes were verified by in situ hybridization at five time points. Scale bars: 100 μm in c.
Fig. 4
Fig. 4. Predicted potential functional TF networks based on machine learning.
A Expression patterns of 740 differentially expressed continuous TFs from different co-expression modules. B Receiver operating characteristic of differentially expressed continuous TFs from each co-expression module. The AUC is used to assess the quality of machine learning. The AUC of the diagonal is 0.5. C Functional significance distribution of predicted TF networks and random TF networks. D Schematic of the global atlas of inferred functional TF networks in striatal development. E Example of TF networks with different functions of known and unknown subunits. The width of the edges increases with the increase of correlation score. The shape of the node represents whether it is a homologous TF to human (circular node for homology to humans, triangle node for unique in mouse). The color of the node border represents whether the TFs are associated with nervous system disease (black border for disease TFs, gray border for non-disease TFs). The black node indicates potential functional TFs. Expression patterns of representative TF networks are shown on the right by heatmap.
Fig. 5
Fig. 5. Novel functions of Six3 predicted from TF networks.
A Part of the BiNGO results for a TF network, as visualized in Cytoscape. Red categories are the most significantly overrepresented. Yellow nodes are not significantly overrepresented, which include orange nodes in the context of the GO hierarchy. The size of a node is proportional to the number of genes in the test network annotated to the corresponding GO category. B Topological representation of the reconstructed “regulation of neuron apoptotic process” TF regulatory network using ARACNE. TFs are represented as nodes and inferred interactions as edges. Gray nodes indicate the known functional TFs. Potential functional TFs are colored orange. The degree of orange nodes is shown on the right. C The expression of cleaved Caspase-3 in Six3-CKO striatum increases significantly compared to controls at P0. Scale bars: 100 μm in c. D Histogram showing that the number of cleaved Caspase-3+ cells was increased in Six3-CKO mice. (Student’s t test, ***P < 0.001, n = 3 mice per group, mean ± SEM). Lv lateral ventricle. Str striatum. E Histogram of DEGs in the LGE at P0 between control and Six3-CKO mice. The 16 DEGs associated with “regulation of neuron apoptotic process” are shown. F A GRN of these “regulation of neuron apoptotic process” genes was inferred by Genie3. The edge direction represents the regulatory interaction from regulatory genes to target genes. Node size and color are proportional to the number of genes (in-degree and out-degree). G Key downstream genes that are candidates for regulating the neuron apoptotic process. The significantly changed genes in Six3-CKO mice versus wild-type mice are shown. Genes are colored by their importance (degree) in the “regulation of neuron apoptotic process” GRN, and the gene font size increases with its degree.
Fig. 6
Fig. 6. Meis2 regulates neuronal apoptotic processes in the striatum.
A The generation of the Meis2Flox allele. The Meis2 gene-targeting vector was designed to delete exon 8 of Meis2. B Deletion of the Meis2 gene was confirmed at the mRNA level by in situ hybridization. C The immunofluorescence staining of cleaved Caspase-3 in Meis2-CKO striatum and controls at P0. Scale bars: 100 μm in b and c. D Histogram showing that cleaved Caspase-3+ cells were increased in Meis2-CKO at P0. (Student’s t test, ***P < 0.001, n = 3 mice per group, mean ± SEM). Lv lateral ventricle. Str striatum. E Histogram of DEGs in the LGE between control and Meis2-CKO mice at P0. The 18 DEGs associated with “regulation of neuron apoptotic process” are shown. F A GRN of these “regulation of neuron apoptotic process” genes was inferred by Genie3. The edge direction represents the regulatory interaction from regulatory genes to target genes. Node size and color are proportional to the number of genes (in-degree and out-degree). G The significantly changed genes in Meis2-CKO mice compared to control mice are shown which are candidates for regulating the neuron apoptotic process. Genes are colored by their importance (degree) in the “regulation of neuron apoptotic process” GRN, and the gene font size increases with its degree.

Similar articles

Cited by

References

    1. Graybiel AM. Building action repertoires: memory and learning functions of the basal ganglia. Curr. Opin. Neurobiol. 1995;5:733–741. doi: 10.1016/0959-4388(95)80100-6. - DOI - PubMed
    1. Wichmann T, DeLong MR. Functional and pathophysiological models of the basal ganglia. Curr. Opin. Neurobiol. 1996;6:751–758. doi: 10.1016/S0959-4388(96)80024-9. - DOI - PubMed
    1. DeLong MR. Primate models of movement disorders of basal ganglia origin. Trends Neurosci. 1990;13:281–285. doi: 10.1016/0166-2236(90)90110-V. - DOI - PubMed
    1. Gerfen CR, Surmeier DJ. Modulation of striatal projection systems by dopamine. Annu. Rev. Neurosci. 2011;34:441–466. doi: 10.1146/annurev-neuro-061010-113641. - DOI - PMC - PubMed
    1. Waclaw RR, Wang B, Pei Z, Ehrman LA, Campbell K. Distinct temporal requirements for the homeobox gene Gsx2 in specifying striatal and olfactory bulb neuronal fates. Neuron. 2009;63:451–465. doi: 10.1016/j.neuron.2009.07.015. - DOI - PMC - PubMed

Publication types

MeSH terms