. 2021 Mar 12;12(1):1610.
doi: 10.1038/s41467-021-21823-y.

Integration of Alzheimer's disease genetics and myeloid genomics identifies disease risk regulatory elements and genes

Affiliations

Integration of Alzheimer's disease genetics and myeloid genomics identifies disease risk regulatory elements and genes

Gloriia Novikova et al. Nat Commun. .

Abstract

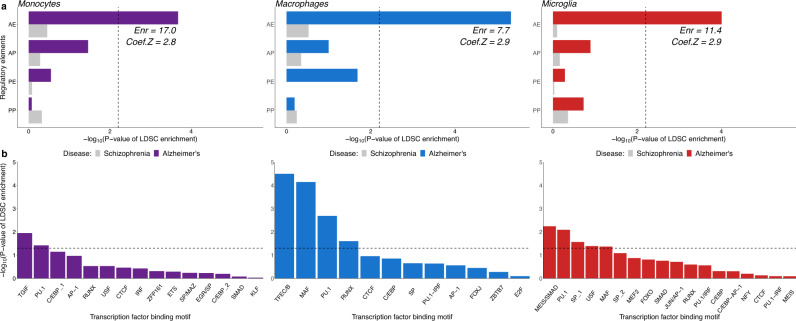
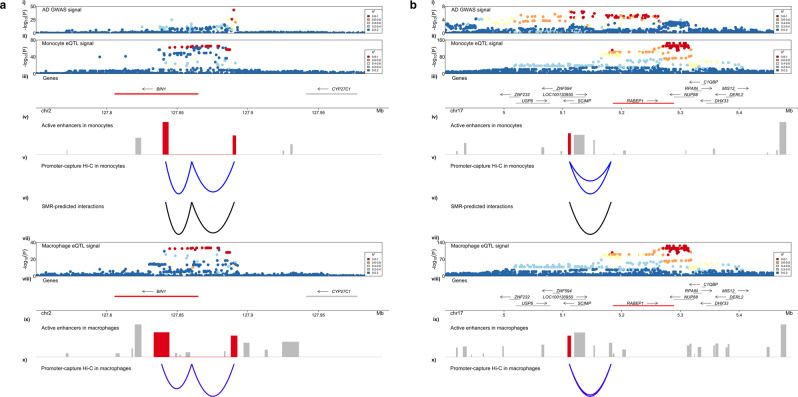
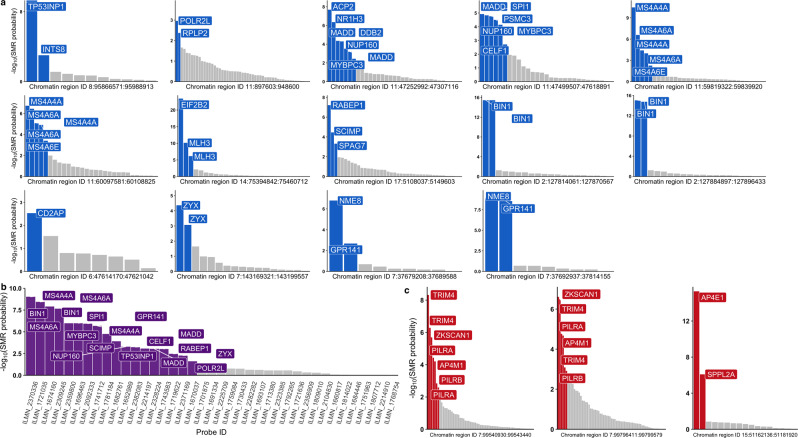
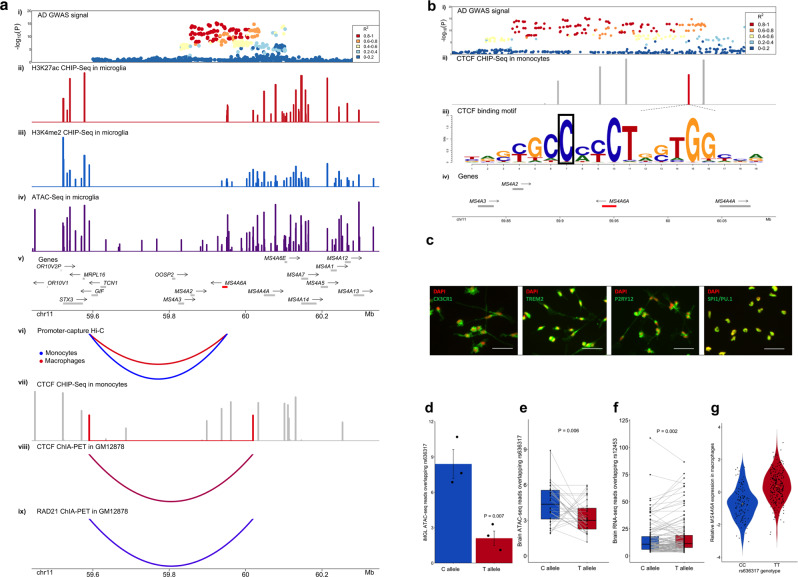
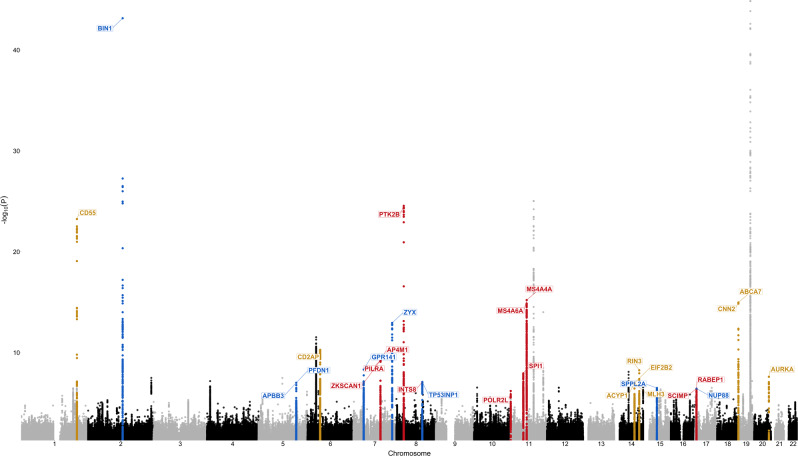
Genome-wide association studies (GWAS) have identified more than 40 loci associated with Alzheimer's disease (AD), but the causal variants, regulatory elements, genes and pathways remain largely unknown, impeding a mechanistic understanding of AD pathogenesis. Previously, we showed that AD risk alleles are enriched in myeloid-specific epigenomic annotations. Here, we show that they are specifically enriched in active enhancers of monocytes, macrophages and microglia. We integrated AD GWAS with myeloid epigenomic and transcriptomic datasets using analytical approaches to link myeloid enhancer activity to target gene expression regulation and AD risk modification. We identify AD risk enhancers and nominate candidate causal genes among their likely targets (including AP4E1, AP4M1, APBB3, BIN1, MS4A4A, MS4A6A, PILRA, RABEP1, SPI1, TP53INP1, and ZYX) in twenty loci. Fine-mapping of these enhancers nominates candidate functional variants that likely modify AD risk by regulating gene expression in myeloid cells. In the MS4A locus we identified a single candidate functional variant and validated it in human induced pluripotent stem cell (hiPSC)-derived microglia and brain. Taken together, this study integrates AD GWAS with multiple myeloid genomic datasets to investigate the mechanisms of AD risk alleles and nominates candidate functional variants, regulatory elements and genes that likely modulate disease susceptibility.


Conflict of interest statement

A.M.G. has consulted for Eisai, Biogen, Pfizer, AbbVie, Cognition Therapeutics and GSK. She also served on the SAB at Denali Therapeutics from 2015 to 2018. This work was funded by grants from the NIH: U01AG052411 (A.M.G.), RF1AG054011 (A.M.G.), U01AG058635 (A.M.G.), NIA K01AG062683 (J.TCW.), AG016573 (W.W.P.), F31 AG059337-01 (A.G.E.), R01AG050986 (P.R.), 1R01ES029212-01 (K.H.), R01HL125863 (J.L.M.B.), American Heart Association (J.L.M.B.), the Swedish Research Council (J.L.M.B.), Heart Lung Foundation (J.L.M.B.), and by Astra-Zeneca through ICMC, Karolinska Institutet (J.L.M.B.), The JPB Foundation, The Robert and Renee Belfer Foundation. E.M.A. and W.W.P. are named co-inventors of patent WO/2018/160496 related to the differentiation and use of human pluripotent stem cells and hematopoietic progenitors into microglia. K.H. receives financial compensation from Sema4 (an Icahn School of Medicine at Mount Sinai spin-off company). Sema4 is currently majority owned by the Icahn School of Medicine at Mount Sinai. The remaining authors declare no competing interests.

Figures

Fig. 1
Fig. 1. AD risk alleles are specifically enriched in myeloid active enhancers and in putative transcription factor binding sites located in these enhancers.
a -Log10 of enrichment P-values obtained from stratified LD Score Regression (LDSC) analysis of AD SNP heritability partitioned by active enhancer (AE), active promoter (AP), primed enhancer (PE) and primed promoter (PP) annotations in monocytes, macrophages, and microglia. Enr = Enrichment of AD SNP heritability partitioned by active enhancer annotations. Dashed line indicates the Bonferroni-corrected significance threshold. The enrichment standard errors for active enhancers are 3.8, 1.3, and 2.6 for monocytes, macrophages, and microglia, respectively. b -Log10 of enrichment P-values obtained from stratified LD Score Regression (LDSC) analysis of AD SNP heritability partitioned by ATAC-Seq subsets. The subsets were obtained by stratifying ATAC-Seq regions in monocytes, macrophages, and microglia by the presence of the binding motif of TFs (listed on the x-axis) that were found to be overrepresented in active myeloid enhancers and expressed in monocytes, macrophages, and microglia, respectively (TPM ≥ 1). Dashed line indicates the nominal significance threshold.
Fig. 2
Fig. 2. AD risk enhancers spatially interact with the promoters of BIN1 and RABEP1 and regulate their expression in myeloid cells.
a. (i) AD GWAS association signal in the BIN1 locus. (ii) eQTL signal for BIN1 in monocytes obtained from the Cardiogenics study. (iii) Genes that reside in the locus are plotted. Likely target genes of the highlighted AD risk enhancers are shown in red. The arrow indicates the direction of transcription, while the bar indicates the gene body. (iv) Active enhancers in monocytes are plotted. The height of the bar is proportional to the strength of the epigenomic signal. AD risk enhancers that are prioritized through both Hi–C and SMR approaches are highlighted in red. (v) Promoter-capture Hi–C interactions between the BIN1 promoter and the highlighted AD risk enhancers in monocytes. The depth of the arc is proportional to the strength of the interaction. (vi) AD risk enhancer-target gene interactions predicted by SMR analysis of causal associations between chromatin activity and BIN1 expression in monocytes. The depth of the arc is proportional to the strength of the association. (vii) eQTL signal for BIN1 in macrophages obtained from the Cardiogenics study. (viii) Genes that reside in the locus are plotted. Likely target genes of the highlighted AD risk enhancers are shown in red. The arrow indicates the direction of transcription, while the bar indicates the gene body. (ix) Active enhancer elements in macrophages are plotted. AD risk enhancers that interact with the gene promoter are highlighted in red. (x) Promoter-capture Hi–C interactions between the BIN1 promoter and the highlighted AD risk enhancers in macrophages. The depth of the arc is proportional to the strength of the interaction. Both Hi–C and SMR-predicted interactions are anchored at the AD risk enhancer highlighted. b. (i) AD GWAS association signal in the RABEP1 locus. (ii) eQTL signal for RABEP1 in monocytes obtained from the Cardiogenics study. (iii) Genes that reside in the locus are plotted. Likely target genes of the highlighted AD risk enhancers are shown in red. The arrow indicates the direction of transcription, while the bar indicates the gene body. (iv) Active enhancers in monocytes are plotted. The height of the bar is proportional to the strength of the epigenomic signal. AD risk enhancers that are prioritized through both Hi–C and SMR approaches are highlighted in red. (v) Promoter-capture Hi–C interactions between the RABEP1 promoter and the highlighted AD risk enhancers in monocytes. The depth of the arc is proportional to the strength of the interaction. (vi) AD risk enhancer-target gene interactions predicted by SMR analysis of causal associations between chromatin activity and RABEP1 expression in monocytes. The depth of the arc is proportional to the strength of the association. vii) eQTL signal for RABEP1 in macrophages obtained from the Cardiogenics study. (viii) Genes that reside in the locus are plotted.Target genes of the highlighted AD risk enhancers are shown in red. The arrow indicates the direction of transcription, while the bar indicates the gene body. (ix) Active enhancer elements in macrophages are plotted. AD risk enhancers that interact with the gene promoter are highlighted in red. (x) Promoter-capture Hi–C interactions between the RABEP1 promoter and the highlighted AD risk enhancers in macrophages. The depth of the arc is proportional to the strength of the interaction. Hi–C and SMR-predicted interactions are anchored at the AD risk enhancers highlighted.
Fig. 3
Fig. 3. Putative causal associations between chromatin activity, target gene expression regulation and AD risk modification point to candidate causal genes in myeloid cells.
a -Log10 of causal association probabilities between chromatin activity and gene expression in monocytes obtained through SMR analysis for each probe are plotted for each chromatin region. Probes (labeled by the respective gene) in blue indicate significant associations, while grey bars indicate non-significant associations based on a 5% FDR threshold. b -Log10 of causal association probabilities between gene expression and AD risk. Probes (labeled by their respective gene) in purple indicate significant associations, while grey bars indicate non-significant associations based on a 5% FDR threshold. c -Log10 of causal association probabilities between activity of two active chromatin regions in the PILRA locus and one active chromatin region in the SPPL2A locus and gene expression in monocytes obtained through SMR analysis for each probe are plotted. Probes (labeled by the respective gene) in red indicate significant associations, while grey bars indicate non-significant associations based on a 5% FDR threshold.
Fig. 4
Fig. 4. A candidate causal variant in the MS4A locus disrupts an anchor CTCF binding site and is associated with reduced chromatin accessibility and increased MS4A6A gene expression in myeloid cells and in the brain.
a (i) AD GWAS signal in the MS4A locus. (ii) H3K27ac peaks in microglia. (iii) H3K4me2 peaks in microglia. (iv) ATAC-seq peaks in microglia. (v) Genes that reside in the locus are plotted. Putative AD risk genes are highlighted in red. The arrow indicates the direction of transcription, while the bar indicates the gene body. (vi) Strongest promoter-capture Hi–C interactions between the MS4A6A promoter and distal regulatory elements contained within the CTCF loop in monocytes (blue) and macrophages (red). (vii) CTCF ChIP-Seq peaks in monocytes. The peaks highlighted in red are anchor CTCF binding sites for the chromatin loop. (viii) CTCF ChIA-PET interactions in GM12878. (ix) RAD21 ChiA-PET interaction in GM12878. b (i) AD GWAS signal in the MS4A locus. (ii) CTCF ChIP-Seq peaks in monocytes. The peak highlighted in red is an anchor CTCF binding site for a chromatin loop and contains the candidate causal variant (rs636317-T). (iii) A CTCF binding motif resides in the CTCF ChIP peak highlighted in red in (ii). The candidate causal variant (rs636317-T) resides in position 7 (boxed) of this motif and is predicted to disrupt CTCF binding. (iv) Genes that reside in the locus are plotted. Putative AD risk genes are highlighted in red. The arrow indicates the direction of transcription, while the bar indicates the gene body. c Immunofluorescent images of microglial markers (CX3CR1, TREM2, P2RY12 and PU.1) confirming differentiation of hiPSC-derived microglia. Scale bar = 100μm. d Allelic imbalance of chromatin accessibility at the rs636317 site is observed in hiPSC-derived microglia. Mean normalized ATAC-Seq read counts are plotted for the protective (C) and risk-increasing (T) alleles; the dots represent each individual, centers for the error bars represent mean normalized ATAC-seq read counts and error bars represent standard errors. The protective allele (C) shows significantly more ATAC-Seq read counts than the risk-increasing allele (T) (P-value = 0.007, paired one-sided t-test), which is consistent with the hypothesis that the presence of the rs636317 AD risk-increasing allele leads to disruption of CTCF binding. e Allelic imbalance of chromatin accessibility at the rs636317 site is observed in the brain. Each pair of dots connected by a grey line represent an individual. The protective allele (C) shows significantly more ATAC-Seq read counts than the risk-increasing allele (T) (P-value = 0.006, paired one-sided t-test, n = 32), which replicates our observations in hiPSC-derived microglia. f Allelic imbalance in normalized brain RNA-seq reads at rs12453 site. Each pair of dots connected by a grey line represent an individual. The protective allele (C) shows significantly less MS4A6A RNA-Seq read counts than the risk-increasing allele (T) (P-value = 0.002, paired one-sided t-test, n = 118), which is consistent with our hypothesis. g Relative expression of MS4A6A in macrophages increases in a rs636317-T allele dose-dependent manner. Each dot represents the relative expression level of MS4A6A in each individual, while the yellow dot represents the median. Horizontal lines in box plots depict 25%, 50%, and 75% quantiles; lower whisker = lower hinge - 1.5*IQR; upper whisker = upper hinge + 1.5*IQR.
Fig. 5
Fig. 5. Candidate causal genes nominated through both Hi–C and SMR approaches in twenty loci.
The Manhattan plot depicts the IGAP GWAS signal with putative AD risk genes assigned to each locus through both Hi–C and SMR approaches. Red indicates that increased expression of the gene is predicted to increase risk for AD. Blue indicates that decreased expression of the gene is predicted to increase risk for AD. Gold indicates that the directionality of gene expression that is associated with increased disease susceptibility cannot be robustly inferred. These genes were prioritized if they either a) interact with an AD risk enhancer that contains an eQTL for this gene or b) were implicated in enhancer activity to gene expression association, but did not have significant expression to disease risk associations (SMR). ZYX and PTK2B showed opposite directions of expression associated with disease risk in monocytes and macrophages. Strongest associations are reported (macrophages in ZYX locus and monocytes in PTK2B locus). The TREM2 locus is not shown since a well replicated rare loss-of-function mutations were found in TREM2. The PICALM locus is not shown since the prioritized gene is not expressed in microglia.

References

    1. Dementia statistics | Alzheimer’s Disease International. https://www.alz.co.uk/research/statistics.
    1. Efthymiou AG, Goate AM. Late onset Alzheimer’s disease genetics implicates microglial pathways in disease risk. Mol. Neurodegener. 2017;12:43. doi: 10.1186/s13024-017-0184-x. - DOI - PMC - PubMed
    1. Jonsson T, et al. Variant of TREM2 associated with the risk of Alzheimer’s disease. N. Engl. J. Med. 2013;368:107–116. doi: 10.1056/NEJMoa1211103. - DOI - PMC - PubMed
    1. Vardarajan BN, et al. Coding mutations in SORL1 and Alzheimer disease. Ann. Neurol. 2015;77:215–227. doi: 10.1002/ana.24305. - DOI - PMC - PubMed
    1. Sims R, et al. Rare coding variants in PLCG2, ABI3, and TREM2 implicate microglial-mediated innate immunity in Alzheimer’s disease. Nat. Genet. 2017;49:1373–1384. doi: 10.1038/ng.3916. - DOI - PMC - PubMed

Publication types