. 2021 Mar 12;12(1):1655.
doi: 10.1038/s41467-021-21809-w.

Digital proximity tracing on empirical contact networks for pandemic control

Affiliations

Digital proximity tracing on empirical contact networks for pandemic control

G Cencetti et al. Nat Commun. .

Abstract

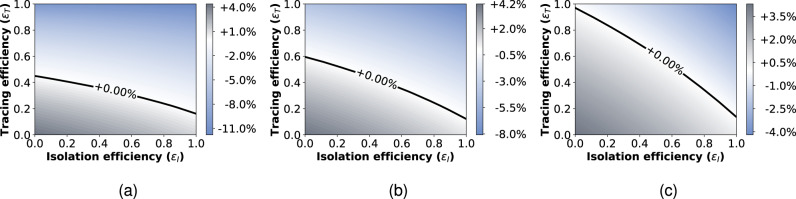
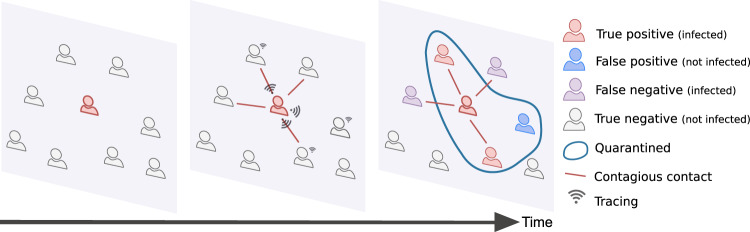
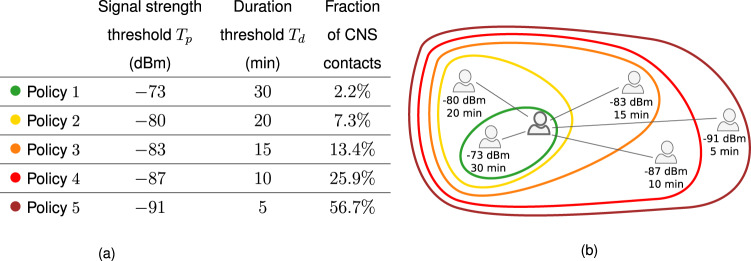
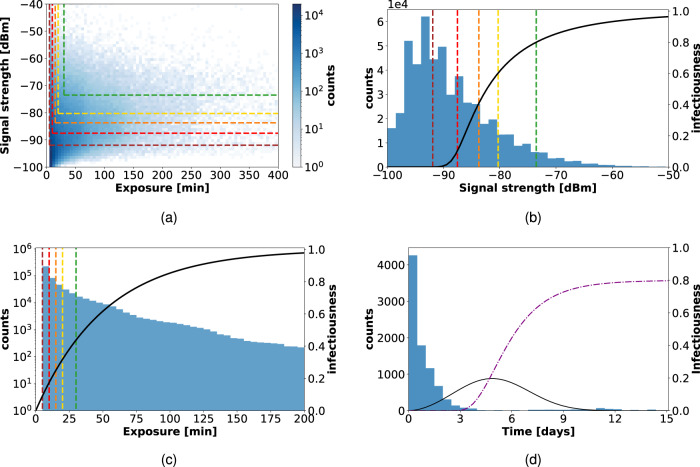
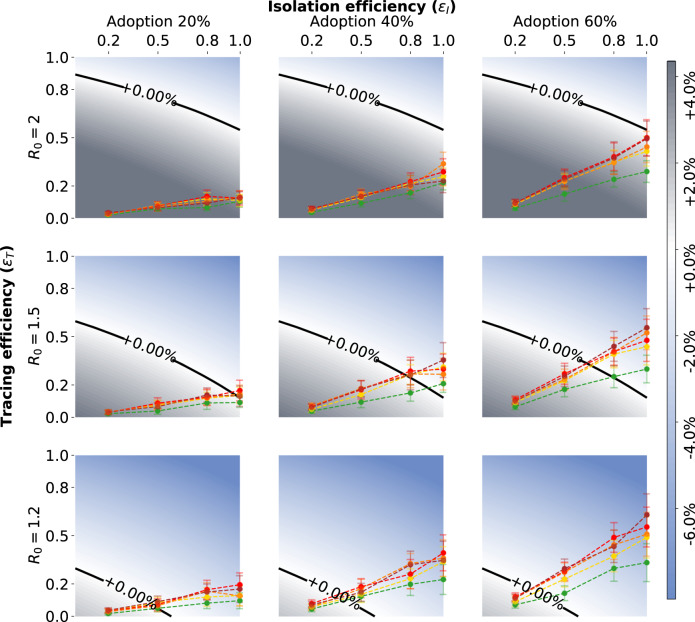
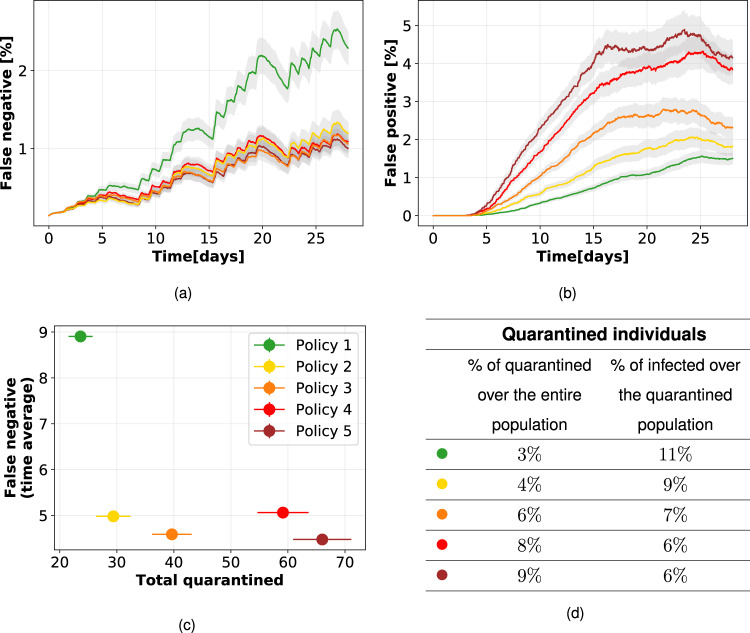
Digital contact tracing is a relevant tool to control infectious disease outbreaks, including the COVID-19 epidemic. Early work evaluating digital contact tracing omitted important features and heterogeneities of real-world contact patterns influencing contagion dynamics. We fill this gap with a modeling framework informed by empirical high-resolution contact data to analyze the impact of digital contact tracing in the COVID-19 pandemic. We investigate how well contact tracing apps, coupled with the quarantine of identified contacts, can mitigate the spread in real environments. We find that restrictive policies are more effective in containing the epidemic but come at the cost of unnecessary large-scale quarantines. Policy evaluation through their efficiency and cost results in optimized solutions which only consider contacts longer than 15-20 minutes and closer than 2-3 meters to be at risk. Our results show that isolation and tracing can help control re-emerging outbreaks when some conditions are met: (i) a reduction of the reproductive number through masks and physical distance; (ii) a low-delay isolation of infected individuals; (iii) a high compliance. Finally, we observe the inefficacy of a less privacy-preserving tracing involving second order contacts. Our results may inform digital contact tracing efforts currently being implemented across several countries worldwide.


Conflict of interest statement

The authors declare no competing interests.

Figures

Fig. 1
Fig. 1. Infection rate scenarios.
Growth or decrease rate of the number of newly infected individuals, assuming either that all the infected people can eventually be identified and isolated (a); or that only symptomatic people can be isolated with 20% of asymptomatic infected individuals (b); or that only symptomatic people can be isolated with 40% of asymptomatic infected individuals (c). Infection rates are reported as a function of the isolation efficiency εI and the tracing efficiency εT. In all the three settings the cases are reported with a delay of 2 days.
Fig. 2
Fig. 2. Contagion, tracing, and quarantines.
The contacts among users of the contact tracing app are registered via the app. When individuals are identified as infected they are isolated, and the tracing and quarantine policy is implemented. Depending on the policy design, the number of false positives and false negatives may vary significantly.
Fig. 3
Fig. 3. Policies based on distance and duration.
(a): The signal strength threshold Tp and the duration threshold Td defining the policies are reported. Contacts with a duration larger than Td and signal strength larger than Tp are considered at risk. The last column gives the fraction of the total number of interactions of the CNS data set that they correspond to. A larger value of the magnitude of the signal strength tends to correspond to a larger distance, such that in the second column the thresholds go from the least to the most restrictive policy. The policies are sketched in (b).
Fig. 4
Fig. 4. Contacts in CNS data set: signal strength, exposure, and inter-contact time.
(a): A scatterplot of signal strength vs. duration for all contact events in the CNS data set, displaying the thresholds defining the various policies (Tp for signal strength and Td for the duration): the contacts identified as "at risk'' are those situated above and to the right of the dashed colored lines. (b) and (c) separately depict the distributions of signal strength and duration, together with the infectiousness functions ωdist and ωexposure, respectively (black curves), see Supplementary Note 1.2 for their analytical form. (d): The distribution of time elapsed between the infection of an individual and their successive contacts, obtained with εI = 0.8 and for Policy 5 in the CNS data set. The black curve shows the normalized infectiousness ω(τ) as a function of time, and the purple dashed line is the cumulative probability s(τ) to identify an infected individual.
Fig. 5
Fig. 5. Tracing policy efficiency.
Growth or decrease rate of the number of newly infected individuals assuming that symptomatic individuals can be isolated and that an additional 50% of asymptomatics can be identified via randomized testing. The points correspond to the parameter pairs such that the isolation efficiency εI is an input and the tracing efficiency εT an output of the simulations on CNS contact data, for the five policies. The different scenarios are defined by an app adoption level of 20, 40, or 60% (from left to right), and by a value of the reproductive number R0 equal to 2, 1.5, or 1.2 (from top to bottom). All the points have been obtained as mean values over n = 200 simulations and the error bars represent the standard error.
Fig. 6
Fig. 6. Quarantines, false positives, and negatives, with 40% app adoption and R0 = 1.5.
Temporal evolution of percentages of false negatives (a), i.e., infected individuals not quarantined, and false positives (b), i.e., not infected individuals quarantined, over the population for the five different policies, assuming an isolation efficiency of εI = 0.8. The graphs depict the mean and standard error over 200 independent runs. (c): Effectiveness (low number of false negatives) vs. cost (total quarantines) of the policies. (d): The table reports the percentage of distinct individuals who have been quarantined over the entire population and the percentage of them who were actually infected (true positive).

References

    1. Center for Systems Science and Engineering (CSSE) at Johns Hopkins University. COVID-19 data repository. https://github.com/CSSEGISandData/COVID-19.
    1. Li, R. et al. The demand for inpatient and ICU beds for COVID-19 in the US lessons from Chinese cities. Preprint at https://www.ncbi.nlm.nih.gov/pmc/articles/PMC7239072/ (2020).
    1. Salje, H. et al. Estimating the burden of SARS-CoV-2 in France. Science369, 208–211(2020). - PMC - PubMed
    1. Guzzetta G, et al. Impact of a nationwide lockdown on sars-cov-2 transmissibility, italy. Emerg. Infect. Dis. 2021;27:267. doi: 10.3201/eid2701.202114. - DOI - PMC - PubMed
    1. Anderson RM, Heesterbeek H, Klinkenberg D, Hollingsworth TD. How will country-based mitigation measures influence the course of the COVID-19 epidemic? Lancet. 2020;395:931–934. doi: 10.1016/S0140-6736(20)30567-5. - DOI - PMC - PubMed

Publication types

MeSH terms