. 2021 Mar 12;12(1):1660.
doi: 10.1038/s41467-021-21361-7.

Shotgun transcriptome, spatial omics, and isothermal profiling of SARS-CoV-2 infection reveals unique host responses, viral diversification, and drug interactions

Daniel Butler #  1 Christopher Mozsary #  1 Cem Meydan #  1   2   3 Jonathan Foox #  1   2 Joel Rosiene #  4   5 Alon Shaiber #  4   5   6 David Danko #  1 Ebrahim Afshinnekoo  1   2   3 Matthew MacKay  1 Fritz J Sedlazeck  7 Nikolay A Ivanov  1   2   8 Maria Sierra  1   2 Diana Pohle  9 Michael Zietz  10 Undina Gisladottir  10 Vijendra Ramlall  10   11 Evan T Sholle  12 Edward J Schenck  13 Craig D Westover  1 Ciaran Hassan  1 Krista Ryon  1 Benjamin Young  1 Chandrima Bhattacharya  1 Dianna L Ng  14 Andrea C Granados  14   15 Yale A Santos  14   15 Venice Servellita  14   15 Scot Federman  14   15 Phyllis Ruggiero  5 Arkarachai Fungtammasan  16 Chen-Shan Chin  16 Nathaniel M Pearson  17 Bradley W Langhorst  18 Nathan A Tanner  18 Youngmi Kim  19 Jason W Reeves  19 Tyler D Hether  19 Sarah E Warren  19 Michael Bailey  19 Justyna Gawrys  5 Dmitry Meleshko  1   20 Dong Xu  21 Mara Couto-Rodriguez  22 Dorottya Nagy-Szakal  22   23 Joseph Barrows  22 Heather Wells  22 Niamh B O'Hara  22   23 Jeffrey A Rosenfeld  24   25 Ying Chen  24 Peter A D Steel  26 Amos J Shemesh  26 Jenny Xiang  21 Jean Thierry-Mieg  27 Danielle Thierry-Mieg  27 Angelika Iftner  9 Daniela Bezdan  9 Elizabeth Sanchez  13 Thomas R Campion Jr  12   28 John Sipley  5 Lin Cong  5 Arryn Craney  5 Priya Velu  5 Ari M Melnick  13 Sagi Shapira  10 Iman Hajirasouliha  1   2   6 Alain Borczuk  13 Thomas Iftner  9 Mirella Salvatore  13   28 Massimo Loda  5 Lars F Westblade  5   13 Melissa Cushing  5 Shixiu Wu  29   30 Shawn Levy  31 Charles Chiu  14   15   32 Robert E Schwartz  33 Nicholas Tatonetti  34 Hanna Rennert  35 Marcin Imielinski  36   37   38 Christopher E Mason  39   40   41   42
Affiliations

Shotgun transcriptome, spatial omics, and isothermal profiling of SARS-CoV-2 infection reveals unique host responses, viral diversification, and drug interactions

Daniel Butler et al. Nat Commun. .

Abstract

In less than nine months, the Severe Acute Respiratory Syndrome Coronavirus 2 (SARS-CoV-2) killed over a million people, including >25,000 in New York City (NYC) alone. The COVID-19 pandemic caused by SARS-CoV-2 highlights clinical needs to detect infection, track strain evolution, and identify biomarkers of disease course. To address these challenges, we designed a fast (30-minute) colorimetric test (LAMP) for SARS-CoV-2 infection from naso/oropharyngeal swabs and a large-scale shotgun metatranscriptomics platform (total-RNA-seq) for host, viral, and microbial profiling. We applied these methods to clinical specimens gathered from 669 patients in New York City during the first two months of the outbreak, yielding a broad molecular portrait of the emerging COVID-19 disease. We find significant enrichment of a NYC-distinctive clade of the virus (20C), as well as host responses in interferon, ACE, hematological, and olfaction pathways. In addition, we use 50,821 patient records to find that renin-angiotensin-aldosterone system inhibitors have a protective effect for severe COVID-19 outcomes, unlike similar drugs. Finally, spatial transcriptomic data from COVID-19 patient autopsy tissues reveal distinct ACE2 expression loci, with macrophage and neutrophil infiltration in the lungs. These findings can inform public health and may help develop and drive SARS-CoV-2 diagnostic, prevention, and treatment strategies.


Conflict of interest statement

N.T. and B.W.L. are employees at New England Biolabs. R.E.S. is on the scientific advisory board of Miromatrix Inc. Biotia employees and advisors include M.C.R., D.N.S., J.B., H.W., C.E.M., and N.O. D.B. is a co-founder of Poppy Inc; A.F and C.S.C are employees of DNAnexus. Authors not listed here do not have competing interests.

Figures

Fig. 1
Fig. 1. Sample processing, the loop-mediated isothermal (LAMP) reaction and synthetic RNA validation.
a Clinical samples collected with nasopharyngeal (NP) swabs were tested with RNA-sequencing, qRT-PCR, and LAMP. b The test samples were prepared using an optimized LAMP protocol from NEB, with a reaction time of 30 min. c Reaction progress was measured for the Twist SARS-CoV-2 synthetic RNA (MT007544.1) from 1 million molecules of virus, then titrated down by log10 dilutions. The colorimetric findings of the LAMP assay are based on a yellow to pink gradient with higher copies of SARS-CoV-2 RNA corresponding to a yellow color. The limit of detection (LoD) range is shown with a gradient after 30 min between 10 and 100 viral copies (lower right). d Replicates of the titrated viral copies using LAMP, as measured by QuantiFluor fluorescence over 201 patient samples. e The sensitivity and specificity of the LAMP assay from 201 patients (132 negative and 69 positive for SARS-CoV-2, as measured by qRT-PCR). Thresholds are DNA quantified by the QuantiFluor.
Fig. 2
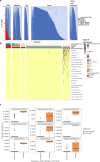
Fig. 2. Full transcriptome profiles of SARS-CoV-2 Patients with NGS, qRT-PCR, and LAMP.
a Reads mapping to SARS-CoV-2 (red), other viruses (pink), human (blue), bacteria (light blue), archaea (black), fungi (dark gray), across samples with high/medium/low viral load according to qRT-PCR (“High”, “Medium”, and “Low”, respectively), qRT-PCR negative samples with no detection of other respiratory viruses (“None”), and qRT-PCR negative samples in which other respiratory viruses were detected by RNA sequencing and/or by a BioFire panel (“Other viral infection”). b Heatmap of abundance of a selection of viral pathogens across samples. c BioFire viral validation of the detection of viral pathogens using RNA sequencing across 669 samples. Box plots to compare relative abundance of viral pathogens in RNA sequencing between samples that were found as positive or negative for each virus in a BioFire PCR panel. Box plots show the median as center, first and third quartiles as the box hinges, and whiskers extend to the smallest and largest value no further than the 1.5× interquartile range (IQR) away from the hinges.
Fig. 3
Fig. 3. Viral genome assemblies and variants.
a Time-resolved phylogenetic tree of WCM samples and GISAID samples. Nodes corresponding to the 155 WCM strains are marked with circles. Branches and nodes are colored according to the Nextstrain clade affiliation. b Clade distribution amongst WCM strains and other NY strains from GISAID. c Longitudinal distribution of clade assignments. Data points represent the portion of the sequences on GISAID matching to each clade in a given week in each of the 8 regions. Lines show the mean and gray areas around the curve represent 95% confidence intervals. d Variant allele frequencies (VAF, x-axis) for alternative alleles (y-axis) were calculated for all variants across viral strains, with heterogenous (het, 5% < × < 95%, red) variants shown as well as homogenous (black) variants with VAF > 0.95. e The distribution and density of the VAF for three exemplar samples are shown relative to their variant type (top).
Fig. 4
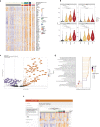
Fig. 4. Host transcriptome responses to SARS-CoV-2.
a Samples were quantified by RNA-seq (log10 SARS-CoV-2% of reads), and qRT-PCR (Ct values) to create a three-tier range of viral load for the positive samples (class, red) and those samples with other viral infections that were SARS-CoV-2 negative (gray). Differentially expressed genes showed upregulated (orange) genes as well as downregulated (purple) genes compared to non-viral samples. b Upregulated genes, with violin plots for all samples, include IFI6, ACE2, SHFL, HERC6, IFI27, and IFIT1, based on data from (c), which is the total set of DEGs, shown here as a volcano plot, with a core set of upregulated genes (orange) distinct from the set of downregulated genes (purple), compared to genes that are not significantly differently expressed (gray) in any comparison (Statistical tests by negative binomial model in DESeq2, multiple testing adjusted p value < 0.01, |logFC| >0.58). d GSEA enrichment of significant pathways, with color indicating statistical significance and circle size the number of genes on the leading edge. e Screenshot of the WCM COVID-19 Genes Portal, an interactive repository for mining the human gene expression changes in the data from this study (https://covidgenes.weill.cornell.edu).
Fig. 5
Fig. 5. Host risk to SARS-CoV-2.
a Estimates for ACEI/ARB use effect on SARS-CoV-2 infection test result, intubation, and death. Upper panels show estimates from all patients without propensity matching (unmatched, no condition (N.C.)). Lower panels show estimates from propensity-matched patients with recent exposure to antihypertensive (AH) drugs (ACEI, ARB, BB, CCB, and THZ) (Supplementary Data 6). Center points show the estimated coefficient and the error bars show 95% confidence interval. Coefficients represent effect size estimates from logistic regression (for infection test outcome) or Cox proportional hazards regression (mechanical respiration and mortality), and can be interpreted as log odds ratios (former outcome) or log hazard ratios (latter outcomes). Colors indicate the variables used for regression on the cohort (drug exposure alone (blue), drug exposure plus age, sex, history of diabetes mellitus (DM), history of hypertension (HTN) (green), drug exposure plus all demographics and risk factors considered (red)). Left panels show estimates from NYP-CUIMC data, right panels show estimates from NYP-WCMC. b Curves for 50,821 patients requiring mechanical respiration (top panels) and survival (bottom panels), as a function of time since confirmed infection and recent ACEI/ARB exposure status. Cohorts created using propensity matching. Left panels give data from NYP-CUIMC, right panels give data from NYP-WCMC. c Comparison of cohorts before and after propensity matching. Each point represents a difference in the mean between exposed and unexposed cohorts, divided by the mean of exposed and unexposed cohorts. Filled circles give these standardized differences after propensity matching, unfilled circles give values before matching.
Fig. 6
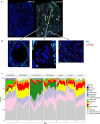
Fig. 6. Spatial transcriptomic profiles of patient autopsies.
a Imaging from RNAscope showing fluorescence of target genes and imaging from GeoMx DSP defining regions of gene expression measurement for COVID Patient #4. b Close up of few selected regions of interest (ROI). c Cellular composition of 107 tissue regions. Each column shows the cell proportions within a single alveolar segment, as estimated from mixed cell deconvolution of GeoMx RNA data. Controls are from excess lung material from healthy lung transplant donors.

Update of

Similar articles

Cited by

References

    1. He F, Deng Y, Li W. Coronavirus disease 2019 (COVID-19): what we know? J. Med. Virol. 2020;92:719–725. doi: 10.1002/jmv.25766. - DOI - PMC - PubMed
    1. Fauver JR, et al. Coast-to-coast spread of SARS-CoV-2 during the early epidemic in the United States. Cell. 2020;181:990–996. doi: 10.1016/j.cell.2020.04.021. - DOI - PMC - PubMed
    1. Gonzalez-Reiche, A. et al. Introductions and early spread of SARS-CoV-2 in the New York City area. MedAxiv 10.1101/2020.04.08.20056929v1 (2020). - PMC - PubMed
    1. Zhao, Z., Sokhansanj, B. A. & Rosen, G. Characterizing geographical and temporal dynamics of novel coronavirus SARS-CoV-2 using informative subytype markers. BioRxiv 10.1101/2020.04.07.030759v3 (2020).
    1. Lu J, et al. Genomic epidemiology of SARS-CoV-2 in Guangdong Province, China. Cell. 2020;181:997–1003. doi: 10.1016/j.cell.2020.04.023. - DOI - PMC - PubMed

Publication types

MeSH terms

Substances

Supplementary concepts