. 2021 Mar 12;12(1):1611.
doi: 10.1038/s41467-021-21854-5.

Global discovery of lupus genetic risk variant allelic enhancer activity

Affiliations

Global discovery of lupus genetic risk variant allelic enhancer activity

Xiaoming Lu et al. Nat Commun. .

Abstract

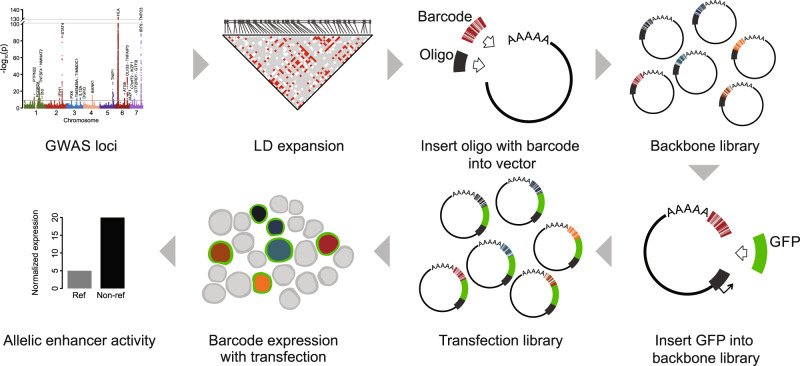
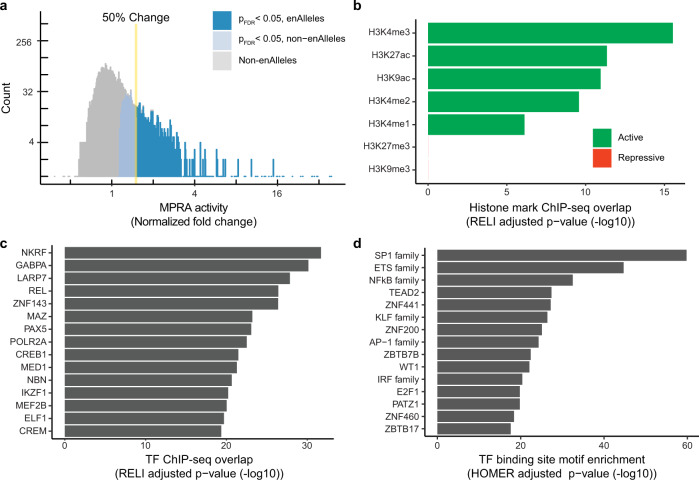
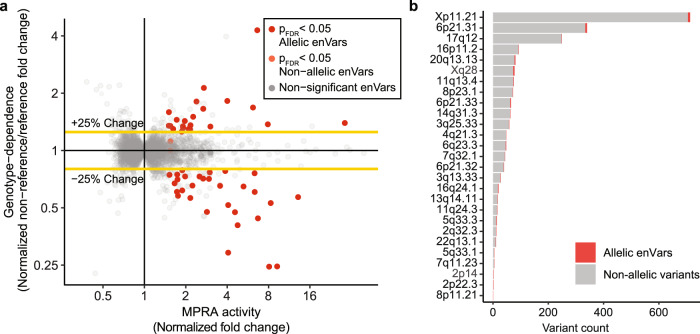
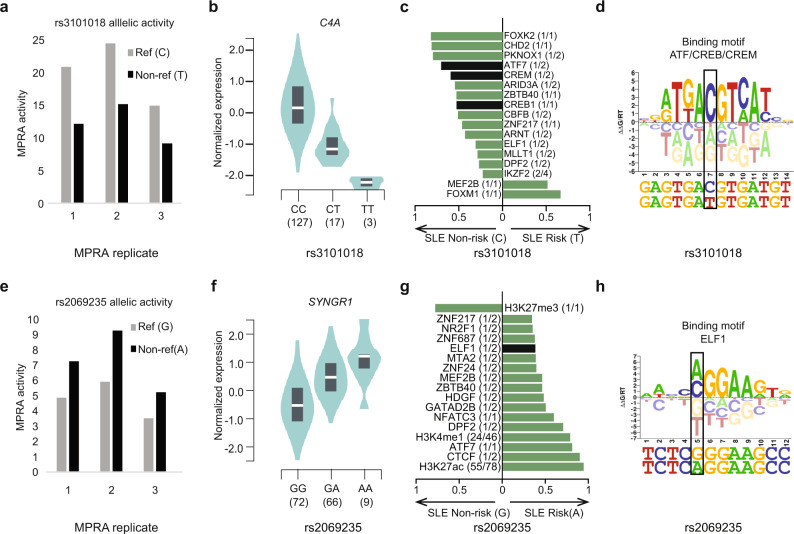
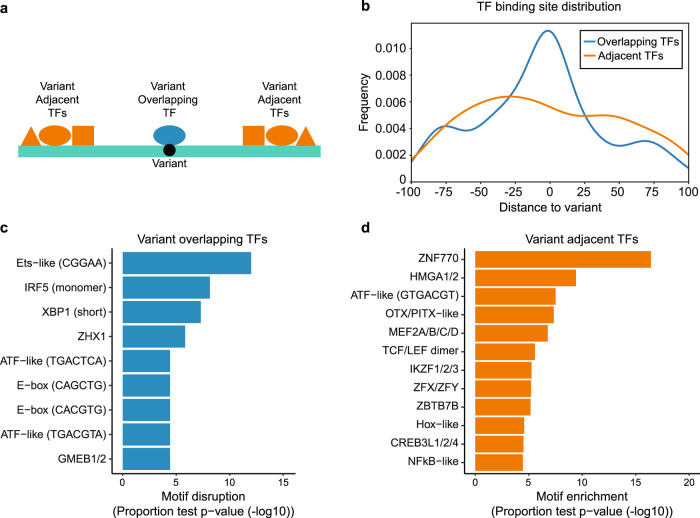
Genome-wide association studies of Systemic Lupus Erythematosus (SLE) nominate 3073 genetic variants at 91 risk loci. To systematically screen these variants for allelic transcriptional enhancer activity, we construct a massively parallel reporter assay (MPRA) library comprising 12,396 DNA oligonucleotides containing the genomic context around every allele of each SLE variant. Transfection into the Epstein-Barr virus-transformed B cell line GM12878 reveals 482 variants with enhancer activity, with 51 variants showing genotype-dependent (allelic) enhancer activity at 27 risk loci. Comparison of MPRA results in GM12878 and Jurkat T cell lines highlights shared and unique allelic transcriptional regulatory mechanisms at SLE risk loci. In-depth analysis of allelic transcription factor (TF) binding at and around allelic variants identifies one class of TFs whose DNA-binding motif tends to be directly altered by the risk variant and a second class of TFs that bind allelically without direct alteration of their motif by the variant. Collectively, our approach provides a blueprint for the discovery of allelic gene regulation at risk loci for any disease and offers insight into the transcriptional regulatory mechanisms underlying SLE.


Conflict of interest statement

The authors declare no competing interests.

Figures

Fig. 1
Fig. 1. Massively parallel reporter assay workflow.
Schematic of study design. Representative Manhattan plot of SLE-associated risk loci reproduced from ref. .
Fig. 2
Fig. 2. Regulatory activity of enhancer variants (enVars).
a Distribution of MPRA regulatory activity. The normalized fold change of MPRA activity relative to plasmid control (X-axis) was calculated using DESeq2 (n = 3 biological replicates). Enhancer alleles (enAlleles) (blue) were identified as those alleles with significant activity relative to control (padj < 0.05) and at least a 50% increase in activity (see “Methods”). The p-values were generated by two-sided Wald tests with Benjamini–Hochberg multiple testing correction. Full results are provided in Supplementary Data 6. b Enrichment of histone marks in GM12878 cells at enVars compared to non-enVars. p-values were estimated by one-sided z-test with Bonferroni multiple testing correction using RELI (see “Methods”). Full results are provided in Supplementary Data 9. c Enrichment of regulatory protein and transcription factor (TF) binding at enVars compared to non-enVars. p-values were estimated by one-sided z-test with Bonferroni multiple testing correction using RELI (see “Methods”). The top 15 TFs (based on RELI p-values) that overlap at least 10% of enVars are shown. Full results are provided in Supplementary Data 9. d TF binding site motif enrichment for enVars compared to non-enVars. p-values were estimated by one-sided hypergeometric test with Benjamini–Hochberg multiple testing correction by HOMER using the full oligo sequences of enVars and non-enVars (see “Methods”). The top 15 enriched TF motif families are shown. Full results are provided in Supplementary Data 10.
Fig. 3
Fig. 3. Regulatory activity of allelic enhancer variants (allelic enVars).
a Identification of allelic enVars. Genotype dependence (Y-axis) is defined as the normalized fold change of MPRA activity between the non-reference and reference alleles (n = 3 biological replicates, see “Methods”). MPRA activity (X-axis) is presented as the maximum normalized fold change of MPRA activity for any allele of the variant. Allelic enVars (red) were defined as variants with a significant difference in MPRA activity (padj < 0.05) between any pair of alleles and at least a 25% change in activity difference (see “Methods”). The p-values were generated by two-sided Student’s t-test with Benjamini–Hochberg multiple testing correction. Full results are provided in Supplementary Data 11. b MPRA enhancer activity at the 27 risk loci with at least one allelic enVar. Bar plots indicate the total number of variants at each locus. Variants with allelic enhancer activity (allelic enVars) are shown in red. Variants lacking allelic enhancer activity are shown in gray.
Fig. 4
Fig. 4. Lupus risk allele-dependent gene regulatory mechanisms at the C4A and SYNGR1 genomic loci.
a, e Normalized MPRA enhancer activity of each experimental replicate for rs3101018 and rs26069235. b, f Expression trait quantitative loci (eQTLs) revealing genotype-dependent expression of C4A and SNYGR1 for rs3101018 (CC, n = 127 biologically independent samples; CT, n = 17; TT, n = 3) and rs26069235 (GG, n = 72 biologically independent samples; GA, n = 66; AA, n = 9) in EBV-transformed B cell lines (GTEx). c, g Genotype-dependent activity of transcription factors, transcriptional regulators, and histone marks in EBV-transformed B cell lines for rs3101018 and rs26069235. Results with MARIO ARS value >0.4 and consistent allelic imbalance across ChIP-seq datasets are included (see “Methods”). The X-axis indicates the preferred allele, along with a value indicating the strength of the allelic behavior, calculated as one minus the ratio of the weak to strong read counts (e.g., 0.5 indicates the strong allele has twice the reads of the weak allele). The median value is plotted when data from multiple cell lines are available, with full results provided in Supplementary Fig. 4. The numbers in parentheses represent the number of ChIP-seq datasets with significant allelic activity (i.e., MARIO ARS value >0.4) out of the number of datasets where the given variant is inside a ChIP-seq peak and is also heterozygous in the given cell line. Variant overlapping TFs are indicated in black. Variant adjacent TFs are shown in green (see definition in Fig. 5a). d, h DNA-binding motif logos are shown for the ATF/CREB/CREM family, and ELF1 in the context of the DNA sequence surrounding rs3101018 and rs2069235, respectively. Tall nucleotides above the X-axis indicate preferred DNA bases. Bases below the X-axis are disfavored. In (b) and (f), data are represented as a violin plot where the middle line is the median, the lower and upper hinges correspond to the first and third quartiles, with the rotated kernel density plot shown on each side. The data used for the analyses were obtained from the Genotype-Tissue Expression (GTEx) Portal on 11/12/2020. The GTEx Project was supported by the Common Fund of the Office of the Director of the National Institutes of Health, and by NCI, NHGRI, NHLBI, NIDA, NIMH, and NINDS.
Fig. 5
Fig. 5. Identification of variant overlapping and variant adjacent TFs.
a Model of variant overlapping and variant adjacent transcription factors (TFs). Variant overlapping TFs (blue) allelically bind on top of variants, while variant adjacent TFs (orange) allelically bind near variants. b TF binding site location distribution for variant overlapping (blue) and variant adjacent (orange) TFs, relative to allelic enVars. c TF motif families enriched for participating as variant overlapping TFs at allelic enVars. Motif disruption p-values were estimated by a two-sided proportions test by comparing the fraction of motif disruption events at allelic enVars to the fraction observed at non-allelic enVars (see “Methods”). d TF motif families enriched for participating as variant adjacent TFs at allelic enVars. Motif enrichment p-values were estimated by a two-sided proportions test by comparing the fraction of predicted TF binding sites in allelic enVars to random expectation (see “Methods”). For both the variant overlapping and variant adjacent analyses, motif families are shown with padj < 0.0001 and three or more allelic events at allelic enVar loci, or five or more predicted binding sites at allelic enVar loci, respectively.

References

    1. Carter EE, Barr SG, Clarke AE. The global burden of SLE: prevalence, health disparities and socioeconomic impact. Nat. Rev. Rheumatol. 2016;12:605–620. doi: 10.1038/nrrheum.2016.137. - DOI - PubMed
    1. Tsokos GC. Systemic lupus erythematosus. N. Engl. J. Med. 2011;365:2110–2121. doi: 10.1056/NEJMra1100359. - DOI - PubMed
    1. Deng Y, Tsao BP. Genetic susceptibility to systemic lupus erythematosus in the genomic era. Nat. Rev. Rheumatol. 2010;6:683–692. doi: 10.1038/nrrheum.2010.176. - DOI - PMC - PubMed
    1. Visscher PM, et al. 10 Years of GWAS discovery: biology, function, and translation. Am. J. Hum. Genet. 2017;101:5–22. doi: 10.1016/j.ajhg.2017.06.005. - DOI - PMC - PubMed
    1. Fike AJ, Elcheva I, Rahman ZSM. The post-GWAS era: how to validate the contribution of gene variants in lupus. Curr. Rheumatol. Rep. 2019;21:3. doi: 10.1007/s11926-019-0801-5. - DOI - PubMed

Publication types