. 2021 Mar 12;12(1):1637.
doi: 10.1038/s41467-021-21674-7.

Predicting gastric cancer outcome from resected lymph node histopathology images using deep learning

Affiliations

Predicting gastric cancer outcome from resected lymph node histopathology images using deep learning

Xiaodong Wang et al. Nat Commun. .

Abstract

N-staging is a determining factor for prognostic assessment and decision-making for stage-based cancer therapeutic strategies. Visual inspection of whole-slides of intact lymph nodes is currently the main method used by pathologists to calculate the number of metastatic lymph nodes (MLNs). Moreover, even at the same N stage, the outcome of patients varies dramatically. Here, we propose a deep-learning framework for analyzing lymph node whole-slide images (WSIs) to identify lymph nodes and tumor regions, and then to uncover tumor-area-to-MLN-area ratio (T/MLN). After training, our model's tumor detection performance was comparable to that of experienced pathologists and achieved similar performance on two independent gastric cancer validation cohorts. Further, we demonstrate that T/MLN is an interpretable independent prognostic factor. These findings indicate that deep-learning models could assist not only pathologists in detecting lymph nodes with metastases but also oncologists in exploring new prognostic factors, especially those that are difficult to calculate manually.


Conflict of interest statement

The authors declare no competing interests.

Figures

Fig. 1
Fig. 1. Data and workflow for analysis of cancer lymph node metastasis with deep learning.
a Summary of each dataset. b Representative images for each of the five tissue classes we labeled in the lymph node area. c H&E pathological slides were first scanned to obtain WSIs. The WSIs were then labeled for training networks. The trained networks were used to analyze the patient’s WSIs and applied to clinical practice.
Fig. 2
Fig. 2. Deep-learning framework.
a Slide analysis workflow. b Representative slide identified by deep learning. The slide is first input into the segmentation network to extract the lymph node region and remove tissues such as fat and muscle outside the lymph node. The tissues in the lymph node region are then classified by the classification network to identify the tumor region. The area ratio of tumor metastatic lymph nodes (T/MLNs) is finally calculated based on the heatmaps.
Fig. 3
Fig. 3. Visualization of the prediction results of four slides selected from the CH Hospital 2001–2005 cohort.
We performed the analytical workflow on each slide to identify the lymph node areas of the gastric cancer and generate the heatmap of the tumor areas. We selected four slides with different tumor metastasis ratios. The redder the color, the higher the confidence of the tumor. a WSIs of lymph node tissue, b lymph node areas of segmentation network output, c heatmaps of classification network output, and d partial magnification of the detected tumor area.
Fig. 4
Fig. 4. Kaplan–Meier analysis of cancer-specific survival and distribution statistics of T/MLN in the N stage with low-T/MLN and high-T/MLN at the CH Hospital 2001–2005 cohort.
a KM curve with the N stage. b KM curve with the T/MLN. c Distribution of T/MLN with the N stage (n = 127 patients at N1 stage; n = 153 patients at N2 stage; n = 236 patients at N3 stage). In the violin plot, red lines indicate the median. d KM curve at N1 stage. e KM curve at N2 stage. f KM curve at N3 stage. P values were determined by two-sided log-rank test.
Fig. 5
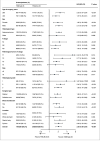
Fig. 5. Forest plot of T/MLN for gastric cancer patients in the analysis of cancer-specific survival from the CH Hospital 2001–2005 cohort.
HRs with 95% CIs in stratified survival analysis with higher T/MLN and lower T/MLN, including age, sex, histological type, N stage, pathological tumor stage, tumor size, histological grade, surgery type, blood transfusion, and location. P values were determined by two-sided log-rank test. Error bars represent the 95% CIs. HR hazard ratio.
Fig. 6
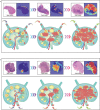
Fig. 6. Visualization of spatial information of metastatic lymph node displaying the potential process of tumor cells spreading in lymph nodes.
a Representative images of HE slides and heatmaps of MLNs and diagrammatic sketch of MLNs showing that tumor cells invaded lymph nodes through afferent lymphatic vessels and gradually eroded the whole lymph nodes. b Representative images and heatmaps of MLNs and diagrammatic sketch of MLNs showing that tumor cells invaded lymph nodes through the hilum of lymph nodes.

References

    1. Bray F, et al. Global cancer statistics 2018: GLOBOCAN estimates of incidence and mortality worldwide for 36 cancers in 185 countries. CA Cancer J. Clin. 2018;68:394–424. doi: 10.3322/caac.21492. - DOI - PubMed
    1. Sandler, M., Howard, A., Zhu, M., Zhmoginov, A. & Chen, L.-C. Mobilenetv2: inverted residuals and linear bottlenecks. In Proceedings of the IEEE Conference on Computer Vision and Pattern Recognition, 4510–4520 (2018).
    1. Cao LL, et al. Evaluation of the Eighth Edition of the American Joint Committee on Cancer TNM Staging System for Gastric Cancer: an analysis of 7371 patients in the SEER Database. Gastroenterol. Res. Pract. 2019;2019:6294382. - PMC - PubMed
    1. Yu G, et al. Tissue microarray analysis reveals strong clinical evidence for a close association between loss of annexin A1 expression and nodal metastasis in gastric cancer. Clin. Exp. Metastasis. 2008;25:695–702. doi: 10.1007/s10585-008-9178-y. - DOI - PubMed
    1. Vestjens JH, et al. Relevant impact of central pathology review on nodal classification in individual breast cancer patients. Ann. Oncol. 2012;23:2561–2566. - PubMed

Publication types