. 2021 Mar 12;12(1):1628.
doi: 10.1038/s41467-021-21884-z.

Single-cell transcriptional changes associated with drug tolerance and response to combination therapies in cancer

Affiliations

Single-cell transcriptional changes associated with drug tolerance and response to combination therapies in cancer

Alexandre F Aissa et al. Nat Commun. .

Abstract

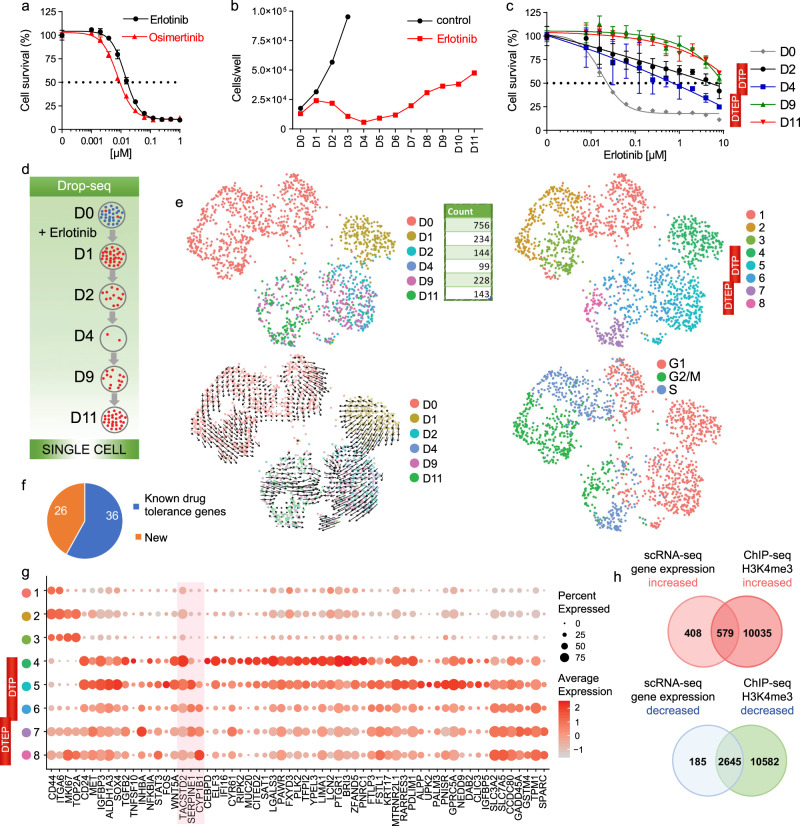
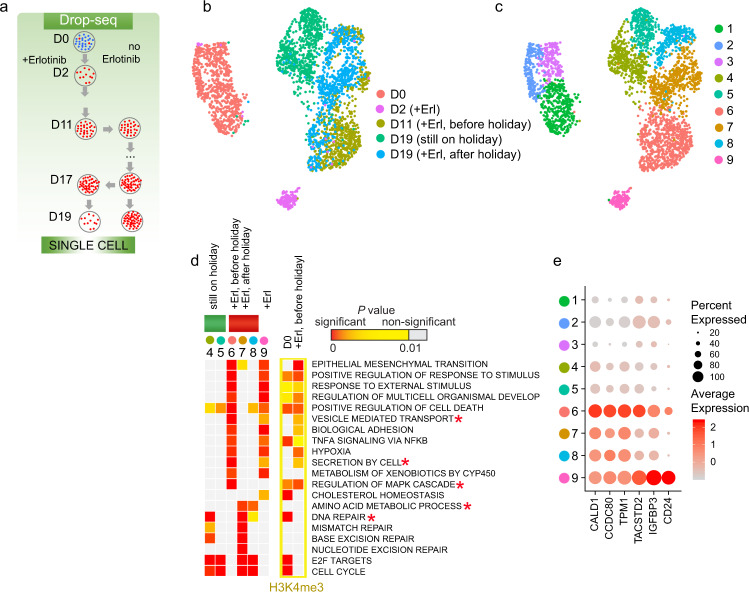
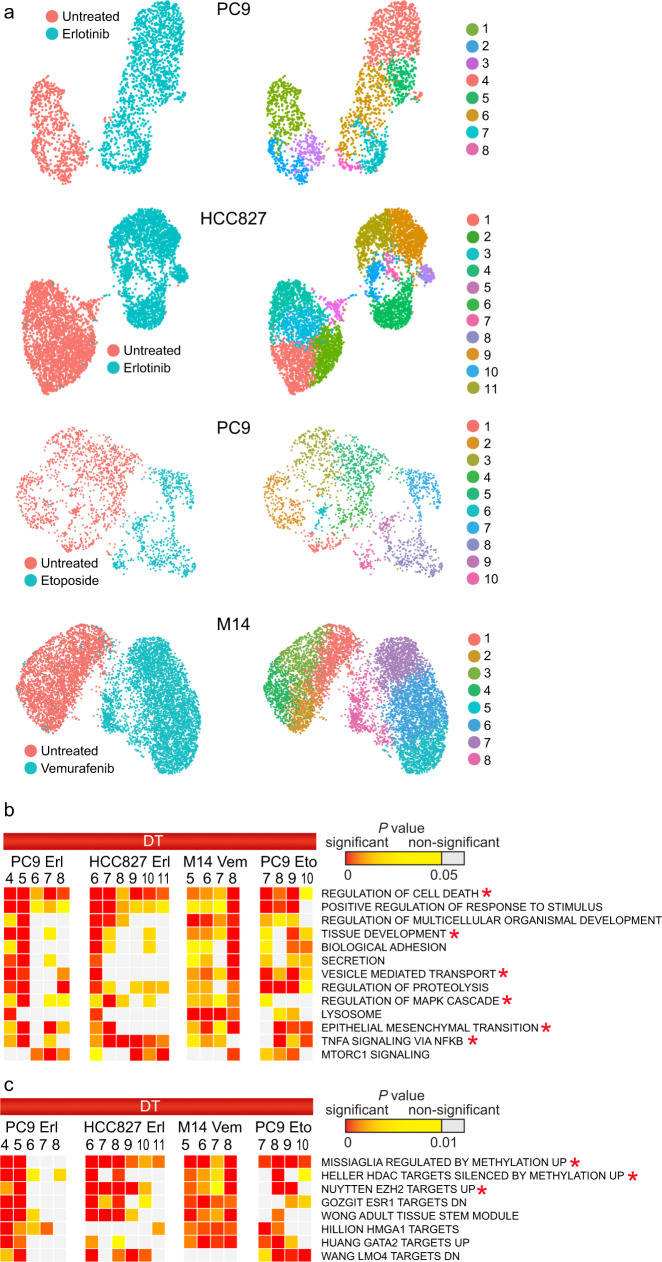
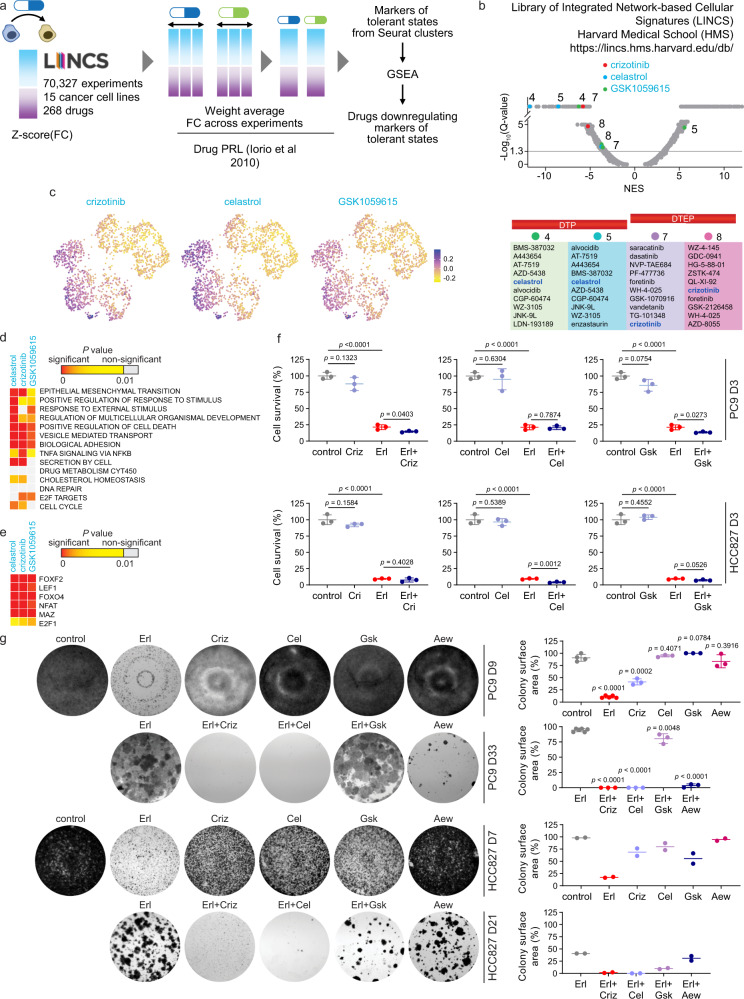
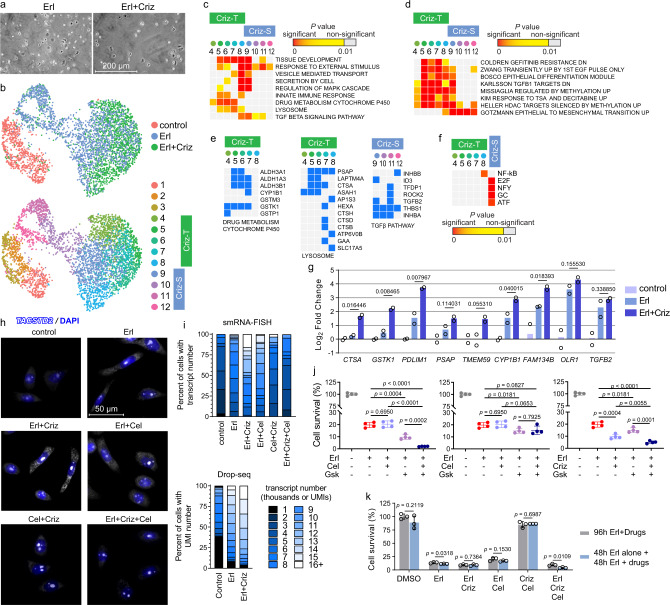
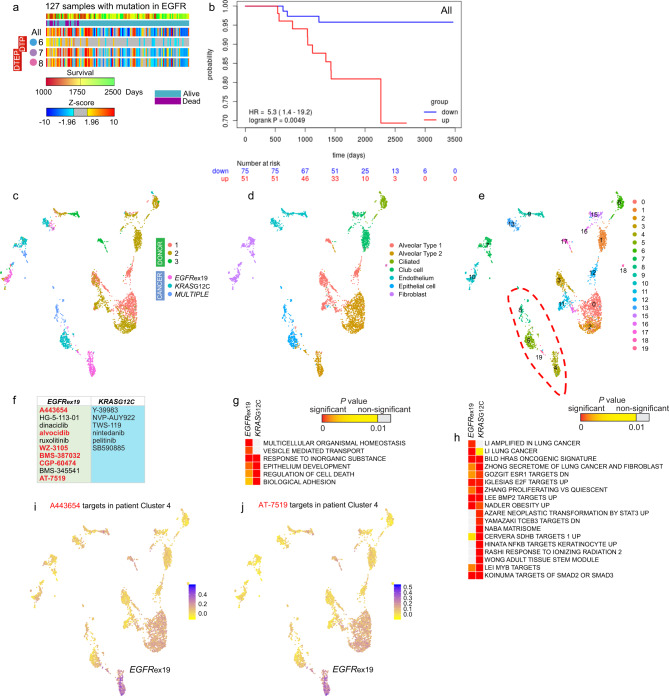
Tyrosine kinase inhibitors were found to be clinically effective for treatment of patients with certain subsets of cancers carrying somatic mutations in receptor tyrosine kinases. However, the duration of clinical response is often limited, and patients ultimately develop drug resistance. Here, we use single-cell RNA sequencing to demonstrate the existence of multiple cancer cell subpopulations within cell lines, xenograft tumors and patient tumors. These subpopulations exhibit epigenetic changes and differential therapeutic sensitivity. Recurrently overrepresented ontologies in genes that are differentially expressed between drug tolerant cell populations and drug sensitive cells include epithelial-to-mesenchymal transition, epithelium development, vesicle mediated transport, drug metabolism and cholesterol homeostasis. We show analysis of identified markers using the LINCS database to predict and functionally validate small molecules that target selected drug tolerant cell populations. In combination with EGFR inhibitors, crizotinib inhibits the emergence of a defined subset of EGFR inhibitor-tolerant clones. In this study, we describe the spectrum of changes associated with drug tolerance and inhibition of specific tolerant cell subpopulations with combination agents.


Conflict of interest statement

The authors declare no competing interests.

Figures

Fig. 1
Fig. 1. Drop-seq recapitulates diversity of drug-tolerant states.
a Dose response of PC9 cells to erlotinib and osimertinib at day 3 of treatment. Cell counting was performed using Hoechst. Mean ± standard deviation (SD) for n = 3 replicate wells are shown. b Growth curve of PC9 cells treated with erlotinib (2 µM) during 11 days (D0–D11), and growth curve of PC9 cells without addition of erlotinib during 3 days (D1–D3). Cell counting was performed using hemocytometer, and data represents mean values for n = 2 replicate wells. c Dose response to erlotinib, describing PC9 cells (D0), and the DTPs and DTEPs generated from the original PC9 cells by treating in 2 µM erlotinib for respective number of days (D2, D4, D9, and D11). D0, D2, D4, D9, and D11 PC9 cells were treated with erlotinib dilution series for 3 days, after which cells were counted using Hoechst, mean ± SD for n = 3 replicate wells. d Schematic for the set of consecutive samples for single-cell RNA-seq. D0 are untreated cells, and D1 through D11 is the duration of treatment with the drug. Drop-seq was done on cells at Day 0 (D0), Day 1 (D1), Day 2 (D2), Day 4 (D4), Day 9 (D9), and Day 11 (D11) of the treatments. e UMAP representation of PC9 cells colored by days of treatment (left top panel), clusters (right top panel), days of treatment with Velocyto projection (left bottom panel), or the cell cycle phase positioning of each cell (right bottom panel). f Literature search with the top markers of tolerant states identified by Drop-seq using the terms [GENE NAME] + chemoresistance, [GENE NAME] + drug, and [GENE NAME] + resistance. g Dot plot of transcript expression for top cluster markers. The color of each dot represents the average expression level from low (gray) to high (red), and the size of each dot represents the percentage of the cells expressing the gene. Markers selected for functional validation are highlighted in red. h Overlap of genes with increased and decreased expression level and H3K4me3 level in PC9 cells treated with erlotinib for 11 days versus untreated.
Fig. 2
Fig. 2. Resuming treatment after drug holiday restores tolerant cell populations and their markers.
a Schematics of drug holiday treatment for scRNA-seq. b UMAP representation of cells colored by days of treatment. c UMAP representation of cells colored by clusters. d Enrichment analysis for genes in relation to gene ontology (GO) biological process (BP), hallmark gene sets, or Kyoto encyclopedia of genes and genomes (KEGG) pathways (MSigDB Collections) is shown for top cluster markers (P < 0.05). To reveal significance of enrichment of the identified gene set signatures at the level of whole cell population, bulk ChIP-seq data and bulk RNA-seq were used to analyze upregulated genes with increased H3K4me3. Data is shown for large gene sets (>20 genes), with at least 10 markers in one DT cluster, P < 105, and at least 10−3 difference with untreated condition. Data represents right tail P values, two-sided binomial statistical test, adjusted for multiple testing using Benjamini–Hochberg FDR method. P values are delineated in a colored heatmap where color-coding indicates the degree of significance: highest significance (red) to least significance (yellow) and non-significant (gray). Terms that were discussed in the main text are indicated by asterisks. e Dot plot of expression for selected markers.
Fig. 3
Fig. 3. Common biological processes can be identified in tolerant subpopulations of distinct cell lines emerging from different treatments.
a UMAP representation of cells in four models of drug tolerance. Cells are colored by days of treatment (left panels) and clusters (right panels). b Enrichment analysis for gene relations to GO BPs, KEGG pathways, or hallmark gene sets (MSigDB Collections) is shown for top markers of tolerant clusters (P < 0.05). Gene sets appearing highly significant at least in three out of four different treatments and with P > 10−4 in any of the clusters of untreated cells are shown. c Enrichment analysis for gene sets associated with chemical and genetic perturbations (CGPs). Gene sets that appear highly significant at least in three out of four different treatments are shown. In b and c, data represents right tail P values, two-sided binomial statistical test, adjusted for multiple testing using Benjamini–Hochberg FDR method. Terms discussed in the text are indicated by asteriscks.
Fig. 4
Fig. 4. Drug tolerant cells are highly heterogenous and represent distinct cell subpopulations and cell states.
a UMAP representation of two PC9 samples, untreated or treated with erlotinib for 3 days, that were analyzed by 10x Genomics scRNA-seq, colored by clusters, with Velocyto projection, and PAGA graph to identify emerging drug-tolerant subpopulations. Arrows reflect the direction in which the nearby cells would travel. PAGA graph is also used to infer trajectory: the size of a circle quantifies the number of cells in the cluster, and the line thickness represents the connectivity strength between clusters. b Heatmap of top markers of each cluster. Cluster annotation is as in a. c Enrichment analysis for top cluster markers (P < 0.05). Top, gene relations to hallmark gene sets or GO BP terms; middle, gene sets associated with CGP datasets; and bottom, epigenetic signatures (MSigDB Collections). Two subpopulations of tolerant cells, I and II, are delineated by blue and green boxes. GO gene sets overlapping with at least 10 markers in one DT cluster, P < 106, were included. Most presented CGPs are representative of several similar experiments, where terms with more than 18 markers and P < 108 at least in one DT cluster, but P > 10−4 in any of the cluster of untreated cells were included. Data represents right tail P values, two-sided binomial statistical test, adjusted for multiple testing using Benjamini–Hochberg FDR method. d Violin plots of expression level for gene sets corresponding to top biological processes, hallmarks, and epigenetic perturbations (MSigDB Collections) in cells at different states of transition to tolerance (from Fig. 1d). The median of the data is shown by the horizontal line.
Fig. 5
Fig. 5. Using LINCS analysis to identify effective drug combinations.
a Identifying candidate molecules for drug combinations using LINCS. The gene expression values were calculated from experiments in LINCS database and used to select drugs that would downregulate the genes identified as markers in this study. Description is provided in the Methods section. b Normalized enrichment scores (NES) for LINCS drugs generated using GSEA. NES corresponds to weighted Kolmogorov–Smirnov-like statistic, FDR was computed by comparing the tails of the observed and null distributions. Relative positioning of the top drugs, crizotinib, celastrol, and GSK1059615, which would significantly downregulate markers of states 4, 5, 7, and 8, are shown on the NES plot. Y-axis tick values depict the levels of significance, with −Log10(Q-values): <1.3 – non-significant, >1.3 but <5 – significant, and >5 – highly significant. Top 10 drugs downregulating tolerant states are listed at the bottom. c Feature plot showing cells colored by score of responsiveness to a drug. The score was calculated by Seurat for the DT markers that would be responsive to the drug. The UMAP is from Fig. 1. d, e Enrichment of gene relations to the terms from MSigDB Collections described for tolerant states among the markers decreased by the drugs. Data represents right tail P values, two-sided binomial statistical test, adjusted for multiple testing using Benjamini–Hochberg FDR method. e shows enrichment of transcription factor targets (TFTs). Each column in d and e represents PC9 DT markers that LINCS analysis predicts to be downregulated by the drug. f Survival assays of PC9 and HCC827 cells treated for 3 days with crizotinib (Criz, 1 µM), celastrol (Cel, 2 µM), and GSK1059615 (Gsk, 1 µM) alone or in combination with erlotinib (1 µM for PC9 and 30 nM for HCC827). Data represents mean ± SD (n = 3). g Colony formation assays of PC9 and HCC827 cells treated for indicated number of days with drugs at the concentrations as in f. The IGF-1R inhibitor AEW541 was used at 1 µM as a control. Representative crystal violet staining of two independent experiments is shown. Plate colony surface area is shown as mean ± SD for n = at least three replicate PC9 wells and as mean values for n = 2 replicate HCC827 wells. In f and g, two-tailed P values were determined by unpaired t test relative to the DMSO control or Erl via GraphPad Prism 7.
Fig. 6
Fig. 6. Crizotinib-tolerant cells represent a subpopulation of erlotinib-tolerant cells.
a, b PC9 cells were treated for 3 days with 2 µM erlotinib (Erl), with 1 µM erlotinib and 1 µM crizotinib (Erl + Criz) or left untreated (control). a Representative microscopic images of the cells. The experiment was repeated six times independently with similar results. b UMAP representation of PC9 cells colored by treatment and by crizotinib-tolerant (Criz-T) and crizotinib-sensitive (Criz-S) clusters. n = 2 biological replicates. c Enrichment analysis for gene relations to GO BP and KEGG pathways terms is shown for top DT cluster markers (P < 0.05). d Enrichment analysis for gene sets associated with CGPs. Gene sets with P < 107 and >11 markers in a DT cluster but P > 10−4 in any untreated cluster are shown. e Criz-T and Criz-S markers in top enriched terms. f Occurrences of TF-binding sites (TFBSs) from TRANSFAC database in promoters of Criz-T cluster markers and combined Criz-S markers. Enriched TFBSs with corrected P < 10−9 are shown in the heatmap. In c, d and f, data represents right tail P values, two-sided binomial statistical test, adjusted for multiple testing using Benjamini–Hochberg FDR method. g Gene expression changes in the levels of Criz-S and Criz-T markers using bulk RNA samples. The RT-qPCR data was normalized to POLR2B level and presented as Log2 fold change relative to DMSO-treated control cells, mean for n = 2 biological replicates. h smRNA-FISH reveals high TACSTD2 expression as a characteristic of Erl + Criz-tolerant cells, which is abrogated by celastrol. The experiment was repeated two times independently with similar results. i Quantitation of fluorescent microscopy images (at the top) and Drop-seq data (at the bottom) showing TACSTD2 transcript abundance. Scaled average expression across cells is shown by the color of the bar, with a darker blue representing a low expression, and white representing a high expression. j Survival assays of PC9 cells treated for 11 days with the drugs as in Fig. 5f. Data represents mean ± SD for n = 4 replicate wells. k Survival assays of PC9 cells subjected to successive drug treatment. Data represents mean ± SD (n = 3). In j and k, two-tailed P values were determined by unpaired t test relative to the simultaneous treatment via GraphPad Prism 7.
Fig. 7
Fig. 7. Crizotinib inhibits the emergence of a defined subset of osimertinib-tolerant cell populations in vivo.
a UMAP representation of tumor cells from mice treated with osimertinib for 3 days and control mice treated with vehicle, colored by clusters (on the right). b Enrichment analysis for top cluster markers (P < 0.05). Data are presented for the terms in Fig. 4c and any additional gene set with P < 3×10⁻⁶ in most of the clusters of either osimertinib-treated or control tumors. Two subpopulations of tolerant cells, I and II, are delineated by blue and green boxes. c UMAP representation of tumor cells from mice treated with the combination of crizotinib and osimertinib, each drug alone and vehicle control. All mice were treated for 3 days. Treatment replicates are colored by the drug (at the top), by clusters (in the middle), and the cell cycle phase positioning of each cell (at the bottom). d Enrichment analysis for markers of DT clusters, which are either crizotinib-tolerant (Criz-T) or crizotinib-sensitive (Criz-S). Data is presented for the terms in Fig. 6c and any additional gene set with at least 10−6 difference in P value in majority of the Criz-T clusters from Criz-S clusters and control tumors. In b and d, data represents right tail P values, two-sided binomial statistical test, adjusted for multiple testing using Benjamini–Hochberg FDR method; gene relations to GO BP terms, KEGG pathways and hallmark gene sets (MSigDB collections) are shown for top markers (P < 0.05).
Fig. 8
Fig. 8. scRNA-seq identifies cancer cell populations and potential drug sensitivity in patient tumors.
a Sample-level enrichment analysis of DT markers, which were identified in the set of consecutive PC9 samples treated with erlotinib, in EGFR-mutant lung adenocarcinomas. Expression level was analyzed for markers of DT states in PC9 cells (Clusters 6, 7, and 8 in Fig. 1, and genes in Supplementary Data 1), for each individual DT state (6, 7, and 8) and for the three DT states altogether (“All”). b Kaplan–Meier estimates of survival before death/censored in 51 patients with significantly upregulated DT markers of three states (All) compared to 75 patients, where DT markers showed decreased expression or no significant change (P > 0.05). Univariate Cox regression was used to determine Hazard Ratio (HR) and log rank P values. ce UMAP representation of the epithelial subset of clusters in six tissues from different patients, colored by assigned cell types in d, and by cluster in e. Cancer cell clusters are indicated by red dotted line. f Top drugs identified in LINCS analysis as downregulating markers of EGFRex19 and KRASG12C patient tumors. Small molecules overlapping with top 10 LINCS drugs predicted for DT PC9 clusters are in red. g Enrichment analysis of EGFRex19 cancer cluster markers (n = 78) and KRASG12C cancer cluster markers (n = 102) for gene relations to GO BP terms. Terms with P < 10−6 were included. h Enrichment analysis of cancer cluster markers for CGP gene sets. Gene sets with P < 5 × 10−6 and >6 markers were included. In g and h, data represents right tail P values, two-sided binomial statistical test, adjusted for multiple testing using Benjamini-Hochberg FDR method. i, j Feature plots showing cells colored by expression level of genes targeted by the AKT inhibitor A443654 or CDK inhibitor AT-7519 identified in the LINCS analysis. The score was calculated by Seurat and was based on expression level of markers of EGFRex19 patient cancer cells (Cluster 4 in e and genes from Supplementary Data 27).

References

    1. Lynch TJ, et al. Activating mutations in the epidermal growth factor receptor underlying responsiveness of non-small-cell lung cancer to gefitinib. N. Engl. J. Med. 2004;350:2129–2139. doi: 10.1056/NEJMoa040938. - DOI - PubMed
    1. Amann J, et al. Aberrant epidermal growth factor receptor signaling and enhanced sensitivity to EGFR inhibitors in lung cancer. Cancer Res. 2005;65:226–235. - PubMed
    1. Paez JG, et al. EGFR mutations in lung cancer: correlation with clinical response to gefitinib therapy. Science. 2004;304:1497–1500. doi: 10.1126/science.1099314. - DOI - PubMed
    1. Niederst MJ, Engelman JA. Bypass mechanisms of resistance to receptor tyrosine kinase inhibition in lung cancer. Sci. Signal. 2013;6:re6–re6. doi: 10.1126/scisignal.2004652. - DOI - PMC - PubMed
    1. Rotow J, Bivona TG. Understanding and targeting resistance mechanisms in NSCLC. Nat. Rev. Cancer. 2017;17:637–658. doi: 10.1038/nrc.2017.84. - DOI - PubMed

Publication types

MeSH terms