

Aptardi predicts polyadenylation sites in sample-specific transcriptomes using high-throughput RNA sequencing and DNA sequence
- PMID: 33712618
- PMCID: PMC7955126
- DOI: 10.1038/s41467-021-21894-x
Aptardi predicts polyadenylation sites in sample-specific transcriptomes using high-throughput RNA sequencing and DNA sequence
Abstract
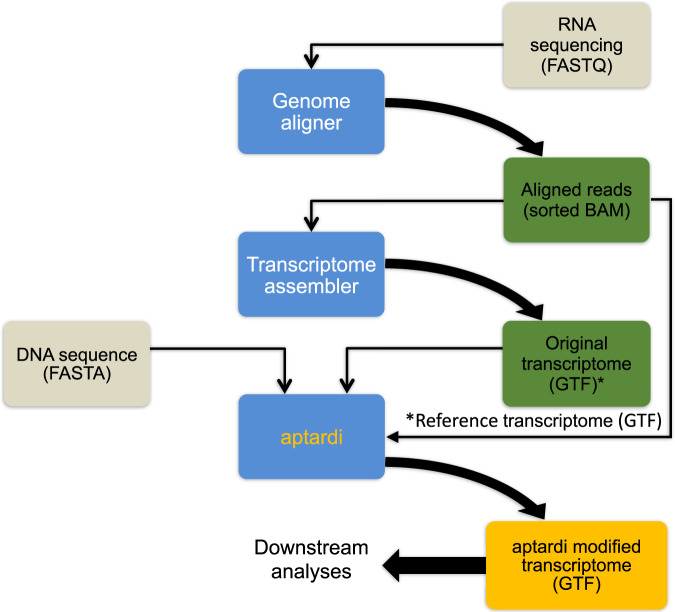
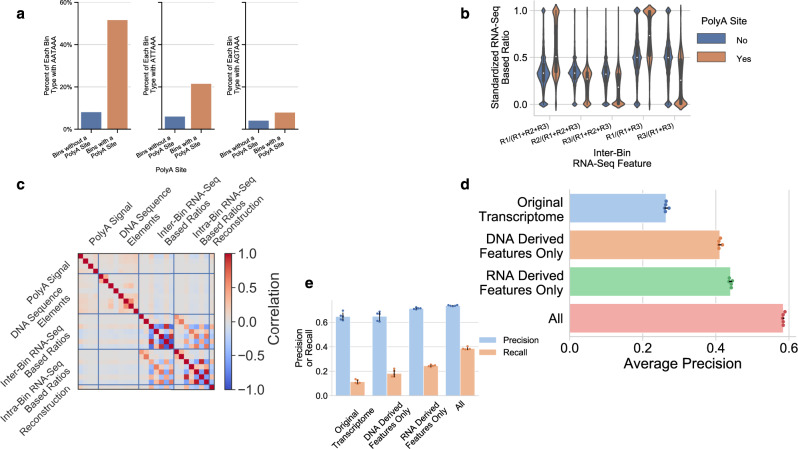
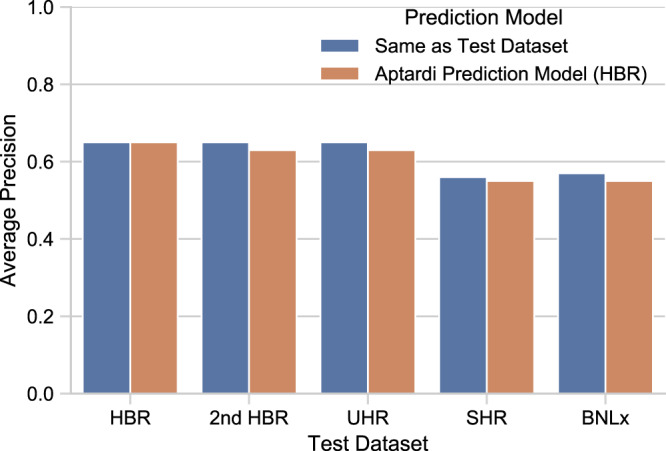
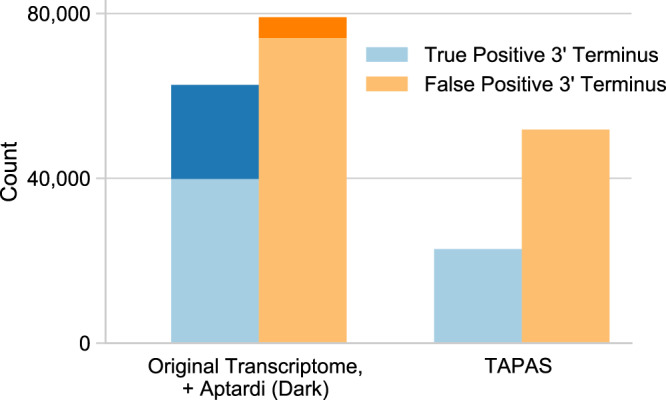
Annotation of polyadenylation sites from short-read RNA sequencing alone is a challenging computational task. Other algorithms rooted in DNA sequence predict potential polyadenylation sites; however, in vivo expression of a particular site varies based on a myriad of conditions. Here, we introduce aptardi (alternative polyadenylation transcriptome analysis from RNA-Seq data and DNA sequence information), which leverages both DNA sequence and RNA sequencing in a machine learning paradigm to predict expressed polyadenylation sites. Specifically, as input aptardi takes DNA nucleotide sequence, genome-aligned RNA-Seq data, and an initial transcriptome. The program evaluates these initial transcripts to identify expressed polyadenylation sites in the biological sample and refines transcript 3'-ends accordingly. The average precision of the aptardi model is twice that of a standard transcriptome assembler. In particular, the recall of the aptardi model (the proportion of true polyadenylation sites detected by the algorithm) is improved by over three-fold. Also, the model-trained using the Human Brain Reference RNA commercial standard-performs well when applied to RNA-sequencing samples from different tissues and different mammalian species. Finally, aptardi's input is simple to compile and its output is easily amenable to downstream analyses such as quantitation and differential expression.
Conflict of interest statement
The authors declare no competing interests.
Figures
Similar articles
-
RNA sequencing and quantitation using the Helicos Genetic Analysis System.Methods Mol Biol. 2011;733:37-49. doi: 10.1007/978-1-61779-089-8_3. Methods Mol Biol. 2011. PMID: 21431761
-
Accurate transcriptome-wide identification and quantification of alternative polyadenylation from RNA-seq data with APAIQ.Genome Res. 2023 Apr;33(4):644-657. doi: 10.1101/gr.277177.122. Epub 2023 Apr 28. Genome Res. 2023. PMID: 37117035 Free PMC article.
-
RAP: A Web Tool for RNA-Seq Data Analysis.Methods Mol Biol. 2021;2284:393-415. doi: 10.1007/978-1-0716-1307-8_21. Methods Mol Biol. 2021. PMID: 33835454
-
Alternative mRNA transcription, processing, and translation: insights from RNA sequencing.Trends Genet. 2015 Mar;31(3):128-39. doi: 10.1016/j.tig.2015.01.001. Epub 2015 Jan 30. Trends Genet. 2015. PMID: 25648499 Review.
-
Analyses of alternative polyadenylation: from old school biochemistry to high-throughput technologies.BMB Rep. 2017 Apr;50(4):201-207. doi: 10.5483/bmbrep.2017.50.4.019. BMB Rep. 2017. PMID: 28148393 Free PMC article. Review.
Cited by
-
InPACT: a computational method for accurate characterization of intronic polyadenylation from RNA sequencing data.Nat Commun. 2024 Mar 22;15(1):2583. doi: 10.1038/s41467-024-46875-8. Nat Commun. 2024. PMID: 38519498 Free PMC article.
-
Leveraging omic features with F3UTER enables identification of unannotated 3'UTRs for synaptic genes.Nat Commun. 2022 Apr 27;13(1):2270. doi: 10.1038/s41467-022-30017-z. Nat Commun. 2022. PMID: 35477703 Free PMC article.
-
TDP-43 loss induces extensive cryptic polyadenylation in ALS/FTD.bioRxiv [Preprint]. 2024 Jan 23:2024.01.22.576625. doi: 10.1101/2024.01.22.576625. bioRxiv. 2024. PMID: 38313254 Free PMC article. Preprint.
-
Hypoviral-regulated HSP90 co-chaperone p23 (CpCop23) determines the colony morphology, virulence, and viral response of chestnut blight fungus Cryphonectria parasitica.Mol Plant Pathol. 2023 May;24(5):413-424. doi: 10.1111/mpp.13308. Epub 2023 Feb 10. Mol Plant Pathol. 2023. PMID: 36762926 Free PMC article.
-
Extensible benchmarking of methods that identify and quantify polyadenylation sites from RNA-seq data.RNA. 2023 Dec;29(12):1839-1855. doi: 10.1261/rna.079849.123. Epub 2023 Oct 10. RNA. 2023. PMID: 37816550 Free PMC article. Review.
References
Publication types
MeSH terms
Substances
Grants and funding
LinkOut - more resources
Full Text Sources
Other Literature Sources
