. 2021 Mar 12;12(1):1618.
doi: 10.1038/s41467-021-21907-9.

Integrated cytokine and metabolite analysis reveals immunometabolic reprogramming in COVID-19 patients with therapeutic implications

Affiliations

Integrated cytokine and metabolite analysis reveals immunometabolic reprogramming in COVID-19 patients with therapeutic implications

Nan Xiao et al. Nat Commun. .

Abstract

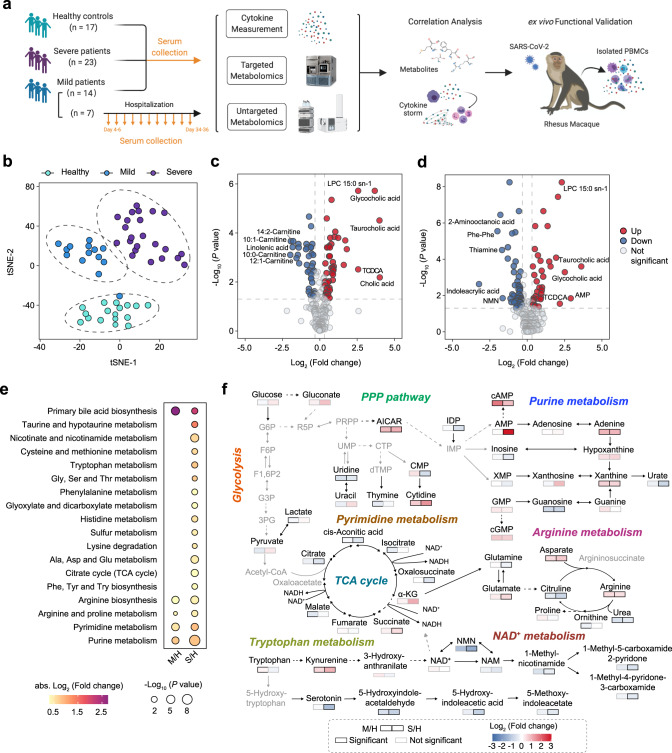
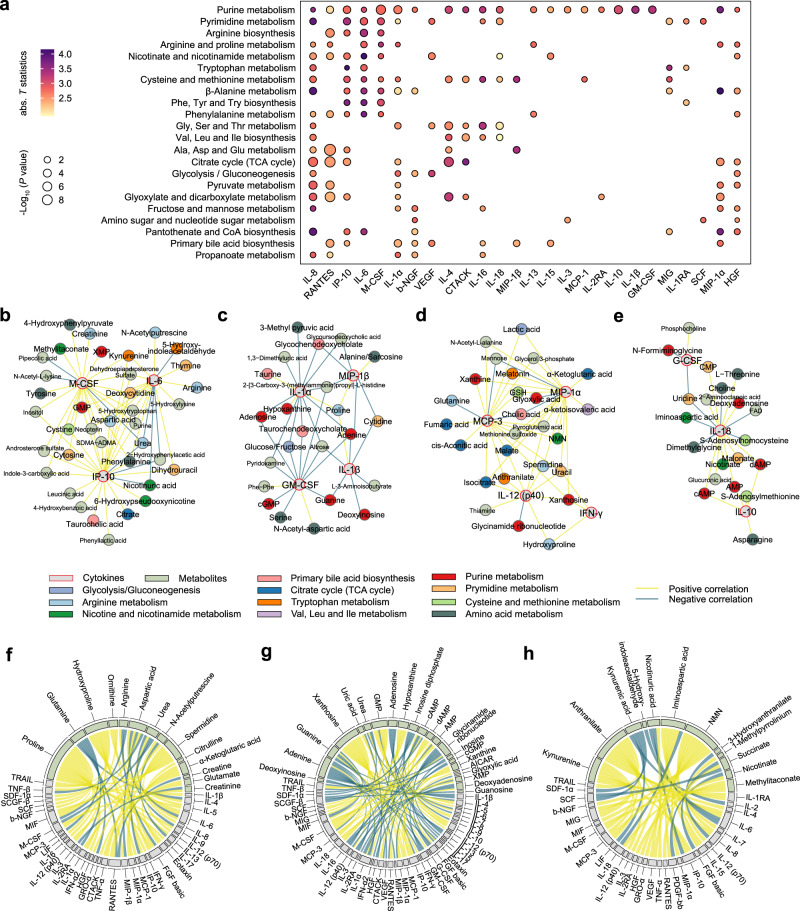
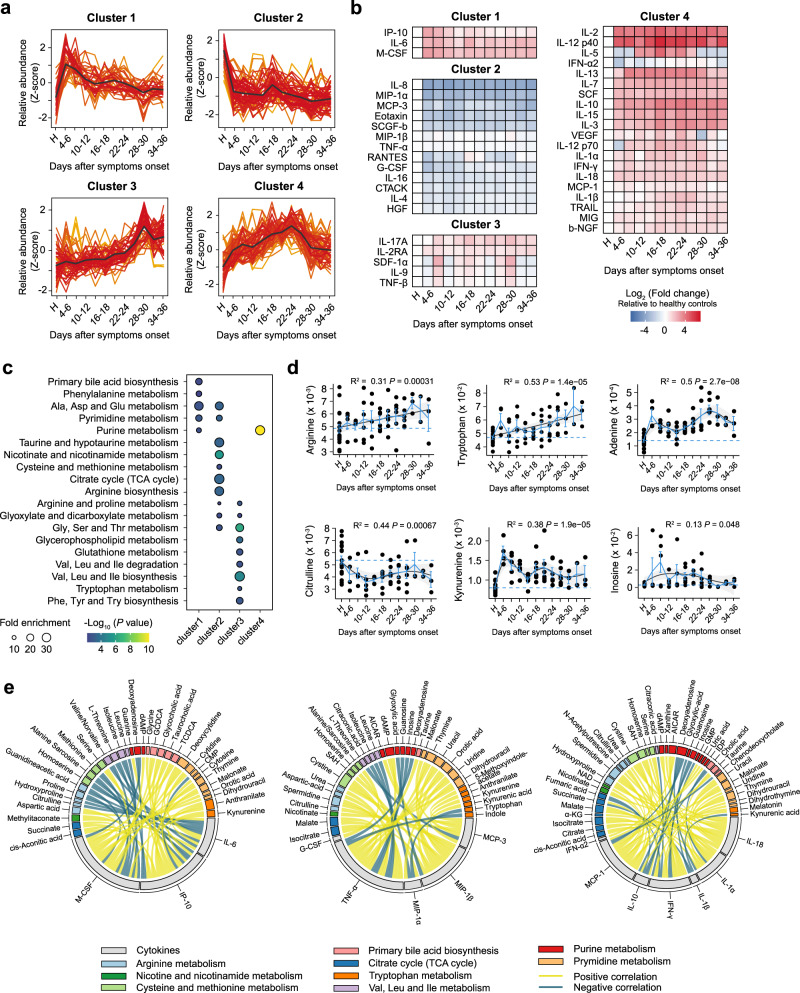
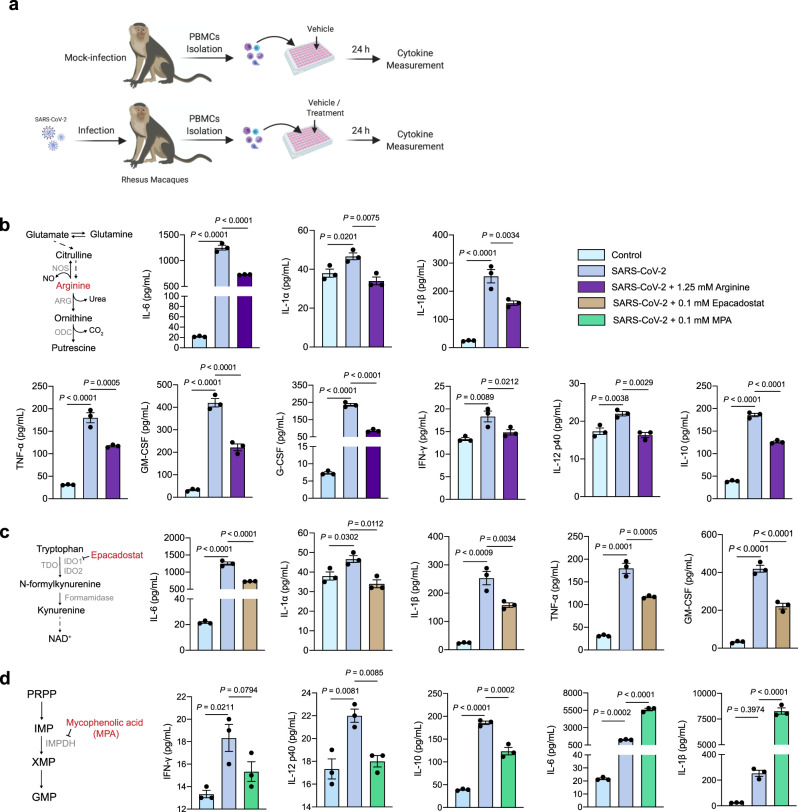
Cytokine release syndrome (CRS) is a major cause of the multi-organ injury and fatal outcome induced by SARS-CoV-2 infection in severe COVID-19 patients. Metabolism can modulate the immune responses against infectious diseases, yet our understanding remains limited on how host metabolism correlates with inflammatory responses and affects cytokine release in COVID-19 patients. Here we perform both metabolomics and cytokine/chemokine profiling on serum samples from healthy controls, mild and severe COVID-19 patients, and delineate their global metabolic and immune response landscape. Correlation analyses show tight associations between metabolites and proinflammatory cytokines/chemokines, such as IL-6, M-CSF, IL-1α, IL-1β, and imply a potential regulatory crosstalk between arginine, tryptophan, purine metabolism and hyperinflammation. Importantly, we also demonstrate that targeting metabolism markedly modulates the proinflammatory cytokines release by peripheral blood mononuclear cells isolated from SARS-CoV-2-infected rhesus macaques ex vivo, hinting that exploiting metabolic alterations may be a potential strategy for treating fatal CRS in COVID-19.


Conflict of interest statement

The authors declare no competing interests.

Figures

Fig. 1
Fig. 1. Study design and metabolic profiling in serum samples from mild and severe COVID-19 patients.
a Overview of cohort (including 21 mild patients, 23 severe COVID-19 patients, and 17 healthy controls) and the study design. b t-SNE plot distributed healthy controls (n = 17), mild patients (n = 14), and severe patients (n = 23) according to serum metabolites detected from targeted and untargeted metabolomics. c, d Volcano plots comparing serum metabolites of mild (c) or severe (d) patients with healthy controls. Significantly altered metabolites are highlighted in red (increased) and blue (decreased). The top 5 metabolites that significantly increased or decreased are marked with text. Two-sided Mann-Whitney U test followed by Benjamini-Hochberg (BH) multiple comparison test with FDR < 0.05 and fold change >1.25 or <0.8. e KEGG metabolic pathways enriched by significantly changed serum metabolites in mild (c) and severe (d) patients. One-sided Fisher’s exact test followed by BH multiple comparison test with FDR < 0.1. f Schematic depicting the key disturbed metabolic pathways in response to SARS-CoV-2 infection. Gray nodes represent metabolites that were not tested. Metabolite alterations are represented by color intensity, and borders are color-coded by statistical significance.
Fig. 2
Fig. 2. Metabolite–cytokine correlation in serum samples from COVID-19 patients.
a Pathway enrichment analysis of metabolites significantly associated with the indicated cytokines in severe patients (n = 23). Two-sided t test followed by Benjamini-Hochberg (BH) multiple comparison test with FDR < 0.1. “abs. T statistics” is the mean absolute T statistics of significant metabolites in the pathway and is represented by color intensity. The dot size represents pathway significance (one-sided Fisher’s exact test followed by BH multiple comparison test). be Correlation networks of key CRS-related cytokines and metabolites in severe patients. Nodes and edges are color-coded by molecule types and metabolic pathways, and association directions, respectively. Networks were clustered by fast greedy modularity optimization algorithm. fh Chord diagrams depicting the significant correlations of cytokines with metabolites involved in arginine metabolism (f), purine metabolism (g), tryptophan and NAD+ metabolism (h), respectively, in severe patients. Chords are color-coded by association directions consistent with (be).
Fig. 3
Fig. 3. Longitudinal trajectories and metabolite–cytokine correlation in mild COVID-19 patients.
a Longitudinal trajectory clustering of significantly changed serum metabolites, cytokines in follow-up patients (n = 7) with mild COVID-19. Metabolite and cytokine abundance in healthy controls were used as base line. Black lines represent the average trajectory for each cluster. b Heatmap comparison of cytokines at distinct time-points in follow-up patients (n = 7). Color intensity represents the Log2 fold change of mean cytokine abundance in each interval relative to healthy controls. c Pathway enrichment analysis of metabolites in each cluster. One-sided Fisher’s exact test followed by Benjamini-Hochberg (BH) multiple comparison test with FDR < 0.1. d Relative abundance trajectories of metabolites in follow-up patients (n = 7). Blue solid lines pass through the mean of each measurement at the specific time interval, and dotted lines represent the mean of measurements in healthy controls (n = 17). Generalized additive model (GAM) regression lines are represented by the black solid lines, with 95% confidence intervals for the regression line donated by gray filled areas. P value was assessed by one-way ANOVA. Data are presented as mean ± SEM. with individual data points shown. e Chord diagrams of significant associations between metabolites and core CRS-related cytokines in cluster 1 (left), cluster 2 (middle), and clusters 3 and 4 (right), respectively. Two-sided t test followed by BH multiple comparison test.
Fig. 4
Fig. 4. Targeting metabolism modulates cytokine release in PBMCs ex vivo model.
a Schematic representation of the experimental workflow. PBMCs, isolated from peripheral blood of the mock-infected and SARS-CoV-2-infected rhesus macaques, were seeded in 96-well plates with vehicle or different drugs dissolved in medium; 24 h post-seeding, cytokine abundance in cell culture was quantified. bd Metabolism diagrams and level of indicated cytokines and chemokines measured 24 h after supplementation of 1.25 mM arginine (b), 0.1 mM IDO1 inhibitor Epacadostat (c), and 0.1 mM inosine monophosphate dehydrogenase (IMPDH) inhibitor mycophenolic acid (MPA, d) in PBMCs (n = 3). Data are presented as mean ± SEM. with individual data points shown. One-way ANOVA followed by Benjamini-Hochberg (BH) multiple comparison test.

Similar articles

Cited by

References

    1. Huang C, et al. Clinical features of patients infected with 2019 novel coronavirus in Wuhan, China. Lancet. 2020;395:497–506. - PMC - PubMed
    1. Mehta P, et al. COVID-19: consider cytokine storm syndromes and immunosuppression. Lancet. 2020;395:1033–1034. doi: 10.1016/S0140-6736(20)30628-0. - DOI - PMC - PubMed
    1. Cao X. COVID-19: immunopathology and its implications for therapy. Nat. Rev. Immunol. 2020;20:269–270. doi: 10.1038/s41577-020-0308-3. - DOI - PMC - PubMed
    1. Mangalmurti N, Hunter CA. Cytokine storms: understanding COVID-19. Immunity. 2020;53:19–25. doi: 10.1016/j.immuni.2020.06.017. - DOI - PMC - PubMed
    1. Zhang X, et al. Viral and host factors related to the clinical outcome of COVID-19. Nature. 2020;583:437–440. doi: 10.1038/s41586-020-2355-0. - DOI - PubMed

Publication types

MeSH terms